
Research article · 2024 · Full text
International Journal of Agriculture and Food ScienceDoes social network affect farm income and poverty status? Empirical evidence from farming households in Osun state, Nigeria
Volume 6(2) · Pages 38–46 · DOI: 10.33545/2664844x.2024.v6.i2a.203 ↗
Research areasMicrofinance and Financial InclusionSocial Capital and NetworksAgricultural Innovations and Practices
Abstract
Author-writtenThe agricultural sector has a multiplier effect on any nation's socio-economic and industrial framework as a result of the multidimensional nature of agriculture. The first and second goal of the Sustainable Development Goals (SDGs) targets no poverty and zero hunger and so, this study examined the impact of social network on farm income and poverty status among farming households in Osun State, Nigeria. Membership of farmers’ association is used as a proxy to social network in this paper. Multistage sampling procedure was used to select 379 respondents. Endogenous Switching Regression Model and Recursive Bivariate Probit Model were used to carry out the impact analysis. The empirical findings revealed that years of education, household size, farm size, farming as major occupation, farming experience and land management practice significantly influenced social network (membership of farmers’ association). Furthermore, social network (membership of farmers’ association) increased farm income and reduced poverty status of farming households in Osun State. Conclusively, social network is established to improve farm income while reducing poverty status. Therefore, establishment of more farmers’ association should be encouraged so as to improve the economic status of the farmers and invariably enhance their food security status.
Summary
Source-checkedPlain-language reading of the full paper, prepared with AI and checked against the text. Each point links to the authors' own words.
Why it matters
- The agricultural sector is critical because it has a multiplier effect on a nation's industrial and socio-economic framework. View evidence ↗
- The study is aligned with the first two Sustainable Development Goals, which aim for zero hunger and no poverty. View evidence ↗
The question
- The study aims to examine how social networks (specifically farmers' association membership) impact the poverty status and farm income of households in Osun State, Nigeria. View evidence ↗
What they did
- The researchers used a multi-stage sampling technique to select 379 respondents from farming households in Osun State. View evidence ↗
- The impact analysis was conducted using two models: the Endogenous Switching Regression Model and the Recursive Bivariate Probit Model. View evidence ↗
- Primary data was collected from respondents using structured questionnaires administered by trained field workers. View evidence ↗
What they found
- Factors that significantly influenced whether a farmer joined an association included their farm size, household size, years of education, farming experience, land management practices, and whether farming was their primary occupation. View evidence ↗
- Membership in a farmers' association increased farm income, with members having an expected income of 13.39 compared to 13.31 for non-members, a causal increase of 0.6%. View evidence ↗
- Social networks reduced poverty status, with the probability of poverty dropping from 86% for non-members to 48% for members of farmers' associations. View evidence ↗
- An increase in household size was found to increase poverty status by 5.5% per additional member. View evidence ↗
- Surprisingly, the study found that each additional visit from an extension agent was associated with a 28.3% increase in poverty status. View evidence ↗
What it means
- The authors conclude that social networks effectively improve farm income and reduce poverty among farming households. View evidence ↗
- The authors recommend encouraging the establishment of more farmers' associations to improve the economic status of farmers. View evidence ↗
Visual summary
2 visualsIllustrations explain the paper; charts are replotted from the paper's own table values.
Impact of Social Networks on Farmer Welfare
AI-generated conceptual illustration (Cassava and maize crops in a Nigerian farm setting). It explains the idea and does not show study data.
View source evidence ↗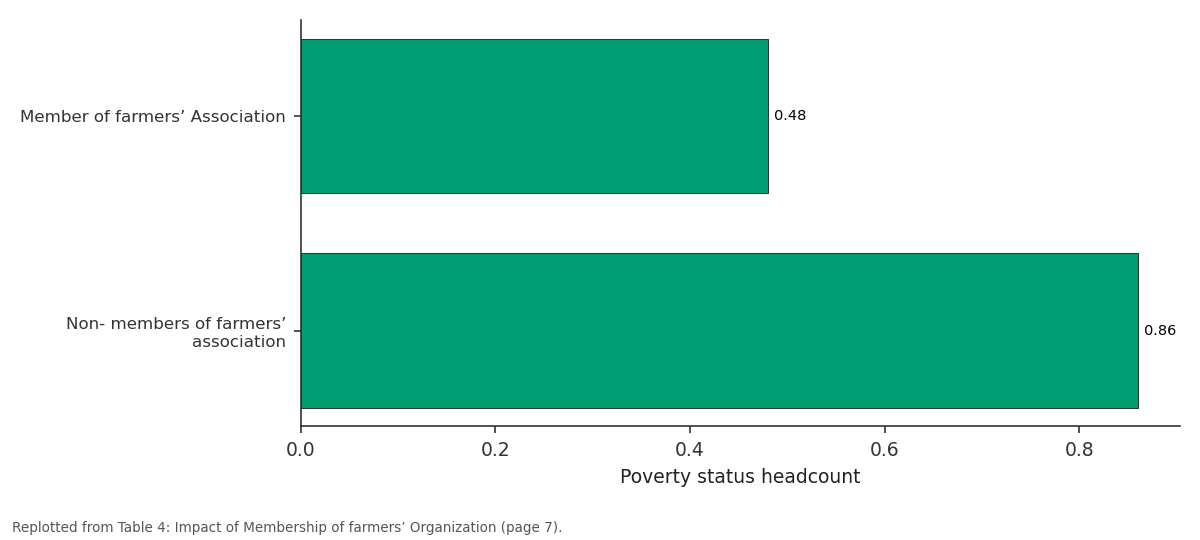
Poverty status headcount: Member of farmers’... vs Non- members of...
Replotted from Table 4 (page 7) of the original paper. Every bar is the paper's own table value.
View source evidence ↗Figures & tables
From the original paper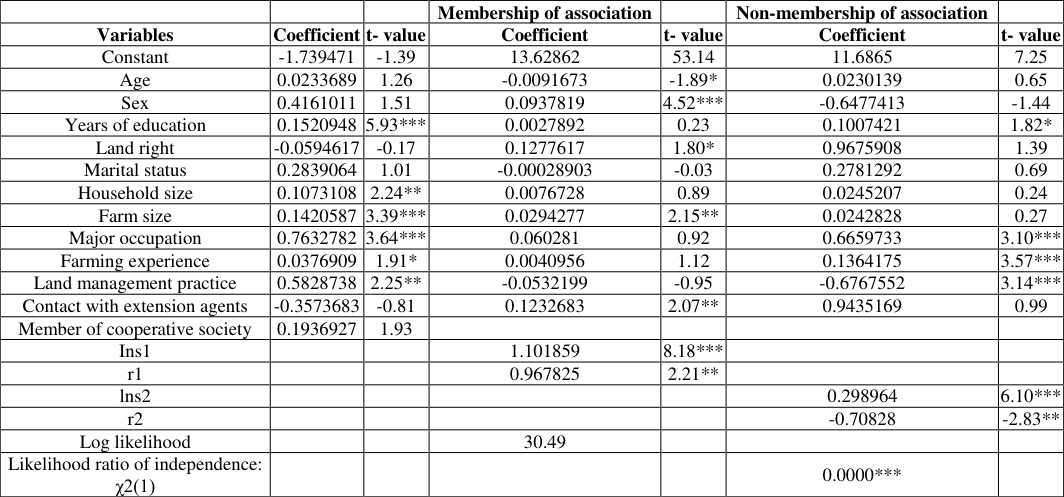 Table 1
 Table 2
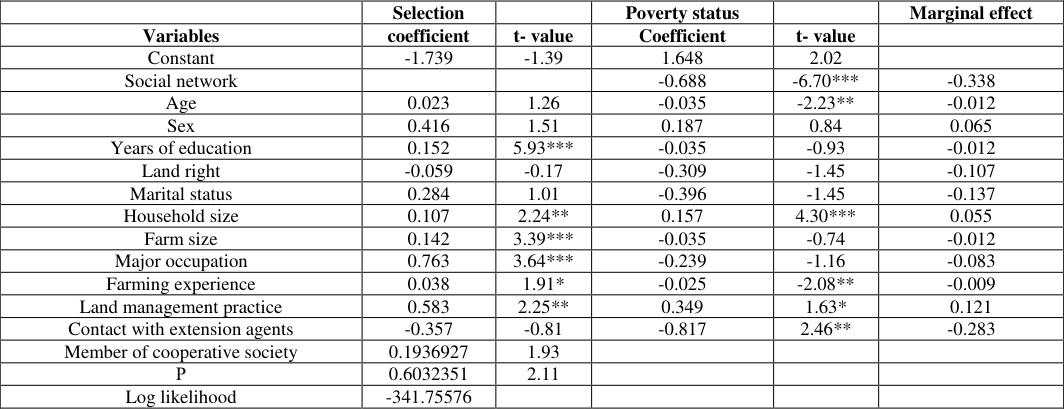 Table 3
 Table 4
Introduction
Countries adopted Sustainable Development Goals (SDGs) on September 25 th , 2015 to end poverty, protect the planet, and ensure prosperity for everyone as part of a new sustainable development agenda. There are a total of seventeen goals with each having definite targets to be actualised over the next 15 years but of prominence are Goals 1 and 2 which target no poverty and zero hunger. Goal 2 which is a major concern aims to end hunger, achieve food security and improved nutrition and promote sustainable agriculture within the next fifteen year starting from 2016. Even though Nigeria relies mostly on the oil industry for its budgetary revenue, it is assumed that if the agricultural sector is well managed and improved, it would significantly increase the country's gross domestic product and even substitute oil on the top of the list taking into consideration the vast area of fertile land that is unused in Nigeria. A sturdy and a competent agricultural sector would enable any country to feed its increasing population, create employment, earn foreign exchange and make raw materials available to industries. The agricultural sector has a multiplier effect on any nation's socioeconomic and industrial framework because of the multidimensional nature of agriculture. Effective information sharing among farmers, researchers and extension service agents is greatly aided by interactions in social networks that occur freely through social ties rather than top-down bureaucratic models (Matuschke, 2008) [26] . Valente (1996) [39] described social networks as a pattern of friendship, advice, communication or support which exists among the members of a social system. Ability to learn in social networks is greatly influenced by tie strength, which reflects the closeness and frequency of interactions among the individuals concerned (Granovetter, 2005) [10] . Social ties as a channel for learning determine to a very great extent the nature of information shared in the social system (Haythornthwaite, 1996) [11] .
It is on this basis that being members of farmers' association was used in this paper as a proxy for social network as it is the most common social network among farmers. This helps the members of the association to increase their access to vital information, grants, and improved technology which then brings benefits to the members by promoting production, productivity enhancement and an appreciable surge in income. Becoming a member of farmer's associations is a major factor that helps the farmer to have access to relevant information which ultimately enhances productivity (Bernard et al., 2008; Bachke 2009; Adewakun 2012; Muchopa 2011) [6,5,1,28] . It can be affirmed that being members of a particular farmers association is able to create opportunities for the members to gain access to agricultural credit schemes and support services, market information, and management knowledge (Hellin et al., 2009; Mwaura 2014) [13,29] . Nigeria is currently experiencing a surge in prices of food items and other essential amenities, with inflation on the rise and political instability. Life in the city is becoming difficult not to talk of those dwelling in the rural areas, especially the farmers. The time frame for the achievement of the SDGs is almost here with little or nothing to show as a nation. To the best of my knowledge, empirical studies on social network, farm income and poverty status connection appear to be scarce in Nigeria, especially in Osun State. It is therefore necessary to carry out this study which develops a framework that measures the impact of social network (Membership of farmers' organization) on farm income and poverty status of farmers in Osun State, Nigeria. This was achieved through the following objectives: 1. To examine the impact of social network (Membership of farmers' organization) on farm income of farming households in the study area, and 2. To examine the impact of social network (Membership of farmers' organization) on poverty status of farming households in the study area.
Literature Review
According to Baah (2008) [4] , he reiterated that associations from the cocoa industry in Ghana could help the farmers to strengthen their possibilities of accessing credit loans and market information, and be a means of awareness of new policies and services. These helpful supports will enable farmers to have high productivity and income. Mohamed and Mansaray (2016) [27] emphasized that associations also encourage farmers to join programs of agricultural and rural development which invariably brings significant benefits for farmers in Loko region of Northern Sierra Leone. Membership of associations can help the farmers to access benefits in terms of socio and economic form by actively participating in the group activities of their associations (Fisher and Qaim, 2012) [9] . This was reiterated by Simonovic (2016) [36] , when 28.2% interviewed farmers ascertained that their membership of farmers association assisted them to derive remarkable benefits. Alternatively, according to (Sheilla et al., 2015) [35] , farmers' associations help members through cooperative business activities, improving the livelihood for farmers in rural areas of sub-Saharan Africa (Kenya and East Africa). It can therefore be said that joining associations will help farmers to garner supports in form of capital, technology and latest farming techniques that will ensure a stable selling market. These activities can further create collaboration among members to meet up with market demands and build closer teamwork when working together. In the same vein, Tran (2017) [37] stated that a major way of achieving high productivity for producers is to increase capital for production or joining associations.
Previously, studies have used the linear regressive model to examine the impact of farmers' associations to changes in livelihood and household income. Binomial logit regression model was adopted by Ekepu and Tirivanhu (2017) [7] to test the role of associations and socioeconomic factors that influence the income of sorghum bicolor farmers in Uganda. Tobit model was utilized by Van Hung et al., (2019) [41] to estimate impact factors to the production efficiency of rice farming where they concluded that membership of associations enables farmers to gain more knowledge and experience through sharing and gaining additional information, which ultimately helps in improving their production efficiency. A few studies have used the probit regression model to estimate how membership of farmers association can influence household incomes (Tolno et al., 2015; and Mpiira et al., 2013) [38,30] . On the contrary, Idowu and Oladeji (2019) [18] applied the probit model to calculate levels of impact from cooperatives to income and livelihood of stock farms comprising goat, sheep, poultry, pig, and catfish. He authenticated that the income coefficient has a negative relation with the membership of cooperatives and significance of 10%. This supports the belief that farmers with little capital are often more willing to join associations in order to derive benefits from their membership. In Vietnam, some studies have used the linear regression model in evaluating the role of association to the household's income, but they only examined one aspect of impacts from membership. As far as I know, few studies used OLS, Probit and Tobit models to estimate the impact of farmers membership on their income but in this study, Endogenous Switching Regression model was used to examine the impact of social network on farm income of farming households in the study area because it considers selection bias due to both observable and unobservable issues and suitable for expected outcome that is continuous in nature such as farm income. Recursive Bivariate Probit regression model was adopted to examine the impact of social network on poverty status of farming households in the study area because it accounts for endogeneity and selection bias.
Endogenous switching regression
To estimate the impact of membership of farmer's association on farm income through the use of Endogenous Switching Regression (ESR) framework, a two-stage estimation procedure is involved. At the first stage, the model for the determinants of membership of farmer's association is estimated and second stage involves the estimation of association between the outcome variable (Farm income) and a set of explanatory variables specified for two regimes membership and non-membership of farmers association). Membership and non-membership of farmers' association were represented by R1i and R2i respectively, while the unobserved net welfare of the farmer i is denoted by Ri* = R1i -R2i. The function that specifies the household membership of farmer's association status is indicated as follows;
The basic relationship used here is that net welfare from membership of farmer's association status is stated in relation to a vector of household independent variables (Xi) in a latent variable framework. The relationship, which is the determinants of membership of farmer's association in the first stage, is expressed as follows;
where Ri is a dichotomous variable with 1= farmers that are members of farmer's association and 0 otherwise, X represents all observable determinants of membership of farmer's association status, for example, household characteristics, α is a vector of parameters to be estimated, ɛ is the error term with mean zero, and variance σɛ2 which captures measurement errors and unobserved factors.
The relationship being considered in examining the impact of social network on farm income assumes that vector of outcome variable is a linear function of a vector of explanatory variables (Xi) and membership of farmer's association status which is a dichotomous variable (Ri). The relationship can be expressed as follows:
where variable Yi represents the outcome variables, Ki represents variables of farm and household characteristics, Ri is the membership of farmer's association status, μi is an error term while β and γ are parameters to be estimated.
In the course of carrying out impact evaluation, researchers are only aware of the observed attributes declared by the respondents, while other unobservable factors are known to only the respondents. In view of this, selection bias ensues if error terms of the outcome equation, (μ) in equation 3 and selection equation (ɛ) in equation 1 are influenced by unobservable factors. Therefore, correlation of the error terms (ρ=corr(ɛ,μ) ≠ 0) of the outcome and selection equations will come into play and ordinary least square tends to give biased estimates. Authors such as Nkala et al., (2011) [31] have employed Propensity Score-Matching (PSM) Approach in impact evaluation of technology on household welfare when there is self-selection. Endogenous Switching Regression model approach which was developed by Lokshin and Sajaia (2004) [23] is employed in order to concurrently estimate the determinants and impact of membership of farmer's association with consideration being given to observable and unobservable factors. This considers both endogeneity and heterogeneity.
The specifications for the two regimes in the second stage are as follows;
Regime1 (Membership of farmer's association):
Regime 2 (Non membership of farmer's association):
where Y1i and Y2i are outcome variables for farmers with membership of farmer's association and farmers who are not members of farmer's association, respectively; K represents variables of household characteristics; β represents parameters to be estimated and μ is the error term. The structure of the ESR model gives room for an intersection of X in Equation ( 3) and K of Equations ( 4a) and (4b). However, it is important that at least one variable in X does not appear in K for the purpose of identification. Therefore, this suggests that the same set of variables are used to estimate selection and outcome equation but with additional one variable in the former. Awareness about membership of farmer's association is used as a valid instrument as it is expected to affect membership status and not the outcomes. As explained by Heckman (1979) [12] , the selectivity terms used in the selection equation which represent λ1 and λ2 for farmers with membership of farmer's association and farmers who are not members of farmer's association respectively, covariance terms σ12 and σ1ɛ are included in equation (4a) and (4b) which resulted to equation (5a) and (5b) below;
where the selectivity terms λ1 and λ2 correct for selection bias from unobservable factors and 𝜙 𝑖1 and 𝜙 𝑖2 are the error terms with conditional zero means. Maximum likelihood approach was used in this study as proposed by Lokshin and Sajaia (2004) [23] . The ESR model is used to examine the impact of membership of farmers' association on farm income of farming households by comparing the expected farm income of farming households who are members of farmer's association with the expected farm income of the counterfactual hypothetical cases that farmers who are not members of farmer's association did not have the income.
The expected values of the outcome Y (Farm income) membership and non-membership of farmer's association can be expressed as follows;
According to Lokshin and Sajaia (2004) [23] , average treatment effect on the treated (ATT) is a change in the outcome due to adoption. In this case, ATT is expressed in terms of membership status, which is expressed as follows in equation 7 as the difference in the expected outcomes from equations 6a and 6b.
where σ represents the covariance of the error terms and λ the inverse mills ratios or selectivity term.
Recursive Bivariate Probit (RBP) model
Awotide et al., (2013) [13] ; Kuntashula et al., (2014) [21] have used Heckman two-stage selection method to evaluate impact of a dichotomous variable on a dichotomous outcome. The method was used to account for observed and unobserved heterogeneity between adopters and nonadopters. However, Lokshin and Sajaia (2004) [23] argued that heteroskedastic residuals are generated by two-stage approach, which cannot be used to obtain consistent standard errors without cumbersome adjustments.
Therefore, this study employed RBP model to examine the impact of social network on poverty status of farming households in the study area. In order to overcome the shortcoming as used by (Amare et al., 2012) [2] , the model is expressed as follows;
where variable Sh* is the latent membership of farmer's association status of the farming household; Xh includes all factors influencing poverty status, such as household and farm level characteristics; Yh represents poverty status of the household; Kh is a vector of household and farm-level characteristics (e.g., age, education); Sh indicates farmers' membership of farmer's association; μh and εh are random error terms which are assumed to follow a bivariate distribution; θ and ϕ, and ω are parameters to be estimated. Following Marra and Radice (2011) [24] , the assumption that the error terms follow a bivariate distribution is expressed as follows;
where ρ represents correlation coefficient among unobserved explanatory variables in both equations.
For the purpose of identification as it is in ESR model, it is vital to make sure that the exclusion restriction on the exogenous variables hold, that is Xh and Kh must be different by the minimum of a variable (Maddala, 1983) [25] . The bivariate normal cumulative distribution function is specified in equation ( 11) and if ρ is significant, it indicates that correlation of disturbance terms exists.
The nonlinear conditional expectation expressed in equation ( 12) is meant to estimate the marginal effects, while the average treatment effect on the treated (ATT) is estimated using equation (13).
where YhA is the expected probability of membership of farmer's association, and is the expected probability of poverty head count outcome in the counterfactual case. LGAs proposed for the study, the required sample size was determined using Krejcie and Morgan (1970) [20] with the population proportionate factor stated as:
Methodology
Where S = required sample size, N = the population size, X 2 = the table value of chi-square for 1 degree of freedom at the desired confidence level (95%), normally (1.96 x 1.96 = 3.841). P = the population proportion (assumed to be 0.50), since this would provide the maximum sample size, d = the degree of accuracy expressed as a proportion (0.05). It is also possible to have 0.01 or 0.1 and others depending on the level of precision required.
In this case, the study used the estimated population size (N) equal to 31124 and assumed a population proportion (P) of 0.50, chi-square (X 2 ) for i degree of freedom at 95% confidence level, normally (1.96 x 1.96 = 3.841) and degree of accuracy (d) of 5%. This method of selecting sample size is based on probability assumption and as a result there is likelihood of selecting sample size that will be a good representative of the entire population in the study area. Therefore, the sample size as indicated above is 379. At the last stage, forty two (42) farmers were selected from each of the LGAs chosen except from Iwo where forty three (43) farmers were selected. This then gave a total of 379 respondents.
Method of data collection
This study used data obtained mainly from primary source. The source of the data involved the use of structured questionnaires used to elicit information from the respondents. All the questionnaires were given out accordingly and individual farming households were interviewed by trained field workers used as enumerators. This ensured higher response rates.
Method of data analysis Objective 1: Endogenous switching regression model or Treatment effects model
Objective 2: Recursive bivariate probit regression model
Results and Discussion
Results and Discussion
Determinants of social network (membership of farmers' association) and its impact on farm income
The joint estimation of selection and outcome equation (For social network and non-social network) in the model specifications was carried out according to the full information maximum likelihood procedure. The profit made from the sales of farm products was used to capture farm income in the analysis. The maximum likelihood estimates of endogenous switching regression model for farm income is presented in Table 1.
| — | — | — | Membership of association | — | Non-membership of association | — |
|---|---|---|---|---|---|---|
| Variables | Coefficient | t- value | Coefficient | t- value | Coefficient | t- value |
| Constant | -1.739471 | -1.39 | 13.62862 | 53.14 | 11.6865 | 7.25 |
| Age | 0.0233689 | 1.26 | -0.0091673 | -1.89* | 0.0230139 | 0.65 |
| Sex | 0.4161011 | 1.51 | 0.0937819 | 4.52*** | -0.6477413 | -1.44 |
| Years of education | 0.1520948 | 5.93*** | 0.0027892 | 0.23 | 0.1007421 | 1.82* |
| Land right | -0.0594617 | -0.17 | 0.1277617 | 1.80* | 0.9675908 | 1.39 |
| Marital status | 0.2839064 | 1.01 | -0.00028903 | -0.03 | 0.2781292 | 0.69 |
| Household size | 0.1073108 | 2.24** | 0.0076728 | 0.89 | 0.0245207 | 0.24 |
| Farm size | 0.1420587 | 3.39*** | 0.0294277 | 2.15** | 0.0242828 | 0.27 |
| Major occupation | 0.7632782 | 3.64*** | 0.060281 | 0.92 | 0.6659733 | 3.10*** |
| Farming experience | 0.0376909 | 1.91* | 0.0040956 | 1.12 | 0.1364175 | 3.57*** |
| Land management practice | 0.5828738 | 2.25** | -0.0532199 | -0.95 | -0.6767552 | 3.14*** |
| Contact with extension agents | -0.3573683 | -0.81 | 0.1232683 | 2.07** | 0.9435169 | 0.99 |
| Member of cooperative society | 0.1936927 | 1.93 | ||||
| Ins1 | 1.101859 | 8.18*** | ||||
| r1 | 0.967825 | 2.21** | ||||
| lns2 | 0.298964 | 6.10*** | ||||
| r2 | -0.70828 | -2.83** | ||||
| Log likelihood | 30.49 | |||||
| Likelihood ratio of independence: χ2(1) | 0.0000*** |
Table text extracted from the original PDF; superscript letters are shown inline. The original table image is below.
View original table image
The likelihood ratio test for joint independence of the equations in Endogenous Switching Regression (ESR) specification indicates that the equations are dependent, indicating that the models should not be estimated separately. Therefore, the use of ESR model, which accounts for both observable and unobservable factors, is suitable for this study as explained by (Lokshin and Sajaia, 2004) [23] . The estimated coefficient of the correlation term (ρ) in one of the regimes is statistically significant, showing that there is selection bias due to unobservable factors in membership of association status. The positive and significant sign for ρ implies that there is a positive selection bias. This suggests that farmers with above-average farm income have higher probability of been members of associations.
The empirical results in the selection equation presented in Table 1 are interpreted as normal probit coefficients. Years of education of the respondents, household size, farm size, major occupation, farming experience and land management practice use had positive and statistically significant relationship with membership of farmers' association. This implies that increase in years of education of the respondents tend to increase the probability of been a member of an association. The household size of the respondents tends to increase the probability of becoming members of an association. The farm size also has a way of influencing the decision of the farmers to become members of any association of their choice, this implies the higher the farm size, the higher the probability of becoming members. Farming as the major occupation of the respondents increases their chances of becoming a member of an association. This is because it is easier to get access to information when in a group than individual, hence the need to join an association. The higher the years of farming experience of the farmers, the higher the probability of becoming members of association. When a farmer uses any of the land management practices, he tends to become a member of an association where he can learn about new and improved methods of farming.
Results for the outcome equation under membership of farmer's association and non-membership of farmer's association columns in Table 1 reveal the impact of household characteristics on farm income of farmers in the two regimes. Age of the respondents had an inverse and significant influence on farm income under membership of farmer's association regime, indicating that the higher the age, the lower the farm income and vice versa. Sex on the other hand has a positive and significant influence on membership of association. This implies that being a male tends to increase the probability of joining and becoming a member of an association. This could be attributed to good knowledge of immense benefits inherent in being members of an association which has been gathered over the years.
The plausible reason for this scenario could be traced to less access to production resources such as land, credit and other productivity-enhancing inputs by women than men (Rahman, 2009) [33] . For the non-membership of association regime, years of education is statistically significant and it exhibited a positive relationship with farm income. It can be concluded upon that been so educated can have an advantage as the farmers can source for useful information that will aid his production through other means aside membership of association which can put financial strains on the members thereby affecting their incomes at the end of the day but it is not so for farmers who do not belong to any association because they don't have any financial obligation to any group which can be burdensome. The results on the relationship between land right and membership of association is also a positive one which means that the right of a farmer over land especially if it is inherited or purchased will give him the full opportunity to engage in associations that can boost his productivity on the land. Awareness through the extension agents about membership of associations by farmers tends to increase the likelihood of joining and been an active member of farm associations.
The results show that farm size and membership of association exhibited positive and significant relationship with farm income. The relationship between farm size and farm income of the farmers indicates that increase in the farm size would bring about increase in farm income. This is contrary to the submission of Heltberg (1998) [14] who reported that small farms produce more per unit of land than large farms and Fan (2003) [8] who explained that farmers with larger farm size were less productive per unit area than farmers with smaller farm size. A positive relationship existed between major occupation which is farming and non-membership of association establishing a positive farm income. This means that a farmer whose primary job is farming will give more attention to the farming activities and through constant practice will discover the methods best to bring about a high yield which will lead to an increased income, without necessarily joining any association. This is contrary to the findings of Hung et al., (2020) [42] which shows that membership of association has a statistic significance and positive impact on the income. In the case of non-membership of association regime, farming experience and land management practice had a positive and significant influence on farm income, indicating that they both increase farm income. Contact with extension agents has a positive relationship with membership of association which means farmers that has contact with extension agents will possibly join an association and hence bring about an increase in their farm income. Age on the other hand had negative and statistically significant relationship with membership of association. This means that the higher the age of a farmer, the less interested he is in becoming a member of any association and the lower the age of a farmer, the higher the chances of becoming a member of an association.
Farm income impacts
The result shows that farm income exhibited a statistically significant difference between membership of association and non-membership of association regime with former regime (13. 39) recording higher productivity than the latter (13.31). However, this may not be absolutely correct since some other confounding factors are not taken into consideration, but are considered using ATT estimates of the ESR specification. The profit made from the sales of farm products was used to capture farm income in the analysis.
Determinants of Social network and Its Impact on Poverty Status
The impact estimates as shown in Table 3 under poverty status column show that there is a negative relationship between social network (membership of farmers' association) and poverty status (Headcount index), indicating that social network among farming households is likely to reduce the probability of being poor. This means that being a member of farmers' association is very important when poverty status is being looked into. This is supported by Rashid and Patrick (2011) [34] when they emphasized that membership of social associations positively affects household income and reduces poverty. Household size exhibits positive and significant relationship with poverty status (Headcount index), which implies that increase in household size tends to increase the poverty status of farmers in Osun State. This could be associated to increased pressure on household resources especially food as household size increases, which may make such households to become poor. This is in line with the findings of Ibok et al., (2014) [17] which explained that large size households tend to be more food insecure than small size households. The use of land management practices is significant and exhibits a positive relationship with poverty status. This implies that the frequency of a farmer's engagement in the land management practices, the higher his poverty status. This may be due to the extra money needed to get some of the farming operations involved done which may affect his income, hence becoming poor. Also, contact with extension agents has a positive and significant relationship with poverty status, this means the more a farmer have contact with the extension agents, the higher his poverty status would be. This can be accounted for when we have extension agents who are not properly trained on field. However, age of the farmers and farming experience negatively and significantly influenced poverty status (Headcount index). This indicates that as a farmer ages, there tend s to be a drop in the poverty status. This is due to the fact that at the early stage of life there is always greater energy which would probably have helped the farmers at that time to increase output and income, but it drops as the age increases. The years of farming experience of the farmers as shown by the result has a negative impact on the poverty status. This may not be unconnected with the fact that experienced crop farmers are aware of some practices to put in place in order to realize optimum output which is able to boost their income. This is contrary to the findings in the study carried out by Oladimeji et al., (2013) [32] and Iruo et al., (2018) [19] who observed positive and significant relationship between fish farming experience and poverty. The marginal effect estimates of the RBP specifications are interpreted as elasticities, which give the magnitude of the response of poverty status (Headcount index) to any increase in each of the independent variables. For instance, the marginal effect of household size with positive and significant estimate shows that additional household member is more likely to increase poverty status by 5.5%. The negative and statistically significant marginal effect estimate of age suggests that an increase in age of the farmers is more likely to contribute to the household being poor by 1.2%. Also, the negative and significant marginal effect estimate of contact with extension agents reveals that an additional visit to the farmers is more likely to increase their poverty status by 28.3%.
| — | Selection | — | Poverty status | — | Marginal effect |
|---|---|---|---|---|---|
| Variables | coefficient | t- value | Coefficient | t- value | |
| Constant | -1.739 | -1.39 | 1.648 | 2.02 | |
| Social network | -0.688 | -6.70*** | -0.338 | ||
| Age | 0.023 | 1.26 | -0.035 | -2.23** | -0.012 |
| Sex | 0.416 | 1.51 | 0.187 | 0.84 | 0.065 |
| Years of education | 0.152 | 5.93*** | -0.035 | -0.93 | -0.012 |
| Land right | -0.059 | -0.17 | -0.309 | -1.45 | -0.107 |
| Marital status | 0.284 | 1.01 | -0.396 | -1.45 | -0.137 |
| Household size | 0.107 | 2.24** | 0.157 | 4.30*** | 0.055 |
| Farm size | 0.142 | 3.39*** | -0.035 | -0.74 | -0.012 |
| Major occupation | 0.763 | 3.64*** | -0.239 | -1.16 | -0.083 |
| Farming experience | 0.038 | 1.91* | -0.025 | -2.08** | -0.009 |
| Land management practice | 0.583 | 2.25** | 0.349 | 1.63* | 0.121 |
| Contact with extension agents | -0.357 | -0.81 | -0.817 | 2.46** | -0.283 |
| Member of cooperative society | 0.1936927 | 1.93 | |||
| Ρ | 0.6032351 | 2.11 | |||
| Log likelihood | -341.75576 |
Table text extracted from the original PDF; superscript letters are shown inline. The original table image is below.
View original table image
Conclusion
The empirical findings revealed that years of education, household size, farm size, farming as major occupation, farming experience and land management practice significantly influenced social network. A positive relationship existed between major occupation which is farming and non-membership of association establishing a positive farm income. Age of the respondents had an inverse and significant influence on farm income under membership of farmer's association regime. For the non-membership of association regime, years of education is statistically significant and it exhibited a positive relationship with farm income. Furthermore, social network (Membership of farmers' association) increased farm income and reduced poverty status of farming households in Osun State. Conclusively, social network is established to improve farm income while reducing poverty status. Therefore, establishment of more farmers' association should be encouraged so as to improve the economic status of the farmers.
Figures and tables from the paper
References
37 in the original paper- Amare M, Asfaw S, Shiferaw B. Welfare impacts of maize-pigeon pea intensification in Tanzania. Agric Econ. 2012;43(1):27-43. Doi:10.1111/j.1574-0862.2011.00563.x.
- Baah F. Harnessing farmers' associations as channels for enhanced management of cocoa holdings in Ghana. Sci Res Essays. 2008;3:395-400.
- Bachke ME. Are farmers' associations a good tool to improve small-scale farmers' welfare? Paper presented at the Nordic Conference in Development Economics; 2009 Jun 18-19;
- Bernard T, Taffesse A, Gabre-Madhin E. Impact of cooperatives on smallholders' commercialization behaviour: Evidence from Ethiopia. Agric Econ. 2008;39:147-161.
- Ekepu D, Tirivanhu N. Assessing farmer involvement in collective action for enhancing the sorghum value chain in Soroti, Uganda. S Afr J Agric Ext. 2017;45:118-130.
- Fan S, Chan-Kang C. Is small beautiful? Farm size, productivity and poverty in Asian agriculture. Invited plenary paper presented at the International Association of Agricultural Economists; 2003 Aug 16-22; Durban, South Africa.
- Fisher E, Qaim M. Linking smallholders to markets: determinants and impacts of farmer collective action in Kenya. World Dev. 2012;40:1255-1268.
- Granovetter M. The impact of social structure on economic outcomes. J Econ Perspect. 2005;19(1):3350.
- Haythornthwaite C. Social network analysis: an approach and technique for the study of information exchange. Libr Inf Sci Res. 1996;18:323-342.
- Heckman JJ. Sample selection bias as a specification error. Econometrica. 1979;47:153-161.
- Hellin J, Lundy M, Meijer M. Farmer association, collective action and market access in Meso-America. Food Policy. 2009;34:16-22.
- Heltberg R. Rural market imperfections and the farm size-productivity relationship: Evidence from Pakistan. World Dev. 1998;26(10):1807-1826.
- Ho QH. The role of socio-professional associations for economic development after 30 years of change. Dev Econ J. 2014;208:2-8. (In Vietnamese)
- Vu HV, Ho H, Hoi LQ. Impact of farmers' associations on household income: Evidence from tea farms in Vietnam. Economies. 2020;8(4):1-16.
- Ibok OW, et al. Food security determinants among urban food crop farming households in Cross River State, Nigeria. Asian J Agric Ext Econ Soc. 2014;3(1):76-90. DOI:10.9734/AJAEES/2014/6560.
- Idowu J, Oladeji O. Agriculture cooperative associations, livelihood income and rural households welfare in Osun State, Nigeria. Greener J Agric Sci. 2019;9:180-188.
- Iruo FA, Onyeneke RU, Eze CC, Uwadoka C, Igberi CO. Economics of smallholder fish farming to poverty alleviation in the Niger Delta region of Nigeria. Turk J Fish Aquat Sci. 2018;19:313-29. DOI:10.4194/13032712-v19_4_06.
- Krejcie RV, Morgan DW. Determining sample size for research activities. Educ Psychol Meas. 1970;30(3):607-10.
- Kuntashula E, Chabala LM, Mulenga BP. Impact of minimum tillage and crop rotation as climate change adaptation strategies on farmer welfare in smallholder farming systems of Zambia. J Sustainable Dev. 2014;7(4):95-110. DOI:10.5539/jsd.v7n4p95.
- Lokshin M, Sajaia Z. Maximum likelihood estimation of endogenous switching regression models. Stata J. 2004;4(3):282-289.
- Marra G, Radice R. Estimation of a semiparametric recursive bivariate probit model in the presence of endogeneity. Can J Stat. 2011;39:259-279. DOI:10.1002/cjs.10100.
- Matuschke I. Evaluating the impact of social networks in rural innovation systems: An overview. IFPRI Discussion Paper; 2008;00816. Washington, DC: International Food Policy Research Institute.
- Mohamed PN, Mansaray DA. Evaluating the effectiveness of farmers' associations in facilitating clientele involvement in agriculture development programmes in Port Loko district, Northern Sierra Leone. Int J Adv Biol Res. 2016;6:92-105.
- Muchopa. Evaluating performance by cooperative value and efficiency. Niger J Cooperative Stud. 2011;2:39-54.
- Mwaura F. Effect of farmer group membership on agricultural technology adoption and crop productivity in Uganda. Afr Crop Sci J. 2014;22:917-927.
- Mpiira S, Kiiza B, Katungi E, Staver C, Tabuti J, Kyotalimye M, et al. Factors influencing households' participation in the Savings and Credit Cooperative (SACCO) programmes in Uganda. Afr J Agric Res. 2013;8:5280-5288.
- Nkala P, Mango N, Zikhali P. Conservation agriculture and livelihoods of smallholder farmers in Central Mozambique. J Sustainable Agric. 2011;35:757-779.
- Oladimeji YU, Abdulsalam Z, Damisa MA, Omokorem DF. Estimating the determinants of poverty among artisanal fishing households in Edu and Moro Local Government Areas of Kwara State, Nigeria. Agric Biol J N Am. 2013;4:422-429. DOI:10.5251/abjna.2013.4.4.422.429.
- Rahman SA. Gender issues in food security. Paper presented at the first biennial conference on human security in Africa; 2009 Mar 5-8; Center for Security, Olusegun Obasanjo Presidential Library, Abeokuta, Ogun State, Nigeria.
- Rashid Hassan & Birungi P. Social capital and poverty in Uganda. Dev Southern Afr. 2011;28(1):19-37. DOI:10.1080/0376835X.2011.545168.
- Sheilla JT, Tanui JK, Muller AJ, Mutsotso BM, Mowo GJ. The influence of associational arrangements on effectiveness of collective action: findings from a study of farmer groups in the East African Highlands. J Agric Ext Rural Dev. 2015;1:151-165.
- Simonovic Z. Cooperatives and farmers association as a model of entrepreneurship in Serbian agriculture regarding the case of Nisava district. Econ Agric. 2016;2:699-712.
- Tolno E, Kobayashi H, Matsumura I, Esham M, Balde BS, Lanka S. Economic analysis of the role of farmer International Journal of Agriculture and Food Science https://www.agriculturaljournals.com associations in enhancing smallholder potato farmers' income in Middle Guinea. J Agric Sci. 2015;7:3.
- Valente TW. Social network thresholds in the diffusion of innovations. Soc Networks. 1996;18(1):60-69.
- Vu VH, Ho H, Hoi LQ. Impact of farmer education on production efficiency: the case of rice farms in Vietnam. Manag Sci Lett. 2019;9:1909-1918.
- Hang NT, Hijikata M, Maeda S, Thuong PH, Ohashi J, Van Huan H, et al. Whole genome sequencing, analyses of drug resistance-conferring mutations, and correlation with transmission of Mycobacterium tuberculosis carrying katG-S315T in Hanoi, Vietnam. Scientific reports. 2019 Oct 25;9(1):15354.
- Hung IF, Lung KC, Tso EY, Liu R, Chung TW, Chu MY, et al. Triple combination of interferon beta-1b, lopinavir-ritonavir, and ribavirin in the treatment of patients admitted to hospital with COVID-19: An openlabel, randomised, phase 2 trial. The Lancet. 2020 May 30;395(10238):1695-1704.
Social network and poverty status impacts
Table 4 describes the impact of social network and poverty status from the ATT estimates of the ESR and RBP specifications. To examine the impact of social network on poverty status (headcount index), the average treatments effects (ATT) on the expected outcomes are estimated. ATT estimates account for other confounding factors which include selection bias resulting from potential differences between members of farmers' association and non-members of farmers' association. The results indicate that membership significantly reduces poverty headcount index. Specifically, members of farmers' association are 282 compared to 97 who are non-members of farmers' association. However, there is a negative impact of social network on poverty status headcount from RBP estimates. The implication is that there is increase in the probability of reducing poverty status from 86% from non-members to 48% from members of farmers' association.
Table text extracted from the original PDF; superscript letters are shown inline. The original table image is below.
View original table image