
Research article · 2024 · Full text
International Journal of Veterinary Sciences and Animal HusbandryTemporal trends and future projections of animal biting incidents: A comprehensive study from 2018 to 2023
Volume 9(5S) · Pages 98–102 · DOI: 10.22271/veterinary.2024.v9.i5sb.1685 ↗
Research areasRabies epidemiology and controlVenomous Animal Envenomation and StudiesPoxvirus research and outbreaks
Abstract
Author-writtenBackground: In India, high mortality and morbidity rates of human rabies is observed. Hence, a structured surveillance system is yet to be put in place for public health discussion.Objective: The primary objective of this research study is to develop an accurate and reliable forecasting model for predicting the number of animal bites at the Territory Care Hospital located in Agartala, Tripura i.e., Agartala Government Medical College (AGMC) over the period June 2023 to May 2025. This endeavour aims to facilitate healthcare planning, resource allocation, and effective response to animal-related incidents, ultimately enhancing public health and safety in the region.Methods and Materials: In this research, primary data have been collected from the Anti Rabies Vaccination (ARV) clinic of Agartala Government Medical College (AGMC), Agartala, Tripura West spanning April 2018 to May 2023 underwent rigorous cleaning, eliminating inconsistencies, duplicates, and outliers. The data was structured chronologically and organized by various regions in Tripura. For forecasting animal bites, a SARIMA (Seasonal Autoregressive Integrated Moving Average) model was meticulously tuned for optimal performance, considering parameters such as differencing order, autoregressive and moving average terms, and seasonal components. Model validation encompassed techniques like cross-validation, out-of-sample testing, and diagnostic checks. This holistic approach aims to provide a robust forecasting tool for predicting animal bites in different places of Tripura state over the period June 2023 to May 2025, thereby aiding healthcare planning and proactive measures to mitigate animal bite incidents in the region.Results: This research paper employs time series analysis techniques to forecast animal bite incidents over the course of 24 months, spanning the period June 2023 to May 2025. The study establishes the stationarity of the time series data through the Augmented Dickey-Fuller (ADF) and Kwiatkowski-Phillips-Schmidt-Shin (KPSS) tests, while confirming that residuals are normally distributed and independent. Utilizing the ARIMA function, the paper presents a robust forecasting model. The findings hold significance for animal control and public health, offering insights into expected trends and assisting in safety planning.
Summary
Source-checkedPlain-language reading of the full paper, prepared with AI and checked against the text. Each point links to the authors' own words.
Why it matters
- India experiences high rates of morbidity and mortality from human rabies, but lacks a structured surveillance system for public health management. View evidence ↗
- The Indian government is working toward the World Health Organization's goal of eliminating human deaths from dog-mediated rabies by 2030. View evidence ↗
- A key driver of the rabies crisis in India is the lack of public awareness regarding preventive measures and post-exposure prophylaxis. View evidence ↗
The question
- The study aims to create a reliable forecasting model to predict animal bite incidents at the Agartala Government Medical College (AGMC) from June 2023 to May 2025. View evidence ↗
What they did
- The researchers used primary data from the Anti Rabies Vaccination clinic at AGMC in Tripura, covering the period from April 2018 to May 2023. View evidence ↗
- A Seasonal Autoregressive Integrated Moving Average (SARIMA) model was employed and tuned to forecast the animal bite incidents. View evidence ↗
- The researchers used Augmented Dickey-Fuller (ADF) and Kwiatkowski-Phillips-Schmidt-Shin (KPSS) tests, both with P-values of 0.1, to confirm the data was stationary. View evidence ↗
What they found
- Between April 2018 and May 2023, a total of 4,246 animal bite cases were reported at AGMC and GBP Hospital in Agartala. View evidence ↗
- The data revealed a seasonal trend where animal bite cases peak during the winter and are at their lowest during the summer. View evidence ↗
- Monthly animal bite counts ranged from a minimum of 17 to a maximum of 125, with a median of 62.00. View evidence ↗
- The model's Mean Absolute Percentage Error (MAPE) was 9.22%, which the authors consider a reasonable level of accuracy. View evidence ↗
- The forecast predicts that the highest number of bites will occur in January, February, and March of 2024 and 2025, while the lowest will occur in June and July of 2023, 2024, and 2025. View evidence ↗
What it means
- The authors conclude that the forecasting model can be used to guide proactive planning and the allocation of resources for managing animal bite cases at the hospital. View evidence ↗
- The authors state that SARIMA modeling empowers decision-makers to tailor interventions to high-risk seasons and areas and allocate resources more efficiently. View evidence ↗
Visual summary
1 visualsIllustrations explain the paper; they do not show study data.

Seasonal Cycle of Animal Bites
AI-generated conceptual illustration (domestic dogs and cats). It explains the idea and does not show study data.
View source evidence ↗Figures & tables
From the original paper Table 1
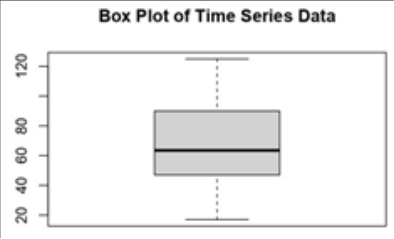 Figure 1
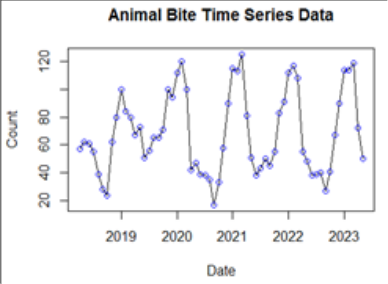 Figure 2
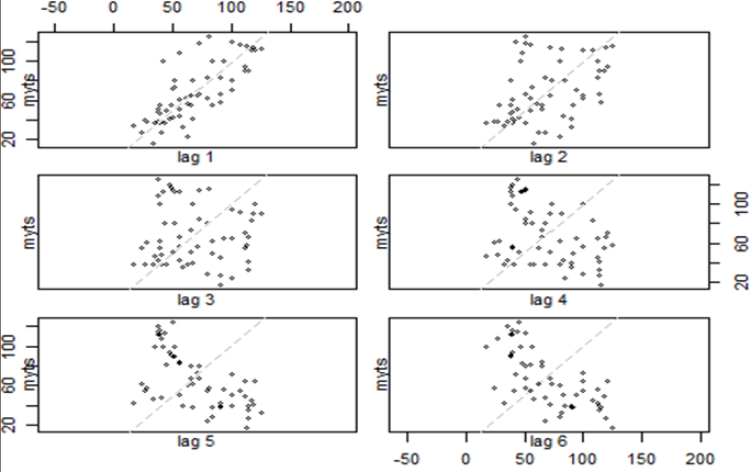 Figure 3
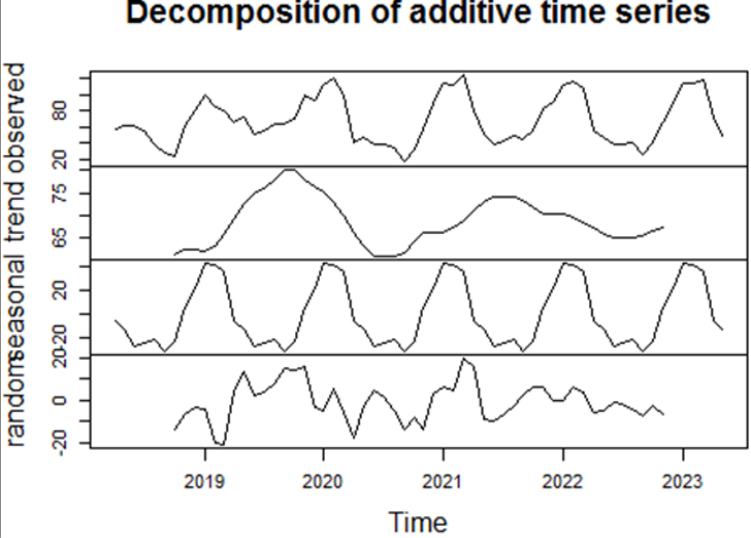 Figure 4
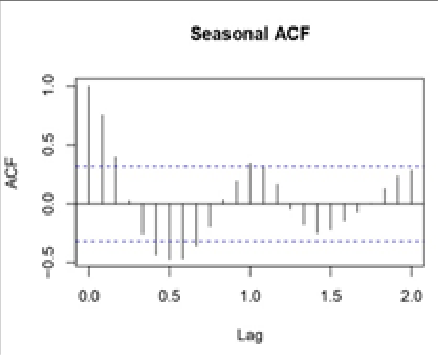 Figure 5
 Table 2
 Table 3
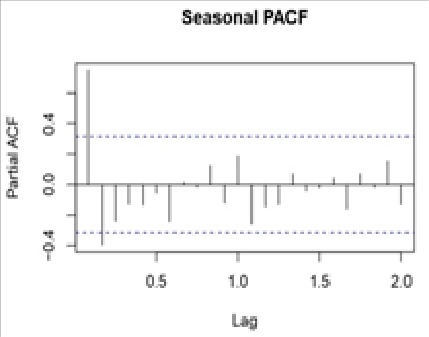 Figure 6
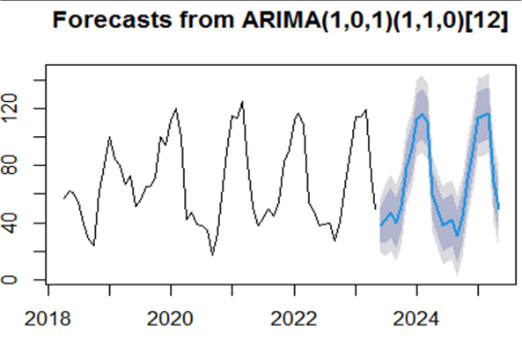 Figure 7
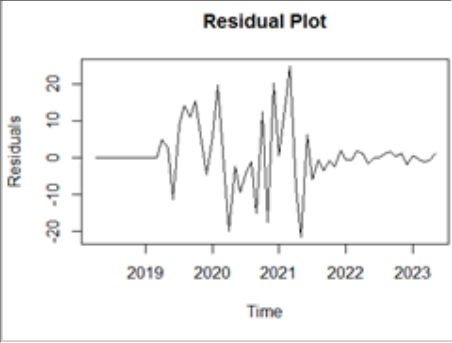 Figure 8
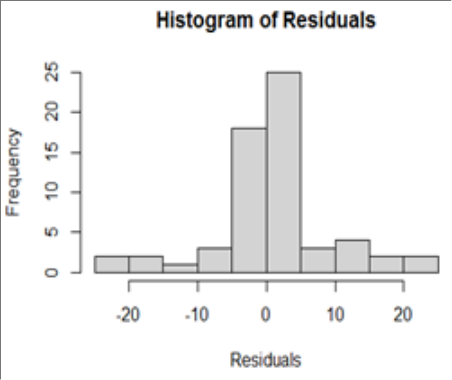 Figure 9
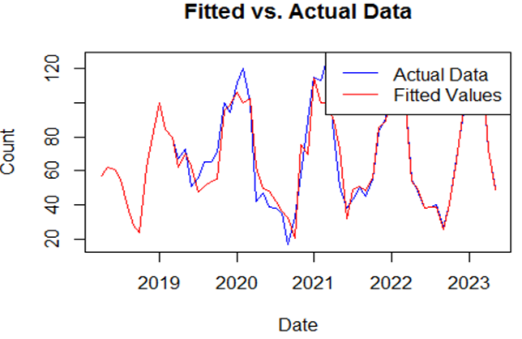 Figure 10
Introduction
Dog bites globally result in tens of millions of injuries annually, with an estimated 4.5 million cases reported in the United States alone, leading to nearly 885,000 seeking medical care, 30,000 undergoing reconstructive procedures, and 10 to 20 fatalities. Comparable incidence and fatality rates are observed in other high-income countries like Australia, Canada, and France etc. [1] . This ongoing health crisis in India can be attributed to several interconnected factors. A fundamental issue is the lack of awareness regarding preventive p -measures against rabies, including post-exposure prophylaxis [2] . The Government of India's commitment to the National Rabies Control Programme aligns with the World Health Organization's (WHO) goal of eliminating human deaths from dog-mediated rabies worldwide by 2030. It recognizes that timely and appropriate interventions, coupled with high levels of awareness and vaccination coverage, are essential to achieving this ambitious target [3] . The application of Seasonal Autoregressive Integrated Moving Average (SARIMA) modelling to forecast animal bite incidents over the period June 2023 to May 2025 can be a valuable tool in fulfilling the target of rabies control and prevention set by the Government of India, as well as aligning with the World Health Organization's (WHO) goal of eliminating human deaths from animal mediated rabies by 2030 [4] .
Here's how SARIMA can adequately contribute to achieving this target:
• Data-Driven Decision-Making: SARIMA models rely on historical data patterns and seasonality to make forecasts. By analyzing past animal bite incidents, the model can identify trends and seasonal variations. This information is crucial for decision-makers, allowing them to allocate resources and plan interventions strategically.
Results
During last six years i.e. from April 2018 to May 2023 we have seen that there was total of 4246 cases reported in the Agartala Government Medical College (AGMC) and GBP Hospital, Agartala. A significant trend has been found from the data as, maximum bite cases are in the winter season and minimum in the summer (shown in Fig2). The summary of data is as follows: The dataset in Table-1 appears to have a wide range of animal bite counts, with a minimum of 17 and a maximum of 125. The majority of the observations (50%) fall around the median value of 62.00, suggesting that the typical number of animal bites during this period is around 62. Whereas, the interquartile range (IQR), which is the difference between the 1 st quartile (Q 1 ) and the 3 rd quartile (Q 3 ), is fairly wide, indicating variability in the data distribution. The variance of the data set is 867.0407 suggests that there is moderate variability in the number of animal bites recorded during the specified period at Agartala Government Medical College. It's not extremely tightly clustered around the mean, but it's also not extremely spread out as variability do exist in real world data. Box plot (fig1) shows that there is no data outliers 8 . So, no need to take any other measures for removing outliers. And hence, in next we can proceed to the analysis i.e. forecasting. From the above figure-3 we observed that, lag 1 shows that, the previous data are more correlated with the current value where as lag 4, shows that worst cases i.e. less correlation between previous and current data. The animal bite time series data graph i.e., decomposition graph was used for future analysis (fig4). Firstly the series chart for observed data is shown in the figure. (SARIMA (p, d, q), (P, D, Q)) [10] . Accuracy matrices of the model involved are shown below:- S.E = 0.1957 S.E = 0.0886 AR1 (0.4842) Indicates a tendency for the current month's value to follow the trend of the previous month. An increase in the previous month's value shows an increase in the current month's value. MA1 Coefficient (0.4036) implies that the current month's value is influenced by past forecast errors. An increase in past forecast errors is associated with an increase in the current month's value. SAR1 (-0.7276) reflects a seasonal effect. A higher value in the same month of the previous year is associated with a decrease in the current month's value. Lesser values of standard error ensure less uncertainty of coefficient estimates and better estimates of the coefficients. Here forecast graph i.e., Fig7 shows that, maximum bites will occur in January, February, March of 2024 as well as 2025 and lowest number of bites will occur in June, July 2023, 2024 and in 2025 [9] . Residual plot shows that there is no particular pattern in the model error and considering this as only randomness. This is a sign of no autocorrelation among the residuals. Histogram of the residuals shows that residual of the model tends to follow approximately normal distribution which also ensures randomness of the residual data and no particular pattern followed. Here Fig10 show that lesser variation between two lines graph which ensures the goodness of fit of the model and more accurate results in terms of ARIMA modelling.
Conclusion
The analysis of animal bite cases at Agartala Government Medical College (AGMC) & GBP Hospital, Agartala, over the past six years reveals a seasonal trend, with peak occurrences in winter and minimal cases in summer. The ARIMA time series model, with identified parameters, provides a reasonable fit for forecasting. The forecast predicts higher cases in January, February, and March of 2024 and 2025, with lower numbers in June and July. Model evaluation matrices and residual analysis support the model's accuracy and randomness capture. This information can guide proactive planning and resource allocation for handling animal bite cases at the hospital.
Figures and tables from the paper
| AR1 | MA1 | SAR1 |
|---|---|---|
| 0.4842 | 0.4036 | -0.7276 |
| S.E = 0.1704 | S.E = 0.1957 | S.E = 0.0886 |
Table text extracted from the original PDF; superscript letters are shown inline. The original table image is below.
View original table image
References
10 in the original paper- World Health Organization. Animal bites. Geneva: World Health Organization; c2018. [Online] Available from: http://www.who.int/newsroom/factsheets/detail/animal-bites [Accessed June 4, 2020].
- Kole AM, Roy R, Koleb DC. Human rabies in India: a problem needing more attention. Bull World Health Organ. 2014 Apr;92(4):230. DOI: 10.2471/BLT.14.136044.
- National Action Plan for Dog Mediated Rabies Elimination from India by 2030. [Online] Available from: https://ncdc.mohfw.gov.in/WriteReadData/linkimages/Na tionalActiopPlan.pdf.
- Ebhuoma O, Gebreslasie M, Magubane L. A seasonal autoregressive integrated moving average (SARIMA) forecasting model to predict monthly malaria cases in KwaZulu-Natal, South Africa. S Afr Med J. 2018 Jun 26;108(7):573-578. DOI: 10.7196/SAMJ.2018.v108i7.12885.
- Noor TH, et al. SARIMA: A seasonal autoregressive integrated moving average model for crime analysis in Saudi Arabia. Electronics. 2022;1(23):3986. https://doi.org/10.3390/electronics1123398.
- Fatemeh R, Sima M. Time series modelling of animal bites. J Acute Dis. 2023;12(3):121-128.
- Renu B, Narendra V, Gautam K, Agiwal V. Forecasting the anti-rabies vaccine demand at Jawaharlal Medical College and Hospital, Ajmer, Rajasthan: A comparative analysis based on time series model. [Online] Available from: https://doi.org/10.47203/IJCH.2021.v33i03.008.
- Tenaja N, et al. Seasonal variation and time trend analysis of dog bite cases attending the anti-rabies clinic in Delhi using ARIMA model forecasting. J Clin Diagn Res. 2021 Aug, 15(8).
- Grover S, Gupta A, Dua AS. Time series analysis of animal bite cases attending anti-rabies clinic. J Family Med Prim Care. 2022;11:7024-7028.
- Paso A, Ngamjarus C. Forecasting rabies in Thailand: time series analysis. Naresuan University J Sci Technol. 2020, 28(4).
Cited by 1
From OpenAlex, OpenCitations and reference lists read by Scinovex
- Forecasting Dog Bite Incidents: An Autoregressive Integrated Moving Average Time Series Analysis ↗
Dinesh Asokan, Joyce Bardeskar, Minal Borode, Anjali Mall, Geeta Shrikar Pardeshi · Preventive Medicine Research & Reviews · 2025
Abstract Introduction: This study, driven by the high incidence of dog bites in India and the fatality risk of rabies, utilised Autoregressive Integrated Moving Average (ARIMA) analysis to forecast dog bite trends in a metropolitan tertiary care hospital. Materials and Methods: A record-based study with data from January 2019 to October 2023 at a Mumbai tertiary care institution employed the…
❝ 1PDF