
Research article · 2024 · Full text
International Journal of Agriculture Extension and Social DevelopmentStudy on bio-physical profile of water user associations in mula command area
Volume 7(9) · Pages 172–175 · DOI: 10.33545/26180723.2024.v7.i9c.1051 ↗
Research areasPhysical Activity and Education ResearchBacterial biofilms and quorum sensingChemical and Physical Studies
Abstract
Author-writtenIrrigation sector is the main consumer of available surface fresh water and more than 90.00% of total ground water draft in India. Indian government is proactively promoting user participation for effective and efficient management of irrigation water and systems. In this context this study examines the bio-physical profile of Water User Associations in Mula command area in context of their origin, structural & functional context. The present study was conducted under Mula irrigation command area with sample size of six Water User Associations (WUA’s). Ex-post facto research design was used for the study. It was found that highest operational cost, irrigation fee collected, irrigation fee assessed and actual irrigated area in head reach. Highest maintenance cost, cultivable command area, total irrigable area, initial irrigated area and net irrigated area was observed in middle reach. Highest water entitlement and volume of water received was observed tail reach.
Summary
Source-checkedPlain-language reading of the full paper, prepared with AI and checked against the text. Each point links to the authors' own words.
Why it matters
- The irrigation sector in India is the primary consumer of surface fresh water and accounts for over 90% of total groundwater extraction. View evidence ↗
- Water security is a critical issue for India, as the country supports 17% of the global population with only 4% of the world's water resources and 2.4% of its land. View evidence ↗
- Farmer participation through Water User Associations (WUAs) is essential for the effective management, maintenance, and fee collection of irrigation systems. View evidence ↗
The question
- The study aimed to examine the bio-physical profile of Water User Associations in the Mula command area, specifically regarding their origin, structure, and function. View evidence ↗
What they did
- The researchers employed an ex-post facto research design for this study. View evidence ↗
What they found
- The head reach had the highest operational area at 9.5 km, compared to 6.18 km in the middle reach and 3 km in the tail reach. View evidence ↗
- The middle reach exhibited the largest cultivable command area (896 ha), followed by the head reach (743.89 ha) and tail reach (455 ha). View evidence ↗
- Water entitlement was highest in the tail reach (957 m³), followed by the middle reach (762.75 m³) and head reach (647.31 m³). View evidence ↗
- The head reach had the highest actual irrigated area (665.5 ha), while the tail reach had 592.5 ha and the middle reach had 519.66 ha. View evidence ↗
- Maintenance costs were highest in the middle reach (Rs. 66,843), followed by the head reach (Rs. 60,676) and tail reach (Rs. 58,000). View evidence ↗
- All studied associations used area-based water fee assessment, which the authors identify as an ineffective method because it ignores the diverse water requirements of different cropping patterns. View evidence ↗
- Out of 2,632 total general body members, the middle reach had the most members (1,197), followed by the head reach (722) and tail reach (713). View evidence ↗
What it means
- The authors conclude that the head reach generally had the highest actual irrigated area, with the Yashwant WUA specifically showing the highest actual irrigated area among all associations. View evidence ↗
- The authors suggest that the study serves as a foundation for future researchers to understand terminologies and assess WUA performance in various contexts. View evidence ↗
Visual summary
3 visualsIllustrations explain the paper; charts are replotted from the paper's own table values.
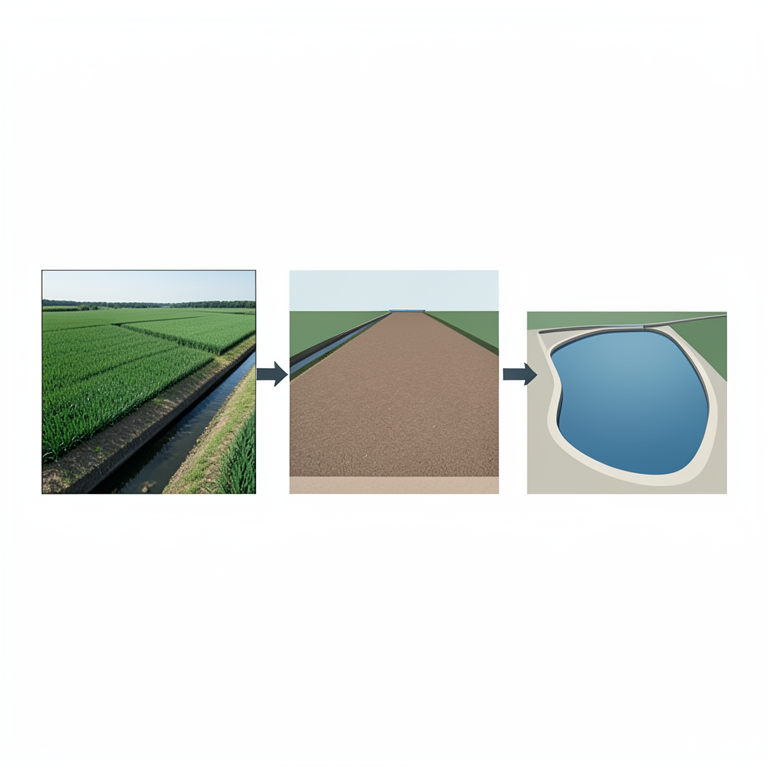
Comparison of Reach Profiles
AI-generated conceptual illustration (Irrigation canal system with agricultural fields). It explains the idea and does not show study data.
View source evidence ↗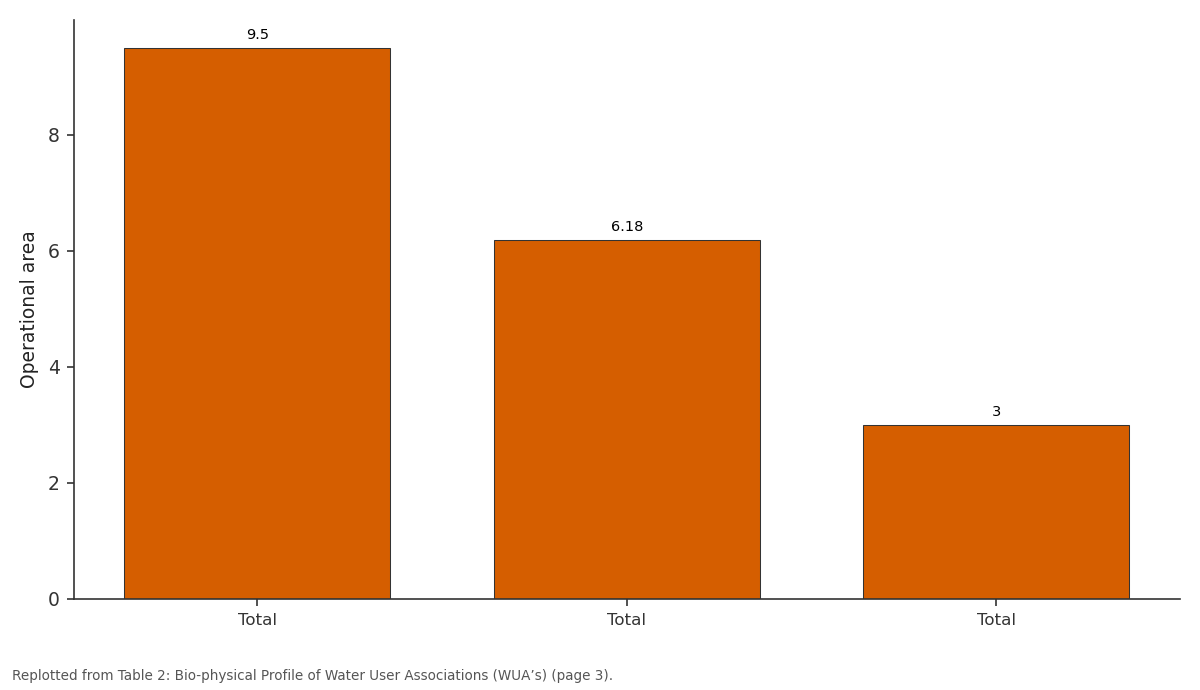
Operational area: Total vs Total vs Total
Replotted from Table 2 (page 3) of the original paper. Every bar is the paper's own table value.
View source evidence ↗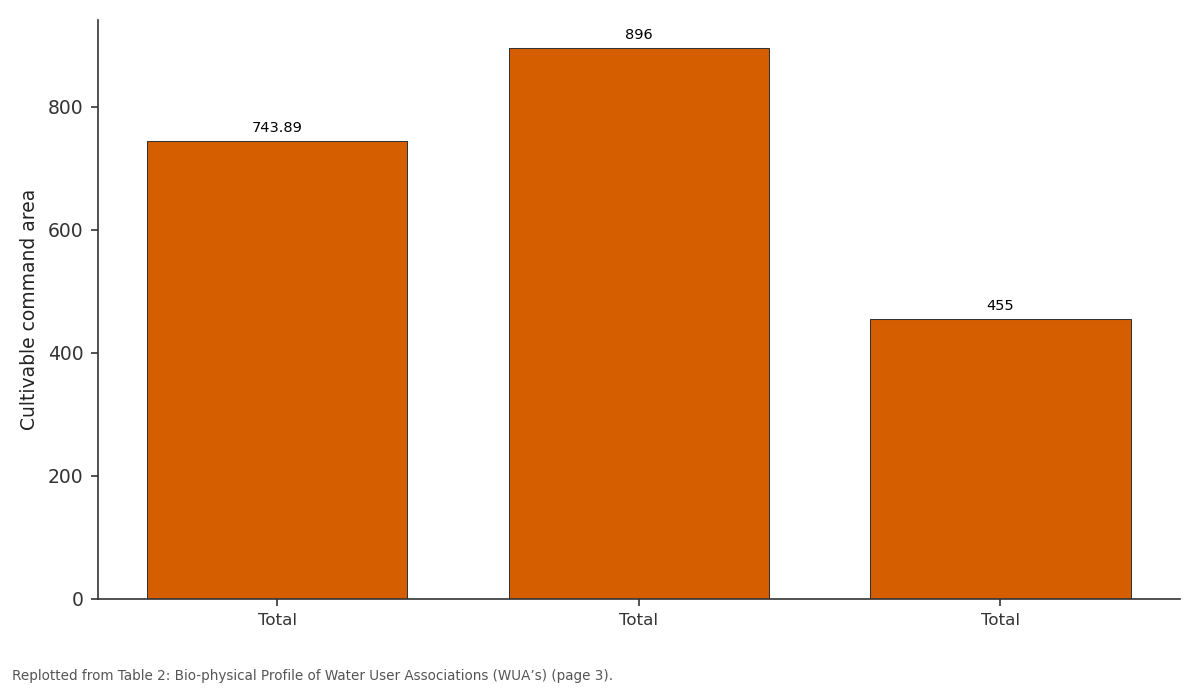
Cultivable command area: Total vs Total vs Total
Replotted from Table 2 (page 3) of the original paper. Every bar is the paper's own table value.
View source evidence ↗Figures & tables
From the original paper Table 1
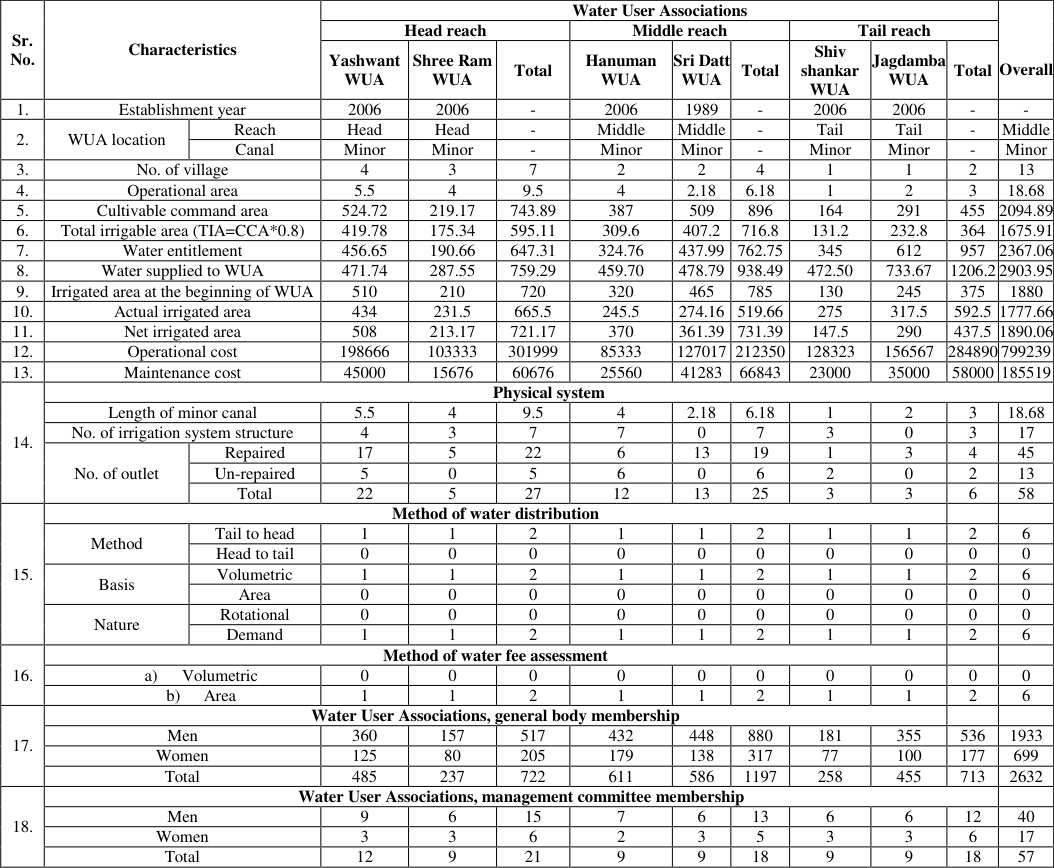 Table 2
Introduction
The water availability of a region or nation is majorly depending on the availability of annual precipitation which is influenced by the regional hydro-meteorological and geological factors and to ensure water access and water security through the development of water infrastructure. Irrigation sector is the main consumer of available surface fresh water and more than 90.00% of total ground water draft in India. Indian government is proactively promoting user participation for effective and efficient management of irrigation water and systems. It is crucial to efficient use of available water resources for a country like India, given that India has 17% of the world's population but has only 2.4% of the land and 4% of the water resources. Moreover, the per capita availability of usable water resources, which was 5247 m³ in 1951 and it is now 1453 m³, is projected to decrease to 1170 m³ by 2050 (CWC, 2015) [2] . Agricultural sector alone consumes 80% of the ground water (Harsha, 2017) [3] . The declining trend of groundwater level in all parts of the country also indicates that the assured supply of good quality water will become a concern for country's development (Manivannan et al., 2017) [6] . The overall efficiency of the flood irrigation system range between 25-40% (Amarasinghe, 2007) [1] . In order to meet the food security, income, and nutritional requirements of the anticipated population in 2050, India will need to nearly double its food production. Enhancing the groundwater table can be achieved through implementing various artificial conservation methods and boosting crop productivity (Paul and Panigarhi, 2016) [7] . A most important factor in the effective use of water resources is the participation of farmers in the management of the operation, maintenance and collection of water charges from the areas under the control of Water User Associations (Water User Associations). A WUA is a group of farmers who live near a lateral canal and create their own non -profit cooperative organization with a set of regulations to control water delivery in their region (Lohmar et al., 2003) [5] . This study focused to know the bio-physical profile of Water User Associations in context of their origin, structural & functional context.
Material Methods
Research design is the plan, structure, and strategy of investigation conceived so as to obtain answers to research questions and to control variance (Kerlinger, pp. 300) [4] . The research design followed in the present study was expost-facto research design. Ex post facto research is systematic empirical inquiry in which the researcher does not have direct control over independent variables because their manifestations have already occurred or because they are inherently not manipulable The study was conducted of Water User Associations in Mula command area by using an ex-post facto research design to know the bio-physical profile of Water User Associations. In Mula command area, the location of Water User Associations head, middle and tail reach selected through purposive sampling. Two Water User Associations www.extensionjournal.com selected from each head, middle and tail reach through stratified random sampling. To know the bio-physical profile of Water User Associations, a pre-tested structured schedule was used to gather data on bio-physical profile. The following table 1 shows the details. Operational area: It was observed that overall operational area was 18.68 km. in the study area. Highest operational area (9.5 km.) was observed in head reach followed by middle reach (6.18 km.) and tail reach (3 km.). Among the Water User Associations highest operational area was observed in Yashwant WUA (5.5 km.) followed by Shree Ram (4 km.), Hanuman (4 km.), Sri Datt (2.18 km.), Jagdamba (2 km.) and Shivshankar WUA (1 km.).
| Location | Sr. No. | Name of Water User Associations | Area |
|---|---|---|---|
| Head reach | 1. | Yashwant Water User Association | 432 Ha |
| 2. | Shree Ram Water User Association | 384 Ha | |
| Middle reach | 3. | Hanuman Water User Association | 509 Ha |
| 4. | Sri Datt Water User Association | 286.69 Ha | |
| Tail reach | 5. | Shivshankar Water User Association | 164 Ha |
| 6. | Jagdamba Water User Association | 291 Ha |
Table text extracted from the original PDF; superscript letters are shown inline. The original table image is below.
View original table image
Cultivable command area:
It was observed that overall cultivable command area was 2094.89 ha. in the study area. Highest cultivable command area was observed in middle reach (896 ha.) followed by head reach (743.89 ha.) and tail reach (455 ha.). Among the Water User Associations highest cultivable command area was observed in Yashwant WUA (524.72 ha.) followed by Sri Datt WUA (509 ha.), Hanuman WUA (387 ha.), Jagdamba WUA (291 ha.), Shree Ram WUA (219.17 ha.) and Shivshankar WUA (164 ha.).
Initial irrigated area:
It was observed that overall initial irrigated area was 1880 ha. in the study area. Highest initial irrigated area was observed in middle reach (785 ha.) followed by head reach (720 ha.) and tail reach (375 ha.). Among the Water User Associations highest initial irrigated area was observed in Yashwant WUA (510 ha.) followed by Sri Datt WUA (465 ha.), Hanuman WUA (320 ha.), Jagdamba WUA (245 ha.), Shree Ram WUA (210 ha.) and Shivshankar WUA (130 ha.).
Actual irrigated area: It was observed that overall actual irrigated area was 1777.66 ha. in the study area. Highest actual irrigated area was observed in head reach (665.5 ha.) followed by tail reach (592.5 ha.) and middle reach (519.66 ha.). Among the Water User Associations highest actual irrigated area was observed in Yashwant WUA (434 ha.) followed by Jagdamba WUA (317.5 ha.), Shivshankar WUA (275 ha.), Sri Datt WUA (274.16 ha.), Shree Ram WUA (245.5 ha.) and Hanuman WUA (231.5 ha.).
Net irrigated area: It was observed that overall net irrigated area was 1890.06 ha. in the study area. Highest net irrigated area was observed in middle reach (731.99 ha.) followed by head reach (721.17 ha.) and tail reach (437.5 ha.). Among the Water User Associations under study area, highest net irrigated area was observed in Yashwant WUA (508 ha.) followed by Hanuman WUA (370 ha.), Sri Datt WUA (361.39 ha.), Jagdamba WUA (290 ha.), Shree Ram WUA (213.17 ha.) and Shivshankar WUA (147.5 ha.). Length of canal: It was observed that overall length of minor canal was 18.68 km. in the study area. Highest length of minor canal (9.5 km.) was observed in head reach followed by middle reach (6.18 km.) and tail reach (3 km.). Among the Water User Associations highest length of minor canal was observed in Yashwant WUA (5.5 km.) followed by Shree Ram (4 km.), Hanuman (4 km.), Sri Datt (2.18 km.), Jagdamba (2 km.) and Shivshankar WUA (1 km.).
Operational cost:
Operational cost:
Number of irrigation system structure:
It was observed that overall number of irrigation system structure was 17 in the study area. Highest number of irrigation system structure (7) was observed in head reach followed by middle reach (7) and tail reach (3). Among the Water User Associations highest number of irrigation system structure was observed in Hanuman WUA (7) followed by Yashwant (4), Shree Ram (3) and Shivshankar WUA (3).
Method of water distribution
Method of water distribution
Method of water fee assessment
Method of water fee assessment
Water User Associations, general body membership
Water User Associations, general body membership
Number of outlets
It was observed that overall total number of outlets was 58 in the study area. Highest number of outlets (27) was observed in head reach followed by middle reach (25) and tail reach (6). Among the Water User Associations highest number of outlets was observed in Yashwant (22) followed by Sri Datt (13), Hanuman (12), Shree Ram (5), Jagdamba
Number of un-repaired outlets:
It was observed that overall total number of un-repaired outlets was 13 in the study area. Highest number of un-repaired outlets (6) was observed in head reach followed by middle reach (5) and tail reach (2). Among the Water User Associations highest number of outlets was observed in Hanuman ( 6) followed by Yashwant (5), and Shivshankar WUA (2).
Method of water distribution:
The method of water distribution was common in all Water User Associations. They were following method of water distribution tail to head, nature of water distribution rotational and area basis distribution of water. Method of fee assessment was on area basis also common in all Water User Associations.
Method of water fee assessment:
The method of water fee assessment from members of Water User Associations also used similar method for assessment. In all the Water User Associations water fee assessment was based on area.
Future Scope
The study can help future researchers and scholars to get an overview of different terminologies in the study of the Water User Associations and how it helps to assess the performance of Water User Associations in various context.
Acknowledgement
Acknowledgement:The first author is thankful to Indian Council of Agricultural Research (ICAR) for Providing National Talent Fellowship to complete the research.
Figures and tables from the paper
| Sr. No. | Characteristics | — | Water User Associations | — | — | — | — | — | — | — | — | Overall |
|---|---|---|---|---|---|---|---|---|---|---|---|---|
| Head reach | Middle reach | Tail reach | ||||||||||
| Yashwant WUA | Shree Ram WUA | Total | Hanuman WUA | Sri Datt WUA | Total | Shiv shankar WUA | Jagdamba WUA | Total | ||||
| 1. | Establishment year | 2006 | 2006 | - | 2006 | 1989 | - | 2006 | 2006 | - | - | |
| 2. | WUA location | Reach | Head | Head | - | Middle | Middle | - | Tail | Tail | - | Middle |
| Canal | Minor | Minor | - | Minor | Minor | - | Minor | Minor | - | Minor | ||
| 3. | No. of village | 4 | 3 | 7 | 2 | 2 | 4 | 1 | 1 | 2 | 13 | |
| 4. | Operational area | 5.5 | 4 | 9.5 | 4 | 2.18 | 6.18 | 1 | 2 | 3 | 18.68 | |
| 5. | Cultivable command area | 524.72 | 219.17 | 743.89 | 387 | 509 | 896 | 164 | 291 | 455 | 2094.89 | |
| 6. | Total irrigable area (TIA=CCA*0.8) | 419.78 | 175.34 | 595.11 | 309.6 | 407.2 | 716.8 | 131.2 | 232.8 | 364 | 1675.91 | |
| 7. | Water entitlement | 456.65 | 190.66 | 647.31 | 324.76 | 437.99 | 762.75 | 345 | 612 | 957 | 2367.06 | |
| 8. | Water supplied to WUA | 471.74 | 287.55 | 759.29 | 459.70 | 478.79 | 938.49 | 472.50 | 733.67 | 1206.2 | 2903.95 | |
| 9. | Irrigated area at the beginning of WUA | 510 | 210 | 720 | 320 | 465 | 785 | 130 | 245 | 375 | 1880 | |
| 10. | Actual irrigated area | 434 | 231.5 | 665.5 | 245.5 | 274.16 | 519.66 | 275 | 317.5 | 592.5 | 1777.66 | |
| 11. | Net irrigated area | 508 | 213.17 | 721.17 | 370 | 361.39 | 731.39 | 147.5 | 290 | 437.5 | 1890.06 | |
| 12. | Operational cost | 198666 | 103333 | 301999 | 85333 | 127017 | 212350 | 128323 | 156567 | 284890 | 799239 | |
| 13. | Maintenance cost | 45000 | 15676 | 60676 | 25560 | 41283 | 66843 | 23000 | 35000 | 58000 | 185519 | |
| 14. | Physical system | |||||||||||
| Length of minor canal | 5.5 | 4 | 9.5 | 4 | 2.18 | 6.18 | 1 | 2 | 3 | 18.68 | ||
| No. of irrigation system structure | 4 | 3 | 7 | 7 | 0 | 7 | 3 | 0 | 3 | 17 | ||
| No. of outlet | Repaired | 17 | 5 | 22 | 6 | 13 | 19 | 1 | 3 | 4 | 45 | |
| Un-repaired | 5 | 0 | 5 | 6 | 0 | 6 | 2 | 0 | 2 | 13 | ||
| Total | 22 | 5 | 27 | 12 | 13 | 25 | 3 | 3 | 6 | 58 | ||
| 15. | Method of water distribution | |||||||||||
| Method | Tail to head | 1 | 1 | 2 | 1 | 1 | 2 | 1 | 1 | 2 | 6 | |
| Head to tail | 0 | 0 | 0 | 0 | 0 | 0 | 0 | 0 | 0 | 0 | ||
| Basis | Volumetric | 1 | 1 | 2 | 1 | 1 | 2 | 1 | 1 | 2 | 6 | |
| Area | 0 | 0 | 0 | 0 | 0 | 0 | 0 | 0 | 0 | 0 | ||
| Nature | Rotational | 0 | 0 | 0 | 0 | 0 | 0 | 0 | 0 | 0 | 0 | |
| Demand | 1 | 1 | 2 | 1 | 1 | 2 | 1 | 1 | 2 | 6 | ||
| 16. | Method of water fee assessment | |||||||||||
| a) Volumetric | 0 | 0 | 0 | 0 | 0 | 0 | 0 | 0 | 0 | 0 | ||
| b) Area | 1 | 1 | 2 | 1 | 1 | 2 | 1 | 1 | 2 | 6 | ||
| 17. | Water User Associations, general body membership | |||||||||||
| Men | 360 | 157 | 517 | 432 | 448 | 880 | 181 | 355 | 536 | 1933 | ||
| Women | 125 | 80 | 205 | 179 | 138 | 317 | 77 | 100 | 177 | 699 | ||
| Total | 485 | 237 | 722 | 611 | 586 | 1197 | 258 | 455 | 713 | 2632 | ||
| 18. | Water User Associations, management committee membership | |||||||||||
| Men | 9 | 6 | 15 | 7 | 6 | 13 | 6 | 6 | 12 | 40 | ||
| Women | 3 | 3 | 6 | 2 | 3 | 5 | 3 | 3 | 6 | 17 | ||
| Total | 12 | 9 | 21 | 9 | 9 | 18 | 9 | 9 | 18 | 57 |
Table text extracted from the original PDF; superscript letters are shown inline. The original table image is below.
View original table image
References
4 in the original paper- Amarasinghe UA, Shah T, Turral H, Anand BK. India's water future to 2025-2050: Business as usual scenario and deviations. Res Rep 123. Colombo, Sri Lanka: International Water Management Institute; c2007.
- Harsh J. Micro-irrigation in India: An assessment of bottlenecks and realities [Internet]. Global Water Forum. Available from: https://www.globalwaterforum.org/2017/06/13/microirrigation-in-india-an-assessment-of-bottlenecks-andrealities/ Accessed August 3, 2017.
- Manivannan S, Thilagam VK, Khola OPS. Soil and water conservation in India: Strategies and research challenges. J Soil Water Conserv. 2017;16(4):312-319.
- Paul JC, Panigrahi B. Artificial conservation measures on groundwater recharge, irrigation potential and productivity of crops of Bharkatia Watershed Odisha. J Soil Water Conserv. 2016;15(2):134-140.