
Research article · 2024 · Full text
International Journal of Agriculture Extension and Social DevelopmentComparison of socio-economic profile characteristics of scheduled caste and non-scheduled caste farm families in Karnataka
Volume 7(8) · Pages 645–650 · DOI: 10.33545/26180723.2024.v7.i8i.1028 ↗
Research areasAgricultural Economics and PracticesLivestock Management and Performance ImprovementSocial and Economic Development in India
Abstract
Author-writtenThe rural society is a mix of people belonging to various caste, creed and religion. Also there are agricultural labourers, tenants and share croppers who are socially weak and economically poor. Many of these farmers come from socially backward groups such as scheduled castes (SC) which is found at the bottom of rural social hierarchy. This study was undertaken in the State of Karnataka to compare the socio-economic status of SC and non-SC farm families and develop strategies to empower SC farm families. The results indicated that middle aged farmers (36-50 years) from both SC and non-SC community dominated in agriculture, female labour participation rate was higher among SC farm families (29.17%), more than 90 per cent of the SC and non-SC respondents were married, nuclear families were predominantly found, SC farm families involved more in agricultural labour, higher educational qualification was rarely found among SC farm families, more than one third of SC farm families (38.33%) were landless while only 11.25 per cent of the non-SC farm families did not own any land and agricultural labour was the main source of livelihood to SC farm families in the study districts. The stark differences in socio-economic status of SC and non-SC farm families calls for strategies to bring them on to the forefront of mainstream society.
Summary
Source-checkedPlain-language reading of the full paper, prepared with AI and checked against the text. Each point links to the authors' own words.
Why it matters
- Scheduled castes (SC) in rural India are often socially backward and occupy the lowest position in the rural social hierarchy. View evidence ↗
- Despite making up a large portion of agricultural workers, Scheduled Castes are among the most exploited groups and typically do not own land. View evidence ↗
- There is a significant disparity in land ownership, with Scheduled Castes possessing only 11.84% of total operational holdings compared to 79.33% held by general farmers. View evidence ↗
The question
- The study aimed to compare the socio-economic status of Scheduled Caste (SC) and non-SC farm families in Karnataka to create empowerment strategies for SC families. View evidence ↗
What they did
- The research was conducted across five districts in Karnataka: Kalaburagi, Belagavi, Kolar, Mysuru, and Dharwad. View evidence ↗
- Data was gathered via structured interview schedules and analyzed using frequency and simple percentage statistical tools. View evidence ↗
What they found
- Female labor participation was higher among SC farm families (29.17%) than among non-SC farm families (14.58%). View evidence ↗
- Nuclear families were the predominant family type for both groups, though more common among non-SC (93.33%) than SC (76.67%) respondents. View evidence ↗
- Educational attainment was lower for SC respondents, with approximately 30% having no schooling compared to 9.58% of non-SC respondents. View evidence ↗
- Landlessness was significantly more prevalent in SC farm families (38.33%) than in non-SC farm families (11.25%). View evidence ↗
What it means
- The authors conclude that the socio-economic status of Scheduled Caste farm families is lower than that of non-Scheduled Caste farm families. View evidence ↗
- The authors recommend establishing Farmer Producer Organisations (FPOs) to consolidate agricultural holdings and improve production and marketing. View evidence ↗
Visual summary
3 visualsIllustrations explain the paper; charts are replotted from the paper's own table values.
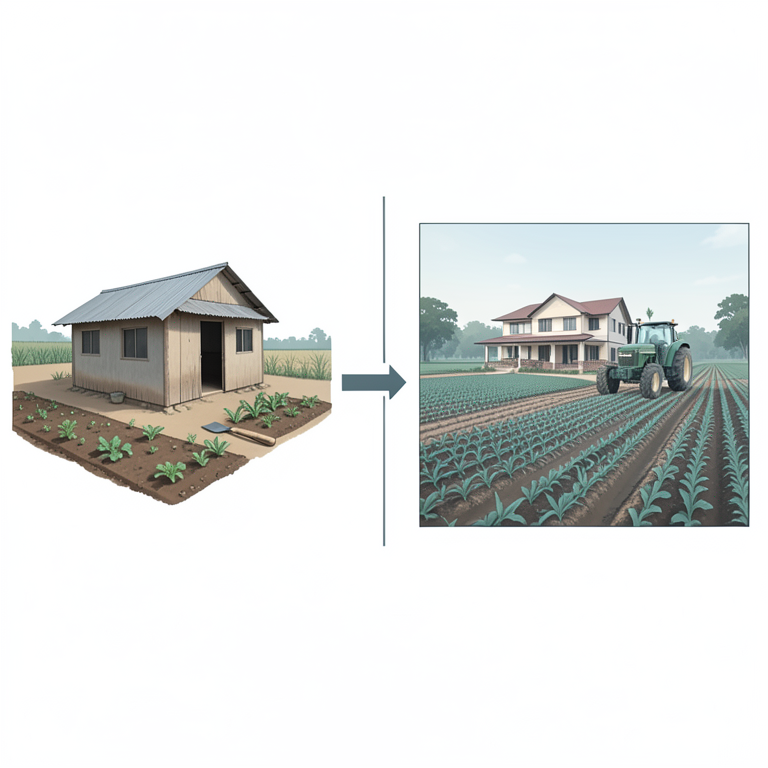
Socio-Economic Gap Concept
AI-generated conceptual illustration (Farm families in Karnataka, India). It explains the idea and does not show study data.
View source evidence ↗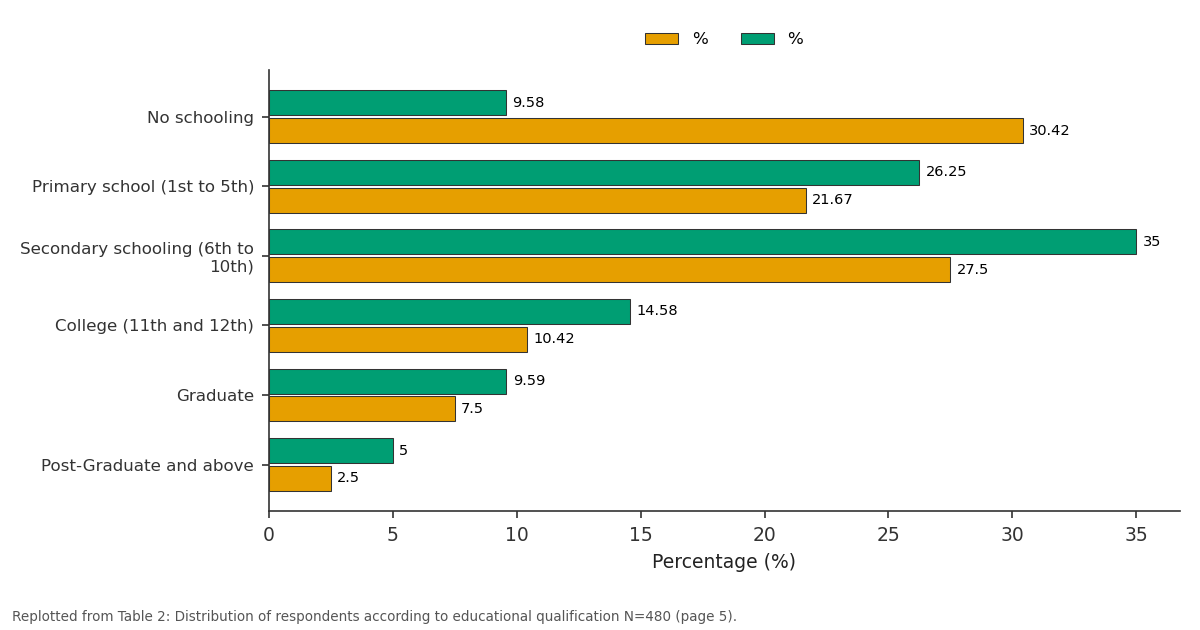
% and %: No schooling vs Primary school (1st to... vs Secondary schooling... vs College (11th and 12th) vs Graduate
Replotted from Table 2 (page 5) of the original paper. Every bar is the paper's own table value.
View source evidence ↗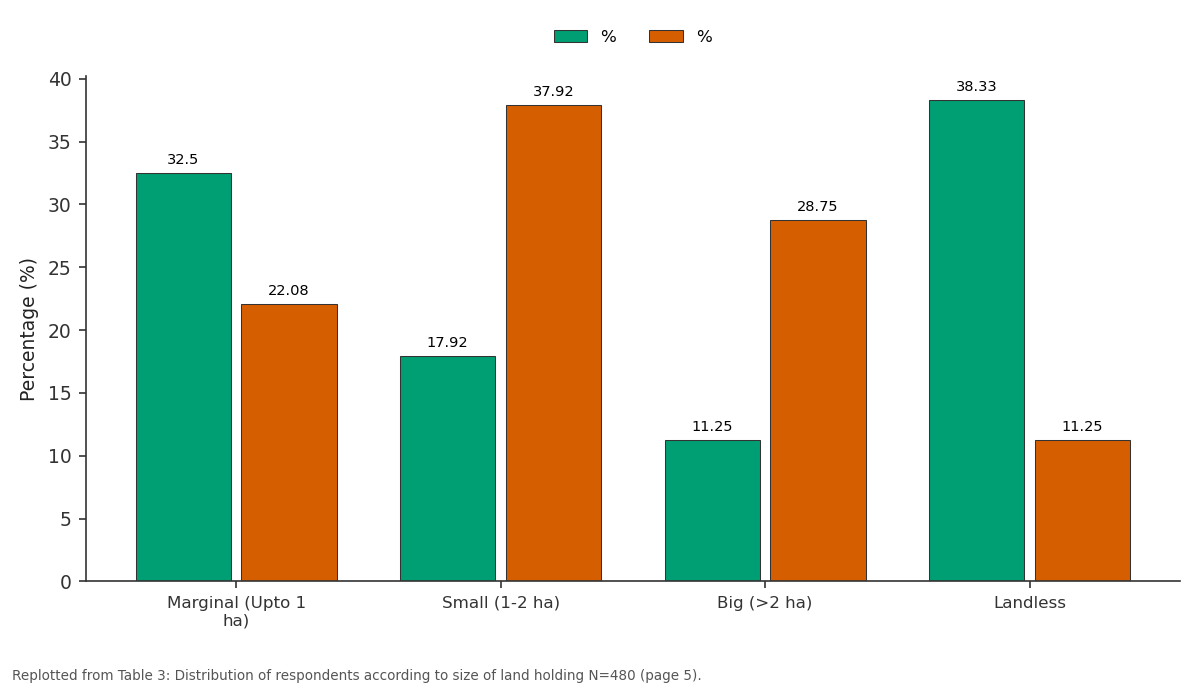
% and %: Marginal (Upto 1 ha) vs Small (1-2 ha) vs Big (>2 ha) vs Landless
Replotted from Table 3 (page 5) of the original paper. Every bar is the paper's own table value.
View source evidence ↗Figures & tables
From the original paper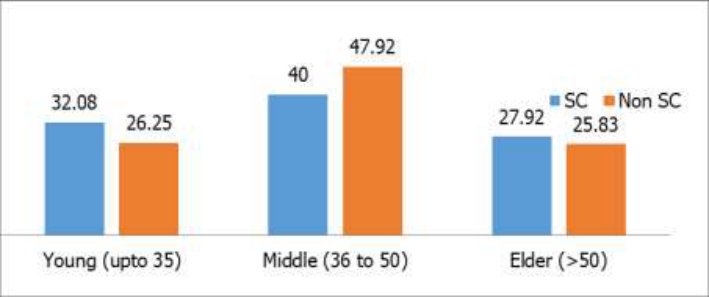 Figure 1
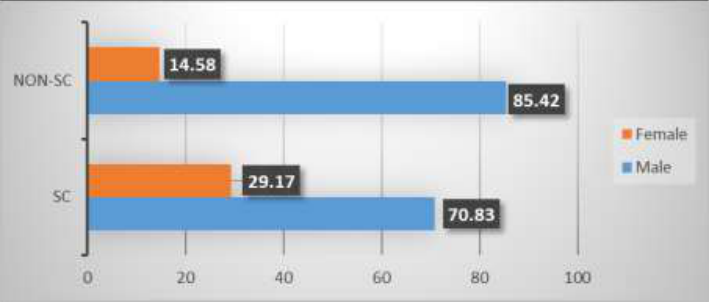 Figure 2
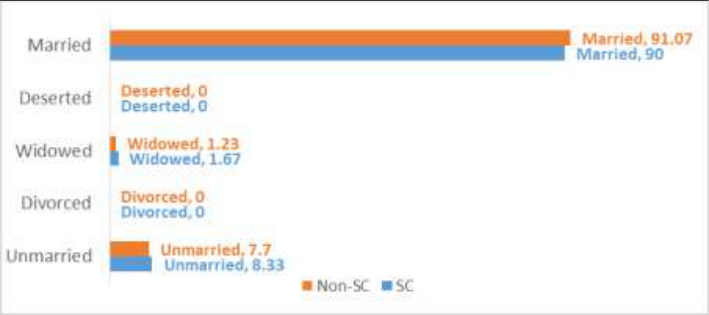 Figure 3
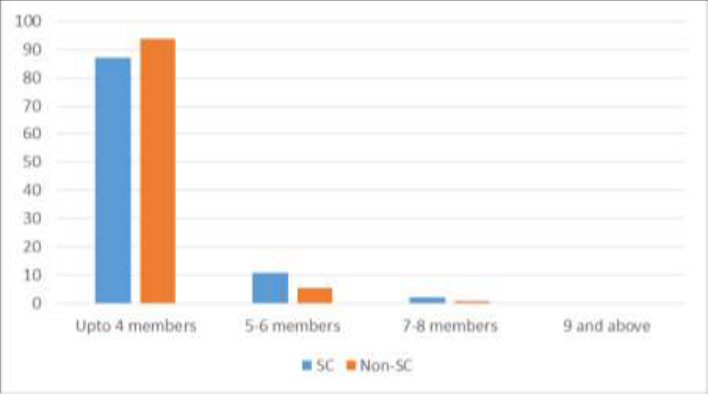 Figure 4
 Table 1
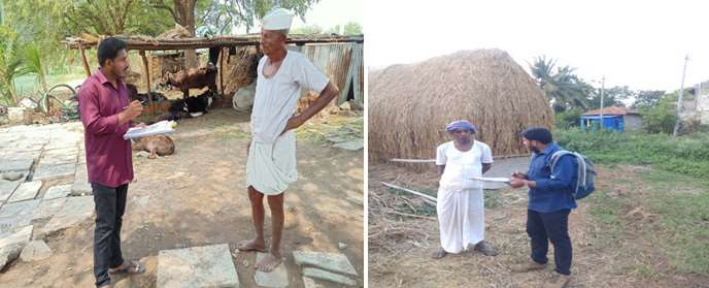 Figure 5
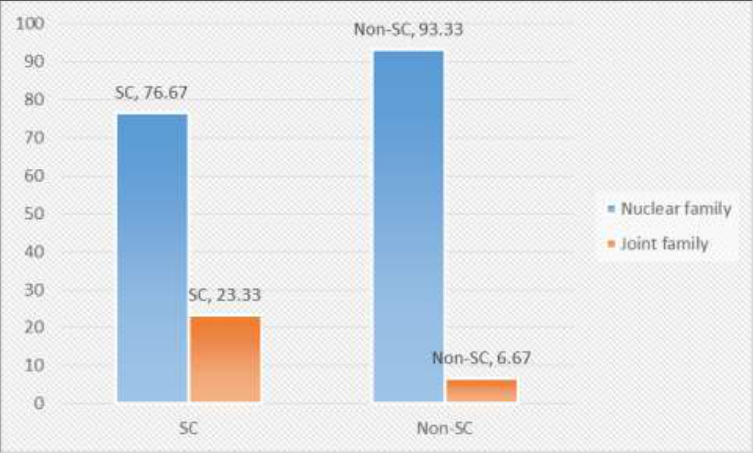 Figure 6
 Table 2
 Table 3
 Table 4
Introduction
India is a land of diversity. Diversity can be seen in each and every aspect of life beginning from soil, topography, resources availability, crops grown, food pattern, lifestyle, dressing, culture, customs, tradition, occupation and many more. Apart from huge urban and rural gap there exists stark differences within the urban and rural societies itself. Urban societies are complex in lifestyle aspects while rural societies are complex in their social structure. One can see deep social stratification within the rural society as compared to urban society where the stratification is not so deep. Agriculture is the main occupation of the rural people. It provides employment to about 47 per cent of the country's population (Economic Survey, 2022-23). Majority i.e., 86 percentage of the farmers in India are marginal and small farmers with a land holding of less than one hectare and one-two hectares respectively (Agriculture Census, 2015-16). There are some more classes such as agricultural labourers, tenants and share croppers who constitute meagre percentage. These farmers usually belong to socially disadvantaged groups such as scheduled castes and scheduled tribes. Scheduled caste is one of the most exploited, neglected and backward social groups in India. They account for a large proportion of India's agricultural workers but they generally do not own land and they are forced to do low-paying and undesirable occupations which do not permit social and economic upward mobility (Raghavendra, 2020). Scheduled Caste population possesses only about 11.84 per cent of the total operational holdings and operates 8.54 per cent of it as compared to 79.33 per cent of the total operational holdings held and 79.21 per cent of it operated by general farmers (Agriculture Census, 2015-16). This striking disparity and dispossession is a consequence of centuries of oppressive practices where Scheduled Caste cultivators mostly worked as slaves or labourers on the lands of elite property owners. The continuation of this system has only prolonged the docile status of Scheduled Caste farmers. In this regard a comprehensive analysis of socio-cultural status of scheduled caste (SC) would throw light on their standard of living and help in framing a development oriented strategy towards egalitarian society through appropriate interventions in agriculture.
Methodology
After a thorough review of the available literature several variables related to the socio-cultural status were considered for inclusion in the study. Ex-post-facto research design was employed to analyze the socio-cultural status of Scheduled Caste farm families as the researcher had least control over the selected variables. The study was conducted in Karnataka as Scheduled Castes form a sizeable portion (17.15%) of the State's population and also there are about 101 different sub-castes which is highest for any given State www.extensionjournal.com in the country. Based on the percentage of SC population to the total population in the district the following districts Kalaburagi and Belagavi in the northern part, Kolar and Mysuru in the southern part and Dharwad in the north western part of the State were selected. Two blocks were randomly chosen from each district and from each block two villages were selected randomly thus constituting 10 blocks and 20 villages for the study. From each village 12 SC and 12 non-SC farmers were chosen randomly to assess their socio-cultural status. In total 240 SC farmers and 240 non-SC farmers were interviewed in the study areas. Statistical tools like frequency, simple percentage were used and the data was collected from the respondents using structured interview schedule.
Results and Discussions 1. Age Fig. 1 revealed that, more than one third of the SC respondents (40.00%) belonged to middle age group (36 to 50 years) followed by nearly a third (32.08%) belonging to young age group (upto 35 years) and remaining 27.92 per cent were elders (> 50 years) while 47.92 per cent of non-SC respondents were of middle age, 26.25 per cent were young and 25.83 per cent were elders. The middle and younger age groups can be motivated for practising scientific farming with higher farm efficiency. Similar findings were supported by Ponnusamy and Gupta (2006). (29.17%) and (14.58%) were women respectively. The findings correlate with Sardar (2020). Women perform most of the activities on farm including sowing, weeding, intercultural operations, transplanting, harvesting, winnowing, grading, packaging and branding except marketing over which the men have complete control. More than 80 per cent of the economically active women in the country are involved in agriculture. Their participation in agriculture and allied activities is mainly as unpaid family laobour. In dairying, more than 70 per cent of the activities such as cleaning the cattle shed, milching, grazing is done by women. However, SC women who were involved in carrying out farming and allied activities were more compared to non-SC women during the time of data collection. It was observed that the SC women worked as farm labourers for wage on others' farm during early morning hours as well as evening hours. The reason might be that SC households are relatively poor in economic status as compared to non-SC households which prompts the SC family members to work in order to secure their livelihood. Moreover, farm labour and animal husbandry, particularly dairy were the important sources of livelihood for the SC community. Since care and maintenance of dairy animals were largely looked after by SC women in the study areas, they constituted as considerable number of respondents. Indian society is typically patriarchal where it is difficult to get opportunity to interact with women although major farming operations are being looked after by them.
Marital status
Fig. 3 showed that, majority of the SC (90.00%) and non-SC (91.07%) respondents were married with only 8.33 per cent and 7.70 per cent respondents being unmarried in both the communities respectively. The rural population has discontinued the ill-practices such as child marriage and also the youths are more inclined towards finding secure livelihood before getting married as a result of which the average age for marriage has pushed higher in rural areas compared to earlier time. This might be due to the awareness among the youths regarding health problems associated with the child marriage as well as strict implementation of laws against child marriage by the authorities. 6 shows that, majority of the respondents in both SC (76.67%) and non-SC (93.33) categories had nuclear families consisting of respondent, wife/husband and their unmarried children whereas higher percentage of SC respondents (23.33%) were living in joint families with more than one married couple in the family compared with 6.67 per cent of the non-SC respondents (Table 5.5). Similar findings were reported by Deshingkar and Start (2003). The proportion of traditional joint family system is declining in rural areas due to modern lifestyle and migration of farm families into urban areas in search of regular wage-based jobs and also families get separated due to social, educational and financial reasons (Ponnusamy, 2006).
Experience in agriculture and allied activities
Table 1 clearly showed that, more than half of the non-SC respondents (57.08%) and nearly half of the SC respondents (48.75%) had medium experience in farming. More than one third of non-SC respondents (35.00%) and 30.42 per cent of SC respondents had high farming experience. One fifth of SC respondents (20.83%) and less than one-tenth (7.92%) of non-SC respondents had low level of farming experience. The overall involvement of SC respondents in farming activities was lower compared to non-SC respondents. This might be either due to landlessness among SC respondents or they owned meagre land holdings which were insufficient for practising sustainable agriculture and also majority of them were agriculture labourers who worked on other farms or migrated to urban areas for earning regular wages, which indicated that casual labour is the main source of livelihood. These findings correlated with the findings of Krishnan (2019). However, it is to be noted that being farm labourers, SC farmers have better manual work experience rather than planning and monitoring experience.
| S. No. | Years of experience | SC (n=240) | — | Years of experience | Non-SC (n=240) | — |
|---|---|---|---|---|---|---|
| F | % | F | % | |||
| 1 | Low (1-16 years) | 50 | 20.83 | Low (1-12 years) | 19 | 7.92 |
| 2 | Medium (17-29 years) | 117 | 48.75 | Medium (13-24years) | 137 | 57.08 |
| 3 | High (30-47 years) | 73 | 30.42 | High (25-42 years) | 84 | 35.00 |
Table text extracted from the original PDF; superscript letters are shown inline. The original table image is below.
View original table image
Size of land holding
Table 3 revealed that, more than one third of SC farm families (38.33%) were landless while only 11.25 per cent of the non-SC farm families did not own any land. These landless SC farm families work as farm labourers on other farms for their livelihood. Huge disparity was observed in the size of landholdings between the SC and non-SC farm families. Nearly one third SC farm families (32.50%) were marginal farmers with less than 1 ha land while only 22.08 per cent of non-SCs belonged to this category. Small and big farmers among SC farm families accounted for about 17.92 and 11.25 per cent with land holding of 1-2 ha and more than two ha respectively. However, higher percentage of non-SC farm families belonged to small (37.92%) and big (28.75%) land holding categories. These findings correlate with the work of Ponnusamy (2006) and Krishnan (2019). These landless SC farm families have no alternative source of income in villages other than agriculture. Thus, the only option left for the community is to explore jobs in the service sector. Hence, they are forced to migrate to cities during off-season and work in low paying jobs. But many of these migrants try to find menial jobs such as maids, construction workers, security guards, and casual labourers to secure their livelihood and settle in slums which make them vulnerable to diseases, uncertainties like COVID-19 lockdown. The poor economic situation of the rural household forces all the family members to seek employment which has led to discontinuance or drop-out from educational institutions. This can be checked through appropriate social security schemes and incentives for higher studies. Nuclear family was predominantly found in the study areas which indicated the transformation in rural demographic structure. Due to inheritance of ancestral property the fragmentation of land holdings has become unavoidable which has resulted in low per capita land holdings where mechanization and higher productivity are not possible resulting in lower annual income for the farm families. Consolidation of agricultural holdings by establishing Farmer Producer Organisations (FPOs) will be of great help in improving production, processing and marketing. Agricultural labour has become the main source of income to the rural families. Crop and livestock income have declined. Labour supply is more in rural areas which can be efficiently used to create public infrastructure in agriculture by guaranteeing minimum wages which is a win-win situation for both the government as well as farmers.
| S. No. | Size of land holding | SC (n=240) | — | Non-SC (n=240) | — |
|---|---|---|---|---|---|
| F | % | F | % | ||
| 1 | Marginal (Upto 1 ha) | 78 | 32.50 | 53 | 22.08 |
| 2 | Small (1-2 ha) | 43 | 17.92 | 91 | 37.92 |
| 3 | Big (>2 ha) | 27 | 11.25 | 69 | 28.75 |
| 4 | Landless | 92 | 38.33 | 27 | 11.25 |
Table text extracted from the original PDF; superscript letters are shown inline. The original table image is below.
View original table image
Acknowledgement
AcknowledgementThe Research Study was undertaken as part of Ph.D. in the Department of Agricultural Extension, ICAR-National Dairy Research Institute, under the chairmanship of Dr. K. Ponnusamy (Major Advisor). I would like to thank my research guide Dr. K. Ponnusamy, Head, Division of Social Sciences, ICAR-Central Plantation Crop Research Institute, Kasaragod-671124 for encouraging and giving moral support to conduct the research . I also thank all the respondent farmers of Kalaburagi, Kolar, Belagavi, Mysore and Dharwad districts of Karnataka State for hosting me and giving cooperation during the data collection.
Figures and tables from the paper
| S. No. | Educational qualification | SC (n=240) | — | Non-SC (n=240) | — |
|---|---|---|---|---|---|
| F | % | F | % | ||
| 1 | No schooling | 73 | 30.42 | 23 | 9.58 |
| 2 | Primary school (1st to 5th) | 52 | 21.67 | 63 | 26.25 |
| 3 | Secondary schooling (6th to 10th) | 66 | 27.50 | 84 | 35.00 |
| 5 | College (11th and 12th) | 25 | 10.42 | 35 | 14.58 |
| 6 | Graduate | 18 | 7.50 | 23 | 9.59 |
| 7 | Post-Graduate and above | 6 | 2.50 | 12 | 5.00 |
Table text extracted from the original PDF; superscript letters are shown inline. The original table image is below.
View original table image
| S. No. | SC (n=240) | — | — | Non-SC (n=240) | — | — |
|---|---|---|---|---|---|---|
| Annual family income (Rs.) | F | % | Annual family income (Rs.) | F | % | |
| 1 | Low (20000-40989) | 167 | 69.58 | Low (70000-100,000) | 62 | 25.83 |
| 2 | Medium (40990-45417) | 47 | 19.58 | Medium (100,001-156,000) | 105 | 43.75 |
| 3 | High (45418-70000) | 26 | 10.83 | High (156,001-250,000) | 73 | 30.42 |
Table text extracted from the original PDF; superscript letters are shown inline. The original table image is below.
View original table image
References
6 in the original paper- Agriculture Census. 2015-16. Agriculture Census Division. Department of Agriculture, Co-operation & Farmers Welfare. Ministry of Agriculture & Farmers Welfare, Government of India.
- Economic Survey. 2021-22. Ministry of Finance, Government of India. Available from: https://static.pib.gov.in/
- Kaur A. Socio-economic mobility among Schedule Caste: A study of village Mugalmagri in Rupnagar district of Punjab. Int J Humanities Soc Sci Invention. 2015;4(3):41-51.
- Ponnusamy K, Gupta J. Evaluation of farming systems through SWOT analysis. Indian J Dairy Sci. 2006;59(6):405-409.
- Raghavendra RH. Literacy and health status of scheduled castes in India. Contemp Voice Dalit. 2020;12(1):1-14.
- Sardar S. An analysis on socio-economic status of scheduled castes population in Tirol village, Arambagh, Hooghly. Int J Res-Granthaalayah. 2020;8(07):401-409.