
Research article · 2024 · Full text
International Journal of Agriculture Extension and Social DevelopmentAdoption of improved cotton cultivation practices by the farmers in Rayagada district of Odisha
Volume 7(8) · Pages 610–613 · DOI: 10.33545/26180723.2024.v7.i8i.995 ↗
Research areasAgricultural Economics and PracticesLivestock Management and Performance ImprovementAgricultural Innovations and Practices
Abstract
Author-writtenThis study examines the socio-economic characteristics and adoption levels of improved cotton cultivation practices among farmers in Rayagada District, Odisha. The analysis of socio-economic data reveals that the majority of respondents are middle-aged males engaged primarily in agriculture combined with other occupations, and most live in joint families in semi-cemented houses. Landholding sizes are predominantly low, and information sources, scientific orientation, and risk orientation are mostly at medium levels. The adoption of various improved practices, including field preparation, improved varieties, and irrigation, shows significant variation. While practices like improved variety and line sowing have relatively higher adoption rates, others such as seed treatment and plant spacing have lower adoption levels. The overall distribution of respondents by adoption level indicates a concentration in the medium category, with lower and higher categories also represented. Correlation analysis identifies strong positive relationships between adoption levels and factors such as progressiveness, mass media exposure, and source of information. Significant correlations are also observed with scientific orientation, risk orientation, and economic orientation. Conversely, age, gender, and land holding exhibit varying degrees of influence, with age showing the strongest correlation. These findings underscore the need for targeted interventions to address barriers to adoption and enhance the effectiveness of extension services and information dissemination in promoting improved cotton cultivation practices.
Summary
Source-checkedPlain-language reading of the full paper, prepared with AI and checked against the text. Each point links to the authors' own words.
Why it matters
- Modernizing cotton cultivation practices is essential for increasing productivity, sustainability, and economic viability in farming. View evidence ↗
- In the Rayagada District of Odisha, cotton is vital to the local economy, but traditional farming suffers from low productivity and pest issues. View evidence ↗
- Transitioning to improved methods can help Rayagada farmers increase yields and reduce costs, supporting regional economic stability. View evidence ↗
The question
- The study aimed to assess the extent to which farmers adopted improved cotton cultivation practices. View evidence ↗
What they did
- The researchers used a descriptive research design to analyze the socio-economic traits and adoption levels of farmers in the Rayagada District. View evidence ↗
- The study sample consisted of 120 respondents. View evidence ↗
What they found
- Most participants were male (67.50%) and fell within the middle age group of 36-55 years (73.33%). View evidence ↗
- Progressiveness showed the strongest positive correlation (0.999) with the adoption of improved practices. View evidence ↗
- High adoption rates were strongly linked to mass media exposure (0.996) and access to information sources (0.994). View evidence ↗
- Age had a strong positive correlation (0.988), suggesting older farmers were more likely to adopt improved practices. View evidence ↗
- Gender (0.129) and land holding (0.01) had minimal to no significant influence on the adoption of improved practices. View evidence ↗
What it means
- The authors conclude that increasing mass media exposure and improving communication channels are key to enhancing farmer knowledge and adoption. View evidence ↗
- The authors recommend fostering scientific and risk-oriented attitudes and providing economic support and extension services to accelerate adoption. View evidence ↗
Figures & tables
From the original paper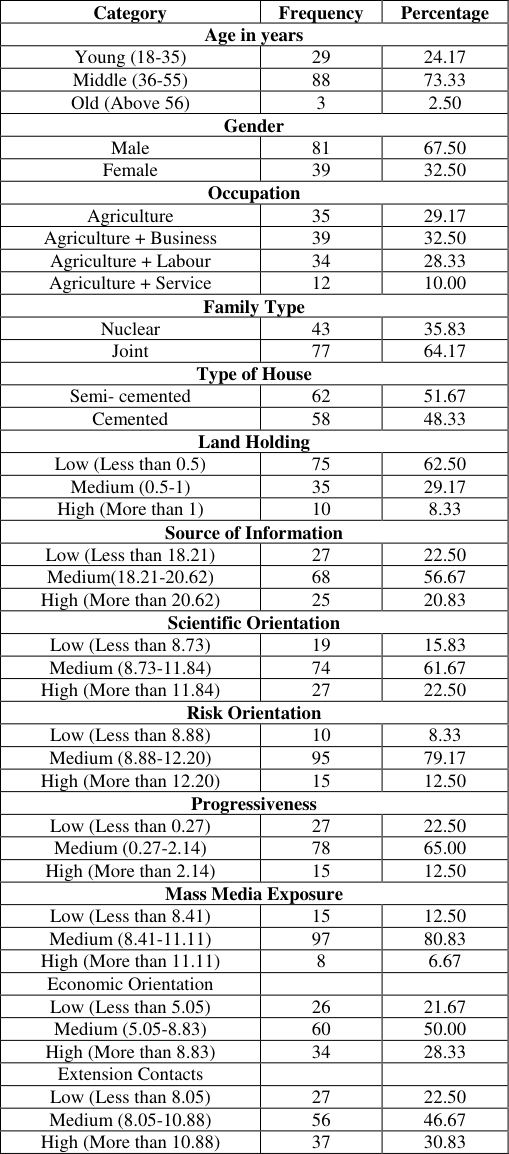 Table 1
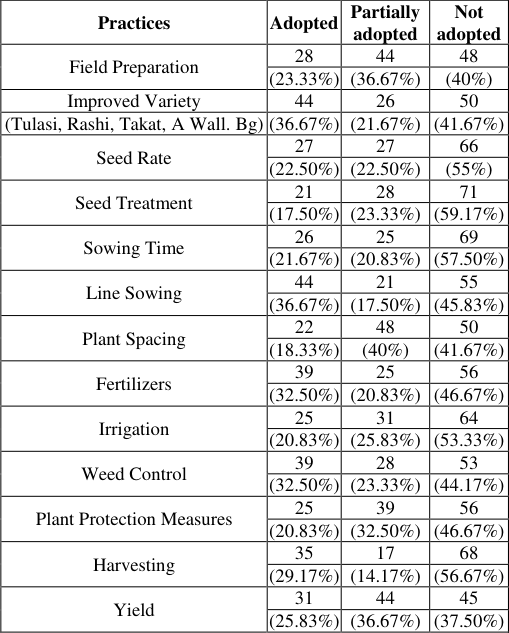 Table 2
 Table 3
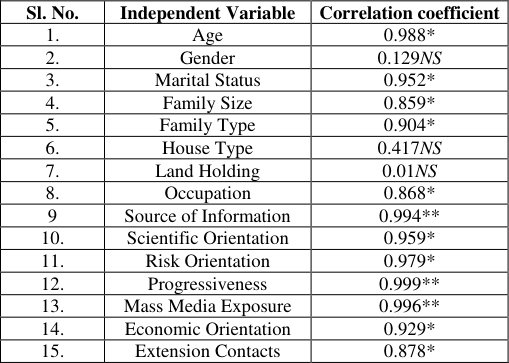 Table 4
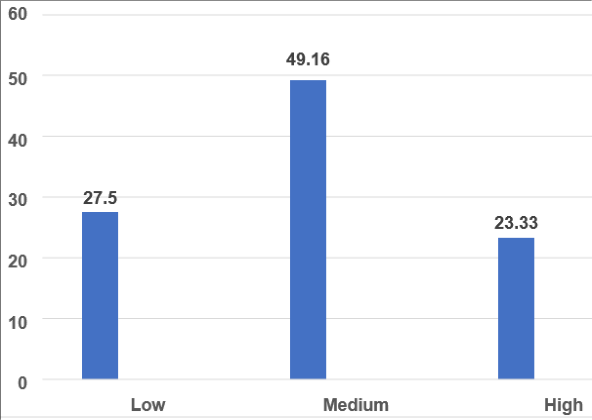 Figure 1
Introduction
The adoption of improved cotton cultivation practices represents a significant shift towards modernizing agricultural methods to enhance productivity, sustainability, and economic viability in cotton farming. This approach involves integrating advanced techniques and technologies to address the challenges faced by traditional farming methods, such as low yields, soil degradation, and pest management issues. Improved practices typically include the use of high-yielding and pest-resistant cotton varieties, efficient irrigation systems, and innovative soil management strategies. Additionally, these practices emphasize the importance of sustainable methods, such as integrated pest management and conservation tillage, to reduce environmental impact. The adoption of these practices is crucial for increasing crop yields, improving the quality of cotton, and ensuring the long-term sustainability of cotton farming. By incorporating these advancements, farmers can achieve greater efficiency, reduce input costs, and contribute to the overall growth and stability of the agricultural sector. Rayagada District in Odisha, India, is a key agricultural area where cotton cultivation plays a vital role in the local economy. Despite its importance, traditional cotton farming in this region is plagued by issues such as low productivity, pest problems, and environmental concerns. Adopting improved cotton cultivation practices offers a promising solution to these challenges. These modern practices include using high-yielding, pest-resistant varieties, advanced soil and water management techniques, and integrated pest management (IPM). By transitioning to these enhanced methods, cotton farmers in Rayagada can potentially boost their yields, reduce costs, and promote sustainable farming, thus addressing current constraints and supporting economic stability in the district.
Objective
To assess the adoption of improved cotton cultivation practices by the respondents.
Research Methodology
The study employed a Descriptive Research Design to systematically describe the socio-economic characteristics of farmers and their adoption levels of improved cotton cultivation practices in Rayagada District, Odisha. This design was chosen to capture detailed information about the population and provide a comprehensive analysis of the adoption patterns without influencing or altering the behavior of the subjects. www.extensionjournal.com The table 2 illustrates the distribution of respondents according to their level of adoption of various improved cotton cultivation practices. Among the practices listed, "Improved Variety" has the highest proportion of adoption (36.67%), with 41.67% not adopting this practice. "Field Preparation" and "Line Sowing" are also relatively welladopted at 23.33% and 36.67%, respectively, though a significant portion of respondents have either partially adopted or not adopted these practices. Practices like "Seed Treatment" and "Sowing Time" have lower adoption rates, with 59.17% and 57.50% not adopting them, respectively. "Plant Spacing" and "Irrigation" show considerable nonadoption rates at 41.67% and 53.33%, respectively. On the other hand, "Fertilizers" and "Weed Control" have notable adoption at 32.50%, though a substantial number of respondents have not adopted these practices either. "Harvesting" and "Yield" practices reflect a mix of partial and non-adoption, with a high percentage of non-adopters in harvesting (56.67%) and a significant percentage in yield (37.50%). Overall, while some practices are relatively welladopted, many still see a high level of partial or nonadoption. www.extensionjournal.com The table 3 & graph provides a breakdown of respondents based on a specific categorical measure, with three distinct levels. The majority of respondents fall into the "Medium" category (27-29), representing 49.16% of the total sample. This is followed by the "Low" category (24-26) with 27.5% of respondents. The "High" category (30-32) includes 23.33% of the respondents. Overall, the distribution is fairly balanced among the categories, with a clear concentration in the medium range. Extension Contacts 0.878* * Significant at 0.05 percent level of probability ** Significant at 0.01 percent level of probability NS= Non-Significant
| Sl. No. | Categories | Frequency | Percentage |
|---|---|---|---|
| 1 | Low (24-26) | 33 | 27.5 |
| 2 | Medium (27-29) | 59 | 49.16 |
| 3 | High (30-32) | 28 | 23.33 |
| Total | 120 | 100 |
Table text extracted from the original PDF; superscript letters are shown inline. The original table image is below.
View original table image
| Practices | Adopted | Partially adopted | Not adopted |
|---|---|---|---|
| Field Preparation | 28 | 44 | 48 |
| (23.33%) | (36.67%) | (40%) | |
| Improved Variety | 44 | 26 | 50 |
| (Tulasi, Rashi, Takat, A Wall. Bg) | (36.67%) | (21.67%) | (41.67%) |
| Seed Rate | 27 | 27 | 66 |
| (22.50%) | (22.50%) | (55%) | |
| Seed Treatment | 21 | 28 | 71 |
| (17.50%) | (23.33%) | (59.17%) | |
| Sowing Time | 26 | 25 | 69 |
| (21.67%) | (20.83%) | (57.50%) | |
| Line Sowing | 44 | 21 | 55 |
| (36.67%) | (17.50%) | (45.83%) | |
| Plant Spacing | 22 | 48 | 50 |
| (18.33%) | (40%) | (41.67%) | |
| Fertilizers | 39 | 25 | 56 |
| (32.50%) | (20.83%) | (46.67%) | |
| Irrigation | 25 | 31 | 64 |
| (20.83%) | (25.83%) | (53.33%) | |
| Weed Control | 39 | 28 | 53 |
| (32.50%) | (23.33%) | (44.17%) | |
| Plant Protection Measures | 25 | 39 | 56 |
| (20.83%) | (32.50%) | (46.67%) | |
| Harvesting | 35 | 17 | 68 |
| (29.17%) | (14.17%) | (56.67%) | |
| Yield | 31 | 44 | 45 |
| (25.83%) | (36.67%) | (37.50%) |
Table text extracted from the original PDF; superscript letters are shown inline. The original table image is below.
View original table image
Results and Discussion
The table 4 illustrates the correlation coefficients between various socio-economic profiles of respondents and their adoption of improved cotton cultivation practices. The strongest positive relationship is observed with progressiveness, which has a near-perfect correlation coefficient of 0.999, indicating that those who are more progressive are highly likely to adopt improved practices. Mass Media Exposure and Source of Information also show very high correlations, with coefficients of 0.996 and 0.994 respectively, suggesting that greater media exposure and access to better information sources are strongly linked to higher adoption rates. Scientific Orientation and Risk Orientation exhibit strong positive correlations of 0.959 and 0.979, respectively, reflecting that respondents with a scientific approach and higher risk tolerance are more inclined to adopt new practices. Economic Orientation and Extension Contacts show moderate to strong correlations, with coefficients of 0.929 and 0.878, highlighting that economic considerations and frequent extension contacts positively influence adoption. Occupation, Family Type, and Marital Status also demonstrate significant positive correlations, with coefficients ranging from 0.868 to 0.952, indicating their importance in adoption. Family Size shows a moderately strong correlation at 0.859, while House Type has a weaker positive correlation of 0.417. Age exhibits a strong correlation of 0.988, suggesting that older individuals may be more inclined to adopt improved practices. In contrast, Gender and Land Holding show very weak or nonsignificant correlations, with coefficients of 0.129 and 0.01, respectively, indicating minimal influence on adoption levels.
| Sl. No. | Independent Variable | Correlation coefficient |
|---|---|---|
| 1. | Age | 0.988* |
| 2. | Gender | 0.129NS |
| 3. | Marital Status | 0.952* |
| 4. | Family Size | 0.859* |
| 5. | Family Type | 0.904* |
| 6. | House Type | 0.417NS |
| 7. | Land Holding | 0.01NS |
| 8. | Occupation | 0.868* |
| 9 | Source of Information | 0.994** |
| 10. | Scientific Orientation | 0.959* |
| 11. | Risk Orientation | 0.979* |
| 12. | Progressiveness | 0.999** |
| 13. | Mass Media Exposure | 0.996** |
| 14. | Economic Orientation | 0.929* |
| 15. | Extension Contacts | 0.878* |
Table text extracted from the original PDF; superscript letters are shown inline. The original table image is below.
View original table image
Conclusion
In conclusion, the investigation into the knowledge and adoption of improved cotton cultivation practices in Rayagada District of Odisha underscores the pivotal role that socio-economic factors play in shaping agricultural outcomes. The study reveals a strong correlation between www.extensionjournal.com various socio-economic profiles and the level of adoption of these advanced practices. Factors such as progressiveness, mass media exposure, and access to information sources significantly influence farmers' willingness to embrace modern techniques, highlighting the importance of targeted educational and informational interventions. The findings suggest that increased exposure to mass media and effective communication channels can greatly enhance farmers' knowledge and facilitate the adoption of improved practices. Additionally, fostering scientific and risk-oriented attitudes among farmers, along with providing robust economic support and extension services, can further accelerate the adoption process. While factors like family size and occupation also show notable correlations, the impact of less significant factors like house type, gender, and land holding are minimal, indicating that a focused approach addressing major influencers is more effective.
Figures and tables from the paper
| Category | Frequency | Percentage |
|---|---|---|
| Age in years | ||
| Young (18-35) | 29 | 24.17 |
| Middle (36-55) | 88 | 73.33 |
| Old (Above 56) | 3 | 2.50 |
| Gender | ||
| Male | 81 | 67.50 |
| Female | 39 | 32.50 |
| Occupation | ||
| Agriculture | 35 | 29.17 |
| Agriculture + Business | 39 | 32.50 |
| Agriculture + Labour | 34 | 28.33 |
| Agriculture + Service | 12 | 10.00 |
| Family Type | ||
| Nuclear | 43 | 35.83 |
| Joint | 77 | 64.17 |
| Type of House | ||
| Semi- cemented | 62 | 51.67 |
| Cemented | 58 | 48.33 |
| Land Holding | ||
| Low (Less than 0.5) | 75 | 62.50 |
| Medium (0.5-1) | 35 | 29.17 |
| High (More than 1) | 10 | 8.33 |
| Source of Information | ||
| Low (Less than 18.21) | 27 | 22.50 |
| Medium(18.21-20.62) | 68 | 56.67 |
| High (More than 20.62) | 25 | 20.83 |
| Scientific Orientation | ||
| Low (Less than 8.73) | 19 | 15.83 |
| Medium (8.73-11.84) | 74 | 61.67 |
| High (More than 11.84) | 27 | 22.50 |
| Risk Orientation | ||
| Low (Less than 8.88) | 10 | 8.33 |
| Medium (8.88-12.20) | 95 | 79.17 |
| High (More than 12.20) | 15 | 12.50 |
| Progressiveness | ||
| Low (Less than 0.27) | 27 | 22.50 |
| Medium (0.27-2.14) | 78 | 65.00 |
| High (More than 2.14) | 15 | 12.50 |
| Mass Media Exposure | ||
| Low (Less than 8.41) | 15 | 12.50 |
| Medium (8.41-11.11) | 97 | 80.83 |
| High (More than 11.11) | 8 | 6.67 |
| Economic Orientation | ||
| Low (Less than 5.05) | 26 | 21.67 |
| Medium (5.05-8.83) | 60 | 50.00 |
| High (More than 8.83) | 34 | 28.33 |
| Extension Contacts | ||
| Low (Less than 8.05) | 27 | 22.50 |
| Medium (8.05-10.88) | 56 | 46.67 |
| High (More than 10.88) | 37 | 30.83 |
Table text extracted from the original PDF; superscript letters are shown inline. The original table image is below.
View original table image
References
10 in the original paper- Ghosh A, Dey S. Socio-economic factors influencing the adoption of modern agricultural practices in Eastern India. Int. J Agric Manag. 2021;10(2):112-126.
- Jain S, Patel M. Analyzing the drivers of adoption for climate-resilient cotton varieties in South India. Clim. Smart Agric J. 2024;11(2):150-163.
- Kumar R, Singh V. Impact of extension services on adoption of improved cotton cultivation techniques in rural India. Agr Syst. 2020;178:102728.
- Mehta P, Sharma S. Assessment of adoption and impact of improved cotton varieties in Odisha. J Cotton Res. 2019;6(1):45-59.
- Patel R, Gupta R. Economic and environmental outcomes of adopting sustainable cotton farming practices. Environ Sci. Policy. 2023;131:123-132.
- Reddy KM, Rao KR. Farmers' adoption of innovative cotton cultivation techniques: A case study from Andhra Pradesh. Indian J Agric Sci. 2018;88(5):761768.
- Sahu S, Pradhan S. Factors affecting the adoption of modern farming techniques in tribal regions of Odisha. J Rural Stud. 2022;90:55-66.
- Singh A, Yadav N. The role of socio-economic characteristics in the adoption of cotton farming practices in India. J Crop Improvement. 2021;35(4):591-605.
- Srinivasan V, Rao M. Technological adoption in cotton farming: Insights from Odisha. Adv Agron. 2020;159:95-123.
- Verma S, Bhattacharya S. Influence of socio-economic factors on adoption of improved cotton cultivation practices in India. Agr Econ Res Rev. 2023;36(1):89101.