
Research article · 2024 · Full text
International Journal of Agriculture Extension and Social DevelopmentCosts and returns structure of farm enterprises and employment and income generation potential across farm enterprises
Volume 7(8) · Pages 553–560 · DOI: 10.33545/26180723.2024.v7.i8h.990 ↗
Research areasAgricultural Economics and Policy
Abstract
Author-writtenThis study investigates the costs and returns structure, employment generation potential, and income dynamics across various farming systems in the Kolar district, Karnataka, India. The primary data were collected from 30 sample farmers across the Malur and Kolar taluks. The study identified four predominant farming systems: Crop + Sheep (C + Sh), Crop + Dairy (C + D), Crop + Dairy + Horticulture (C + D + H), and Crop + Dairy + Sericulture (C + D + S). The age distribution of farmers showed that 70% were between 31 to 50 years old, reflecting significant farming experience. Education levels were generally low, with 33.35 per cent being illiterate, and 90 per cent of the farmers lived in nuclear families. The Crop + Dairy + Sericulture system yielded the highest net annual income at ?376,453, with sericulture contributing 57.72 per cent of this income. In contrast, the Crop + Sheep system had the lowest net annual income at ?109,755. Employment generation was also highest in the Crop + Dairy + Horticulture system, with 484 man-days and 466 woman-days of family labor. The analysis indicates that diversified farming systems incorporating multiple components like dairy, horticulture, and sericulture significantly enhance income and employment potential.
Summary
Source-checkedPlain-language reading of the full paper, prepared with AI and checked against the text. Each point links to the authors' own words.
Why it matters
- Crop diversification is considered a primary strategy for increasing farm income and improving food, nutrition, and ecological security while alleviating poverty. View evidence ↗
- Mixed farming systems that combine crops and livestock help reduce risk and vulnerability for poor farmers by providing a more flexible asset regime. View evidence ↗
- Horticulture is viewed as one of the most profitable farming activities due to its ability to generate significant employment and increase community income. View evidence ↗
The question
- The study aims to investigate the income dynamics, employment potential, and cost-return structures of different farming systems in the Kolar district of Karnataka, India. View evidence ↗
What they did
- Primary data was gathered via personal interviews using a structured schedule from 30 sample farmers, split equally between the Malur and Kolar taluks. View evidence ↗
- The research focused on four predominant farming systems: Crop + Sheep, Crop + Dairy, Crop + Dairy + Horticulture, and Crop + Dairy + Sericulture. View evidence ↗
- The data analyzed in the study pertains to the 2022-23 agricultural year. View evidence ↗
What they found
- The Crop + Dairy + Sericulture system was the most profitable, generating a net annual income of ₹376,453, with sericulture providing 57.72% of that total. View evidence ↗
- The Crop + Sheep system was the least profitable of the four, with a net annual income of ₹109,755. View evidence ↗
- The Crop + Dairy + Horticulture system generated the most family labor employment, totaling 484 man-days and 466 woman-days. View evidence ↗
- Within the dairy component, the highest net return per crossbred cow (₹1,01,160) was achieved in the Crop + Dairy + Horticulture system. View evidence ↗
- Among perennial crops, mango provided higher net returns (₹2,65,626/ha) compared to guava (₹1,15,136/ha). View evidence ↗
- The Crop + Dairy + Horticulture system required the most hired labor (166 man-days, 318 woman-days, 16 bullock days), followed by the Crop + Dairy + Sericulture system. View evidence ↗
What it means
- The authors conclude that integrating horticulture and sericulture with traditional crops creates higher income and employment opportunities in the Kolar district. View evidence ↗
- The authors recommend policies that encourage resource allocation and crop diversification to improve the sustainability and income of farms. View evidence ↗
- The authors state that future research should use a larger sample size and cover different agro-climatic zones to provide more comprehensive insights. View evidence ↗
Visual summary
3 visualsIllustrations explain the paper; charts are replotted from the paper's own table values.
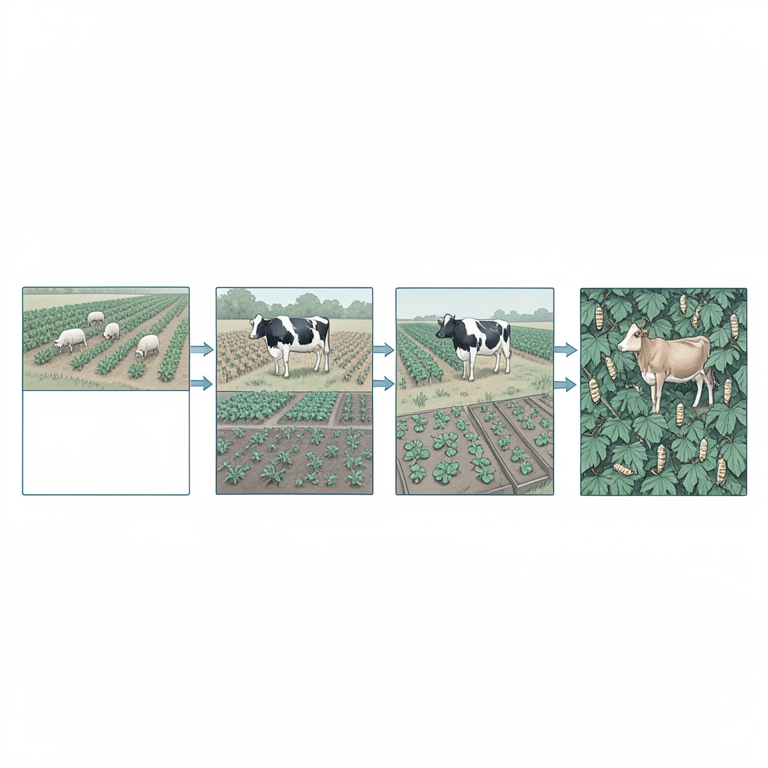
Income Comparison Across Systems
AI-generated conceptual illustration (integrated farming systems featuring crops, sheep, dairy cows, vegetables, and silkworms). It explains the idea and does not show study data.
View source evidence ↗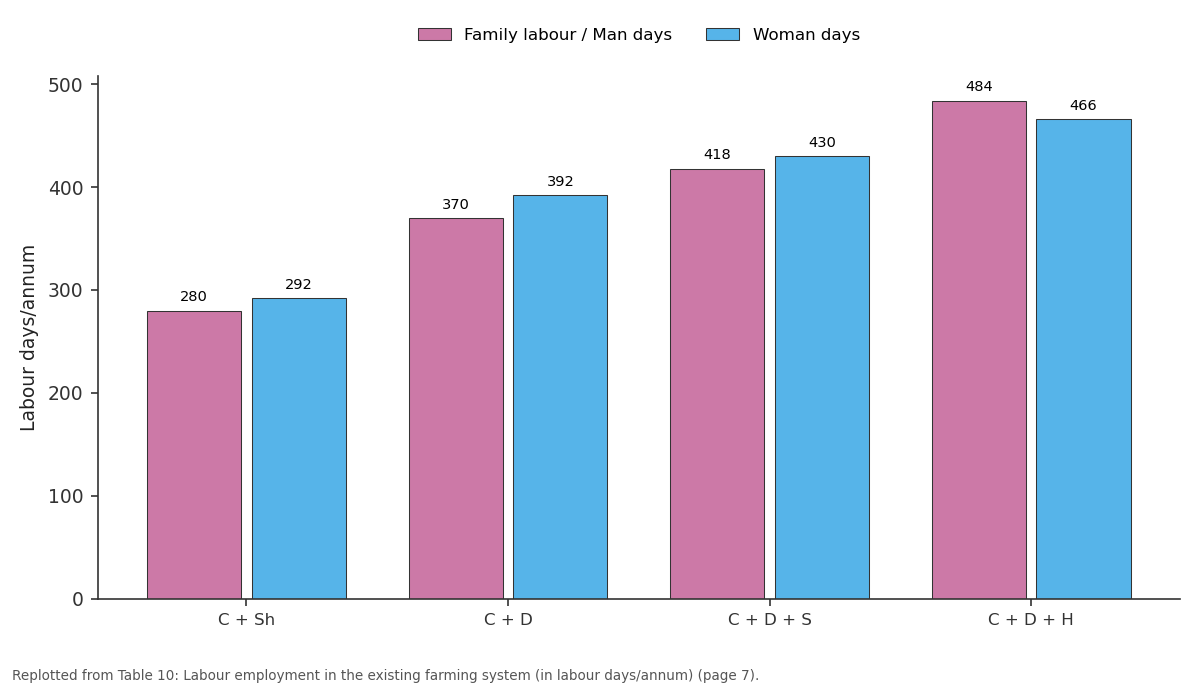
Family labour / Man days and Woman days: C + Sh vs C + D vs C + D + S vs C + D + H
Replotted from Table 10 (page 7) of the original paper. Every bar is the paper's own table value.
View source evidence ↗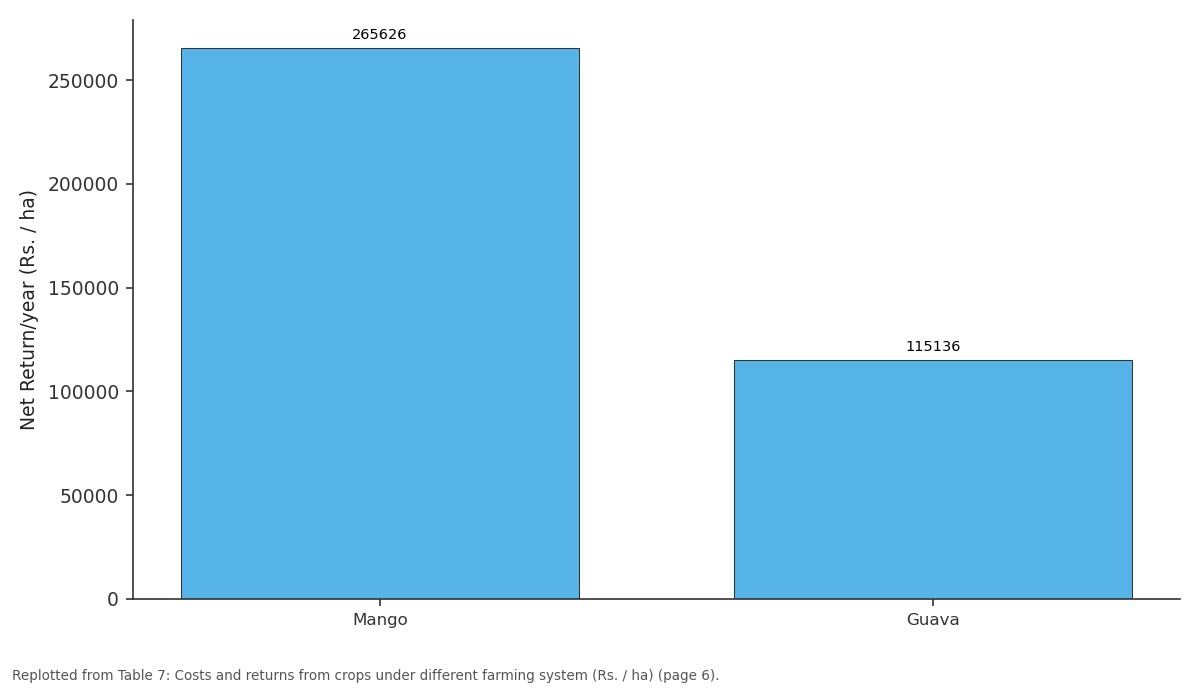
Net Return/year: Mango vs Guava
Replotted from Table 7 (page 6) of the original paper. Every bar is the paper's own table value.
View source evidence ↗Figures & tables
From the original paper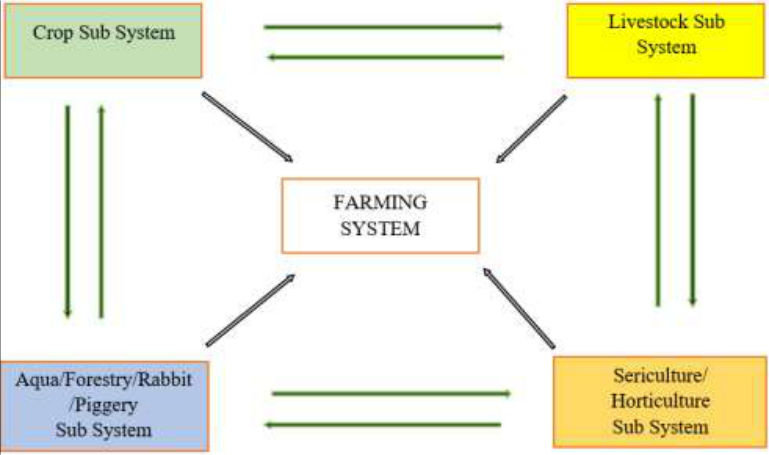 Figure 1
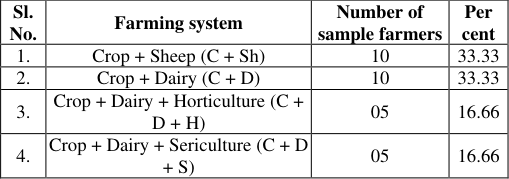 Table 2
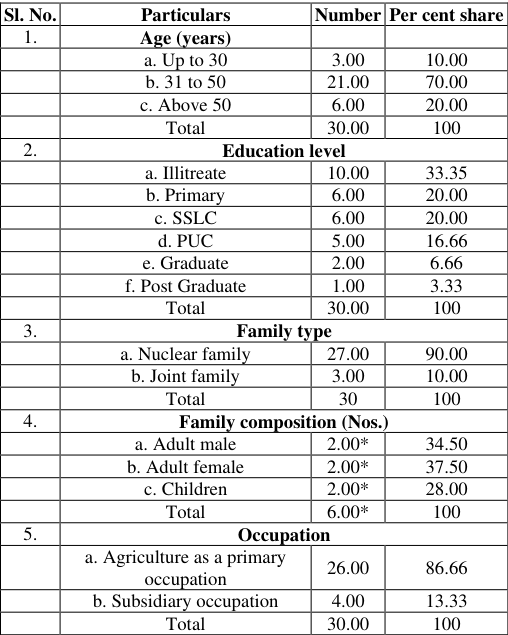 Table 1
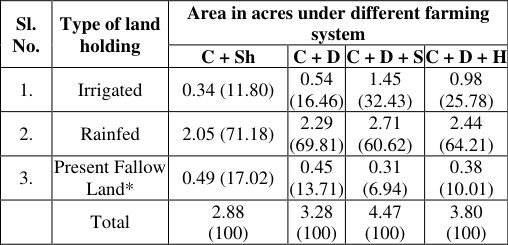 Table 3
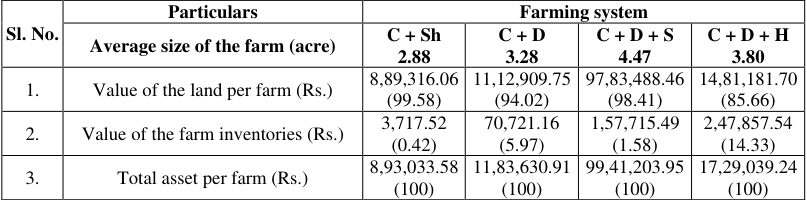 Table 4
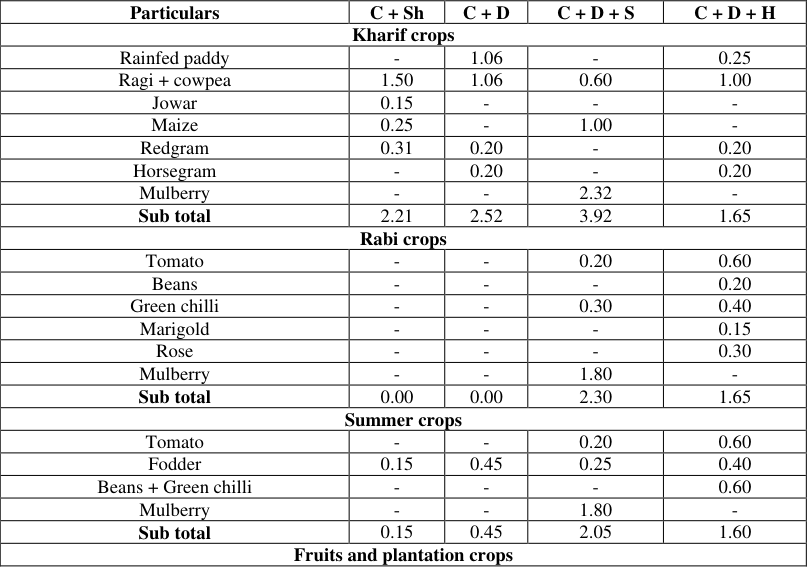 Table 5
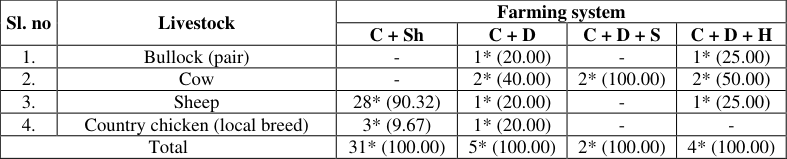 Table 6
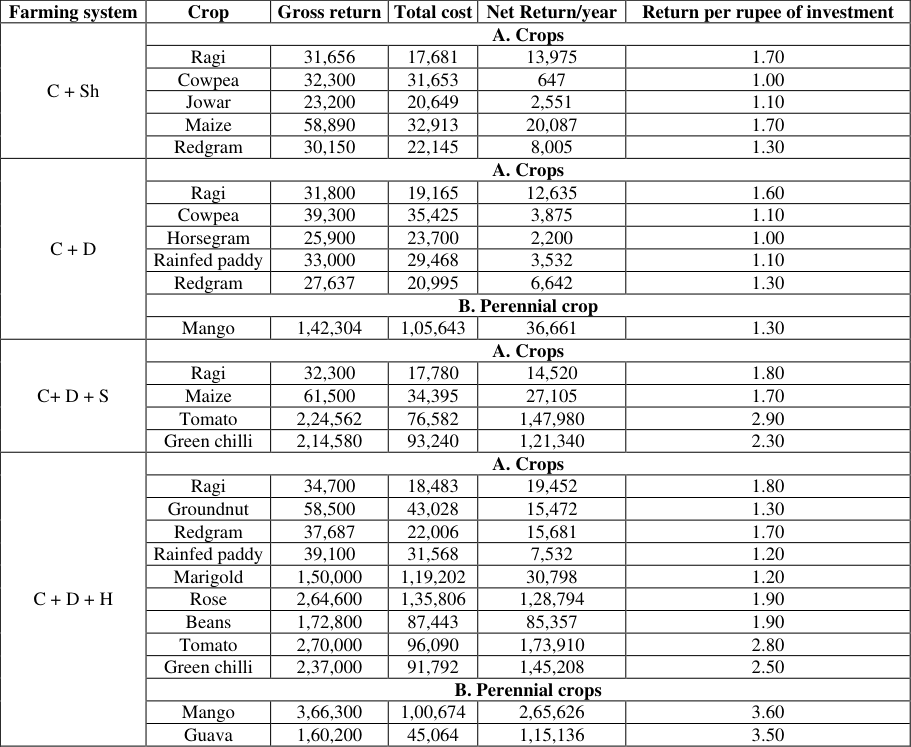 Table 7
 Table 8
 Table 9
 Table 10
Introduction
Agriculture continues to be a crucial sector in Indian economy that contributes about 18.8 per cent (2022) of the Gross Value Added. Traditional farming system followed by farmers in India are based on centuries of experiences characterised by mixed farming involving crop production with one or more enterprises like dairy, poultry, sericulture, sheep, goat, piggery, fisheries and bee-keeping. Crop diversification is one of the best options to increase farm income leading to food, nutrition and ecological security as well as poverty alleviation. Flexible cropping systems that feature production of more income elastic goods like horticultural products are a means of diversifying their income sources. Further the importance of diversification to value-added export-oriented crops was also emphasized. Indian agriculture boasts a remarkable profile, characterized by a substantial labour force. It holds the distinction of having the world's highest net cropped area and ranks second in terms of farm output on a global scale. India stands as the world's foremost livestock owner, with a staggering population of approximately 535.78 million animals. In the international arena, India claims the top spot for buffalo population, ranks second in the population of goats and fish, hosts the second-largest poultry market, and is fifth in the population of camels, which are experiencing a rapid growth rate according to the 2019 census (Anonymous 2019) [2] . The remarkable growth of Indian agriculture over the last five and half decades, that is, after the initiation of Green Revolution technologies, has assisted in an era of self-reliance in food grain production at 315.6 million tonnes in 2022-23 (Anonymous, 2023) [1] . A farming system is a natural resource management unit operated by a farm household, and includes the entire range of economic activities of the family members (on-farm, offfarm agricultural as well as off-farm non-agricultural activities) to ensure their physical survival as well as their social and economic well-being. A Farming System is defined as a complex interrelated matrix of soil, plants, animals, implements, power, labour, capital, and other inputs controlled in part by farming families and influenced to varying degrees by political, economic, institutional and social forces that operate at many levels. www.extensionjournal.com In the farming system as a whole, different cropping systems compete for scarce resources such as land, labour, and capital on the farm and also, they exhibit interdependence due to supplementary or complementary relationships. Thus, it is necessary to deal with the whole farm approach to minimize risk and increase production and profit. To bring this concept effectively into practice, it is necessary to understand the linkages and complementarities of different components in various farming system. The linkages and complementarities in farming system are shown in Fig. 1. Of late, farming system approach is given scientific touch to the existing practices and found ways and means to make it sustainable in changing global scenario. At an aggregate level, it is appropriate to study the farming system in relatively homogeneous agro-climatic regions in keeping with natural endowments and factors, which are normally not subject to change (Harishkumar, 2012) [6] . Along with agriculture, animal husbandry, and dairying activities have been an integral part of human life since the dawn of civilization. These two sectors have played significant socio-economic role in India due to favourable climate and topography. Livestock considered to be a valuable and critical asset of the rural poor in supporting their livelihoods particularly during unfavorable times. Mixed (crop-livestock) farming system provide flexible asset regime and reduce risk and vulnerability of the poor farmers. As per the 20th Livestock Census 2019 of India, the total livestock population was 536.76 million comprising of cattle (36.04 %), goats (27.74 %), buffaloes (20.47 %), sheep (13.83 %), and pigs (1.69 %). The total contribution of livestock sector at current prices was about Rs. 11,14,249/-crores (2020-21) which is 30.87 per cent of the GVA from agriculture and allied sector, and 6.17 per cent of the total GVA. More than 20.5 million workers are engaged in animal farming and about 87.7 per cent of the livestock is owned by farmers of marginal, small, and semi-medium operational holdings. The animal husbandry and dairy sector provides around 50 per cent of direct and indirect employment to women in the country which is the highest for any sector in the economy. Around 4.43 per cent of usually working persons were engaged in animal production, mixed farming, fishing and aquaculture during 2019-20. Horticulture is perhaps the most profitable venture of all farming activities as it provides ample employment opportunities and scope to raise the income of the farming community. It also has tremendous potential to push the overall agriculture growth to more than the targeted 4 per cent. Sericulture being a profitable venture, is practiced in many countries of the world under varied agro-climatic conditions with global raw silk production of 1,09,111.10 million tonnes (mt). The top five states in the country where sericulture is practiced are Karnataka (8,276 mt) followed by Andhra Pradesh (5,735 mt), West Bengal (1,587 mt), Tamil Nadu (1,548 mt) and Jharkhand (1,511 mt) (Anonymous, 2021) [4] .
Methodology
The primary data for the study was collected from 30 sample farmers from Kolar and Malur taluks of Kolar district (15 farmers from each taluk) through personal interview methods with the help of a pre-tested structured schedule. The four majorly practiced farm enterprises in the study area were Crop + Sheep (C + Sh), Crop + Dairy (C + D), Crop + Dairy + Horticulture (C + D + H), Crop + Dairy + Sericulture (C + D + S). The collected data pertains to the agricultural year 2022-23. The total costs were divided into two broad categories: Variable costs and Fixed costs, Variable costs are costs incurred on variable inputs such as cost of seeds/seedlings, farm yard manure (FYM), fertilizers, pesticides, human labour, machine and bullock labour, plant protection chemicals and interest on working capital. Fixed costs are those include depreciation on farm implements and machinery, rental value of land, land revenue and managerial cost and descriptive statistics such as mean and percentages were used for analyzing the data pertaining to the study. Total cost (TC): Total cost is the sum of total variable cost (TVC) and total fixed cost (TFC). 1. Gross returns (GR): Gross returns per acre were www.extensionjournal.com calculated by using below formula.
Gross Returns (GR) = Yield × Price 2. Net returns over variable costs: It is the gross returns minus variable costs. 3. Net returns over variable costs = GR -TVC 4. Net returns over cost of cultivation: It is the gross returns after deducting variable costs and fixed costs. 5. Net returns over cost of cultivation = GR -TC (TVC + TFC) 6. Returns per rupee of expenditure: Worked out by taking the ratio of gross return divided by total cost.
Results and Discussion
Results and Discussion
Socio-economic characteristics of sample farmers
The majority (70%) of the farmers were aged 31-50 years, reflecting significant farming experience and a strong tradition of agriculture and livestock rearing. Educationally, 33.35per cent were illiterate, with only 20 per cent reaching primary or SSLC levels, and a small percentage pursuing higher education. This high illiteracy rate, likely due to geographical and socio-economic factors, limits career options, often confining individuals to agriculture. Nuclear families dominated, with 90 per cent of the respondents living in such units, reflecting societal shifts towards privacy and independence. The average family size was six members, balancing household and farm responsibilities. Agriculture was the primary occupation for 86.66% of the farmers, emphasizing its critical role in the local economy, while 13.33% viewed it as a secondary occupation. This reliance on agriculture stems from economic necessity, limited job opportunities, and the seasonal nature of farming, prompting some to diversify their income sources. Overall, the study reveals a community deeply rooted in agriculture, facing educational challenges, and increasingly adopting nuclear family structures.
Farming system of sample farm households
The study identified various farming systems in the area, including crops, dairy, sheep, goat, horticulture, sericulture, poultry, piggery, fishery, rabbit rearing, and forestry. Among these, crops were the predominant component, followed by dairy and horticulture. The choice of components depends on factors such as farmland type, location, soil fertility, irrigation access, labor availability, capital, and family preferences. Crops play a crucial role in providing year-round sustenance and income, leading farmers to integrate other components like dairy and horticulture for a diversified and stable livelihood. The main farming systems practiced are detailed in Table 2.
| Sl. No. | Farming system | Number of sample farmers | Per cent |
|---|---|---|---|
| 1. | Crop + Sheep (C + Sh) | 10 | 33.33 |
| 2. | Crop + Dairy (C + D) | 10 | 33.33 |
| 3. | Crop + Dairy + Horticulture (C + D + H) | 05 | 16.66 |
| 4. | Crop + Dairy + Sericulture (C + D + S) | 05 | 16.66 |
Table text extracted from the original PDF; superscript letters are shown inline. The original table image is below.
View original table image
Land holding pattern of farm households
The Table 3 depicts the land holding pattern of the farm households in the study area. The average land holding was found to be high with 4.47 acres in C + D + S farming system followed by C + D + H with 3.80 acres, C + D with 3.28 acres and C + Sh with 2.88 acres. The distribution of operational land holdings was highly skewed between irrigated and rainfed holdings with majority of the farm being under rainfed. Kolar district has less average land holding in all the farming system. The geographical area of Kolar district is 69,210 hectares of which less than 50 per cent of the land was under irrigated condition compared to other districts in the state. Kolar district comes under the Eastern dry zone of Karnataka where water supplementation from upper catchment is not available, and this information is on par with the results of research done by Harishkumar (2012) [6] . Most of the crops grown by farmers are rainfed while a www.extensionjournal.com small percentage of land was found to be occupied by paddy, mainly grown for household consumption. The important crops grown under rainfed are finger millet, maize, jowar, redgram, cowpea, groundnut, horsegram. Fallow land is the resultant of subdivision and fragmentation of land holdings in the study area.
Farm assets of farm households
The farm assets owned by farmers is presented in Table 4. It was observed that the value of land per acre was found to be highest in C + D + S (₹ 97,83,488.46 /-) farming system followed by C + D + H (₹ 14,81,181.70/-) farming system. This is due to location of the farm land which is very near to the urban areas of Kolar and Malur taluks. The average size of the farm in C + D + S was found to be 4.47 acres and in 3.80 acres in the case of C + D + H farming system. It has been observed that investment on farm inventories (sheds, carts, farm implements, pump set, drip pipelines and machinery) was higher in case of C + D + H (₹ 2,47,857.54/-) farming system in comparison to other three farming system. Crop, dairy and horticultural activities involves use of various equipments and tools as they are labor-intensive in nature.
The investment on total fixed assets was found to be less in case of C + Sh (₹ 8,93,033.58/-) farming system mainly because of less use of implements and machinery. Interestingly contribution of value of farm inventories was found to be highest in C + D + H farming system having a share of 14 per cent in total in comparison to other farming system. The non-land farm assets are machinery tools and equipments which are used for agricultural work. Vegetables and flowers viz., tomato (0.6 acre), beans (0.2 acre), green chilli (0.4 acre), marigold (0.15 acre) and rose (0.30 acre). Fruits and plantation include mango (0.60 acre) and guava (0.20 acre) with the gross cultivated area of 3.62 acres. The net cropped area and cropping intensity of different farming system was found to be higher in C+ D + H farming system, it was due to crops like tomato, green chilli and beans grown in two season and plantation crops like mango and guava round the year in the study area. The result was on par with the research conducted by Vanitha (2016).
Livestock possession by farm households
The details of livestock possession of farmers in different farming system are presented in Table 6. C + Sh farmers maintained 28 sheep and reared three country chicken/poultry fowls. While C + D, C + D + H farmers maintained one bullock pair for cultivation purpose and minimum one cross breed cow for converting low valued by products i.e., fodder into high-valued product i.e., milk. This result is similar to the study conducted by Harishkumar, (2012) [6] in Kolar district.
| Sl. no | Livestock | Farming system | — | — | — |
|---|---|---|---|---|---|
| C + Sh | C + D | C + D + S | C + D + H | ||
| 1. | Bullock (pair) | - | 1* (20.00) | - | 1* (25.00) |
| 2. | Cow | - | 2* (40.00) | 2* (100.00) | 2* (50.00) |
| 3. | Sheep | 28* (90.32) | 1* (20.00) | - | 1* (25.00) |
| 4. | Country chicken (local breed) | 3* (9.67) | 1* (20.00) | - | - |
| Total | 31* (100.00) | 5* (100.00) | 2* (100.00) | 4* (100.00) |
Table text extracted from the original PDF; superscript letters are shown inline. The original table image is below.
View original table image
Costs and returns of different farming system
Costs and returns structure of different crops and subsidiary enterprises practiced by farm households under the different farming system are detailed in appendix and same is discussed. Economics of the crops are influenced by both endogenous and exogenous factors viz., market prices, government policies, resources availability, proximity to market, market intermediaries etc. Relative economics of annual and perennial crops grown under different farming system in Kolar district is presented in Table 7. Net return and return per rupee of investment was found to be highest in maize in C + Sh farming system as it requires less labour and inputs (details given in appendix 1) compared with the other cops like ragi, paddy and redgram. In case of C + D farming system, ragi played an important role in generating high net income and return per rupee of investment. As maize and ragi are rainfed crops and require lesser expenditure compared to other crops and the output value realization being high resulted in higher net returns. This result is contradictory to the research results of Harishkumar, (2012) [6] with net returns of ragi being very less in all the farming system. However, ragi provided nutritious home consumption diet to farmers and maize acted as an ideal fodder crop for livestock. The marketable surplus of ragi and maize improved the returns to farmers as it is associated with MSP notified for ragi by the government which improved marketability and price of the produce. In C + D + S farming system, tomato fetched highest net return (₹ 147980/ha) among all other crops like ragi (₹ 14520/ha), maize (₹ 27105/ha) and green chilli (₹ 121340/ha) and in case of C+ D + H farming system, net return and return per rupee of investment in field crops were found to be highest with ₹19452/ha and 1.8 respectively, in ragi than groundnut (₹ 15472/ha and 1.3), redgram (₹ 15681/ha and 1.7) and rainfed paddy (₹ 7532/ha and 1.2). However, in the case of vegetables and flowers, tomato brought highest net income (₹ 1,73,910/ha) and return per rupee of investment (2.8). Among the perennial crops, net returns obtained from mango (₹ 2,65,626/ha) was more than guava (₹ 1,15,136/ha). The crops like ragi, cowpea, maize, horsegram, tomato and beans are the important crops grown in both the taluks Kolar and Malur but the return generated from the crops was found to vary between the farming system. This was due to the impact of availability of inputs and its utilization, accessibility of market and time of sale of the crops.
| Farming system | Crop | Gross return | Total cost | Net Return/year | Return per rupee of investment |
|---|---|---|---|---|---|
| C + Sh | A. Crops | ||||
| Ragi | 31,656 | 17,681 | 13,975 | 1.70 | |
| Cowpea | 32,300 | 31,653 | 647 | 1.00 | |
| Jowar | 23,200 | 20,649 | 2,551 | 1.10 | |
| Maize | 58,890 | 32,913 | 20,087 | 1.70 | |
| Redgram | 30,150 | 22,145 | 8,005 | 1.30 | |
| C + D | A. Crops | ||||
| Ragi | 31,800 | 19,165 | 12,635 | 1.60 | |
| Cowpea | 39,300 | 35,425 | 3,875 | 1.10 | |
| Horsegram | 25,900 | 23,700 | 2,200 | 1.00 | |
| Rainfed paddy | 33,000 | 29,468 | 3,532 | 1.10 | |
| Redgram | 27,637 | 20,995 | 6,642 | 1.30 | |
| B. Perennial crop | |||||
| Mango | 1,42,304 | 1,05,643 | 36,661 | 1.30 | |
| C+ D + S | A. Crops | ||||
| Ragi | 32,300 | 17,780 | 14,520 | 1.80 | |
| Maize | 61,500 | 34,395 | 27,105 | 1.70 | |
| Tomato | 2,24,562 | 76,582 | 1,47,980 | 2.90 | |
| Green chilli | 2,14,580 | 93,240 | 1,21,340 | 2.30 | |
| C + D + H | A. Crops | ||||
| Ragi | 34,700 | 18,483 | 19,452 | 1.80 | |
| Groundnut | 58,500 | 43,028 | 15,472 | 1.30 | |
| Redgram | 37,687 | 22,006 | 15,681 | 1.70 | |
| Rainfed paddy | 39,100 | 31,568 | 7,532 | 1.20 | |
| Marigold | 1,50,000 | 1,19,202 | 30,798 | 1.20 | |
| Rose | 2,64,600 | 1,35,806 | 1,28,794 | 1.90 | |
| Beans | 1,72,800 | 87,443 | 85,357 | 1.90 | |
| Tomato | 2,70,000 | 96,090 | 1,73,910 | 2.80 | |
| Green chilli | 2,37,000 | 91,792 | 1,45,208 | 2.50 | |
| B. Perennial crops | |||||
| Mango | 3,66,300 | 1,00,674 | 2,65,626 | 3.60 | |
| Guava | 1,60,200 | 45,064 | 1,15,136 | 3.50 |
Table text extracted from the original PDF; superscript letters are shown inline. The original table image is below.
View original table image
Costs and returns of enterprises other than crops
Cost and return structure of other components other than crops under different farming system was depicted in Table 7. Dairy was one of the major components practiced by C + D, C + D + H, and C + D + S farming system. In dairy, feed cost and labour wages added more to the total cost. The net return per crossbred cow was found to be highest at ₹1,01,160/in C + D + H farming system. [5] have reported that the expenditure on feed and fodder followed by veterinary care.
Net farm income and employment generation across the farming system
The details of annual farm household income among major farming system derived from various sources has been discussed in the Table 9, C + D + S farmers obtained a maximum net annual income of Rs. 3,76,453/-of which 57.72 per cent was sourced from sericulture and 36.19 per cent from livestock and only four per cent from crop due to the lower value crops grown by the farmers. As most of the area under this farming system is under irrigation, farmers could allocate more land to mulberry cultivation which fetches high income. As a result, the net annual income was www.extensionjournal.com found to be more in C+ D + S farm and this result is on par with the findings of research conducted by Harishkumar et al., (2016) [7] . The C + Sh based farming system was found to be have less annual farm income of Rs. 1,09,755/-among other farming system due to smaller land holdings and practice of same cropping pattern over the years. The research conducted by Kumar et al., (2019) [8] revealed that there was a wide variation in the source and magnitude of household income among the identified farming system. However, the farming system which is comprised of crop and livestock contributed a major share accounting for more than 30 per cent of the total family income in all the farming system and has become source of sustainable income for the farmers as revealed by the research conducted by the Rao et al., (2017) [10] .
| Sl. No. | Farming system | Crop | Livestock | Sericulture | Non-farm income* | Total |
|---|---|---|---|---|---|---|
| 1. | C + Sh | 13,256 (12.07) | 74,549 (67.92) | - | 21,950 (19.99) | 1,09,755 (100) |
| 2. | C + D + S | 18,332 (4.86) | 1,36,245 (36.19) | 2,17,316 (57.72) | 4,560 (1.21) | 3,76,453 (100) |
| 3. | C + D | 16,032 (7.74) | 1,52,184 (73.55) | - | 38,690 (18.69) | 2,06,906 (100) |
| 4. | C + D + H | 1,08,953 (45.19) | 1,13,152 (46.93) | - | 18,984 (7.87) | 2,41,089 (100) |
Table text extracted from the original PDF; superscript letters are shown inline. The original table image is below.
View original table image
Employment generation across farming system
The details of employment under various farming system generated for human as well as bullock labour is presented in the Table 10. Under the existing farming system, C + D + H farming system provided maximum employment of 484 man days, 466 woman days and 130 bullock days under family labour followed by C + D + S with 418 man days, 430 woman days, 102 bullock days, C + D farming system with the employment generation of 370 man days, 392 woman days, 110 bullock days and C + Sh farming system with employment generation of 280 man days, 292 woman days, 90 bullock days. The varying employment is attributed to several factors including the nature of the agricultural activities involved, the scale of production, and the labour requirements of each enterprise. The farming system that include dairy and horticultural farming being more labour-intensive than those focused solely on crop cultivation and sheep rearing. The findings of the research study are in line with that of previous study conducted by Singh et al. (2009) in Uttar Pradesh which revealed that the vegetable-based farming system provided the highest employment (572 mandays/year), followed by sugarcane-based farming system (447 mandays/ year). The employment was lowest in the livestock-based farming system (243 mandays/ year). On an average, a farmer household got employment only for 404 mandays/year/farm. The differences in employment generation between family labor and hired labor can be attributed to factors such as skill, cost, seasonality, and the specific nature of tasks in each farming system. Farmers often use a combination of family and hired labor to optimize their operations based on these factors and their specific circumstances. Farmers may choose different combinations of enterprises based on their resources, skills, and market demands, which can impact employment patterns on their farms. Hence, the null hypothesis "Small size of land holding is reducing the employment and income across farm enterprises and vegetable farming generates more employment and income in comparison to other crop and livestock enterprises" has been accepted.
| Sl. No. | Farm enterprises | Family labour | — | — | Hired labour | — | — | Total |
|---|---|---|---|---|---|---|---|---|
| Man days | Woman days | Bullock Pair | Man days | Woman days | Bullock Pair | |||
| 1. | C + Sh | 280 | 292 | 90 | 52 | 68 | 0 | 782 |
| 2. | C + D | 370 | 392 | 110 | 130 | 246 | 0 | 1,248 |
| 3. | C + D + S | 418 | 430 | 102 | 154 | 282 | 22 | 1,408 |
| 4. | C + D + H | 484 | 466 | 130 | 166 | 318 | 16 | 1,580 |
Table text extracted from the original PDF; superscript letters are shown inline. The original table image is below.
View original table image
Conclusion
The study concludes that diversified farming systems, particularly those integrating sericulture and horticulture with traditional crops, offer higher income and employment opportunities in the Kolar district. The Crop + Dairy + Sericulture system is notably the most profitable, providing the highest net annual income, while the Crop + Sheep system remains the least profitable. The study also highlights the importance of education and access to resources in influencing farming choices and outcomes. The findings support the null hypothesis that smaller land holdings reduce employment and income, and vegetable farming generates more employment compared to other crop and livestock enterprises. This emphasizes the need for policies encouraging crop diversification and resource allocation to enhance farm incomes and sustainability.
Future Scope of Work
Future research should explore the long-term sustainability of the identified farming systems, particularly under changing climatic conditions and market fluctuations. There is also scope for investigating the role of technology adoption in improving productivity and income across these farming systems. Further studies could examine the impact of government policies and subsidies on farming choices and outcomes in the region. Additionally, the influence of farmer education and skill development on the adoption of high-value crops and diversified farming systems warrants deeper analysis. Expanding the study to include a larger sample size and different agro-climatic zones could provide more comprehensive insights into the effectiveness of various farming systems. Finally, exploring the potential of integrating renewable energy sources into these farming systems could offer new avenues for reducing costs and increasing profitability.
Figures and tables from the paper
| Sl. No. | Particulars | Number | Per cent share |
|---|---|---|---|
| 1. | Age (years) | ||
| a. Up to 30 | 3.00 | 10.00 | |
| b. 31 to 50 | 21.00 | 70.00 | |
| c. Above 50 | 6.00 | 20.00 | |
| Total | 30.00 | 100 | |
| 2. | Education level | ||
| a. Illitreate | 10.00 | 33.35 | |
| b. Primary | 6.00 | 20.00 | |
| c. SSLC | 6.00 | 20.00 | |
| d. PUC | 5.00 | 16.66 | |
| e. Graduate | 2.00 | 6.66 | |
| f. Post Graduate | 1.00 | 3.33 | |
| Total | 30.00 | 100 | |
| 3. | Family type | ||
| a. Nuclear family | 27.00 | 90.00 | |
| b. Joint family | 3.00 | 10.00 | |
| Total | 30 | 100 | |
| 4. | Family composition (Nos.) | ||
| a. Adult male | 2.00* | 34.50 | |
| b. Adult female | 2.00* | 37.50 | |
| c. Children | 2.00* | 28.00 | |
| Total | 6.00* | 100 | |
| 5. | Occupation | ||
| a. Agriculture as a primary occupation | 26.00 | 86.66 | |
| b. Subsidiary occupation | 4.00 | 13.33 | |
| Total | 30.00 | 100 |
Table text extracted from the original PDF; superscript letters are shown inline. The original table image is below.
View original table image
| Particulars | C + Sh | C + D | C + D + S | C + D + H |
|---|---|---|---|---|
| Kharif crops | ||||
| Rainfed paddy | - | 1.06 | - | 0.25 |
| Ragi + cowpea | 1.50 | 1.06 | 0.60 | 1.00 |
| Jowar | 0.15 | - | - | - |
| Maize | 0.25 | - | 1.00 | - |
| Redgram | 0.31 | 0.20 | - | 0.20 |
| Horsegram | - | 0.20 | - | 0.20 |
| Mulberry | - | - | 2.32 | - |
| Sub total | 2.21 | 2.52 | 3.92 | 1.65 |
| Rabi crops | ||||
| Tomato | - | - | 0.20 | 0.60 |
| Beans | - | - | - | 0.20 |
| Green chilli | - | - | 0.30 | 0.40 |
| Marigold | - | - | - | 0.15 |
| Rose | - | - | - | 0.30 |
| Mulberry | - | - | 1.80 | - |
| Sub total | 0.00 | 0.00 | 2.30 | 1.65 |
| Summer crops | ||||
| Tomato | - | - | 0.20 | 0.60 |
| Fodder | 0.15 | 0.45 | 0.25 | 0.40 |
| Beans + Green chilli | - | - | - | 0.60 |
| Mulberry | - | - | 1.80 | - |
| Sub total | 0.15 | 0.45 | 2.05 | 1.60 |
| Fruits and plantation crops |
Table text extracted from the original PDF; superscript letters are shown inline. The original table image is below.
View original table image
| Sl. No. | Farming system | Subsidiary enterprises | Gross return | Total cost | Net return/year | Return per rupee of investment |
|---|---|---|---|---|---|---|
| 1. | C + Sh | Sheep* | 70,980 | 49,950 | 65,958 | 1.42 |
| 2. | C + D | Dairy ** | 1,42,530 | 41,970 | 1,00,560 | 3.40 |
| 3. | C + D + H | Dairy** | 1,41,910 | 40,750 | 1,01,160 | 3.40 |
| 4. | C + D + S | Dairy** | 1,43,400 | 42,790 | 1,00,610 | 3.35 |
| 5. | C + D + S | Sericulture*** | 90,118 | 58,235 | 71,883 | 1.54 |
Table text extracted from the original PDF; superscript letters are shown inline. The original table image is below.
View original table image
References
11 in the original paper- Anonymous. PIB.gov.in; c2023 [cited 2024 Aug 31]. Available from: https://pib.gov.in
- FAOSTAT [cited 2019]. Available from: https://www.faostat.fao.org
- Anonymous. Agriculture statistics [Internet]. Indiastat [cited 2019]. Available from: https://www.indiastat.com
- Anonymous. Annual report [Internet]. CSB [cited 2021]. Available from: http://csb.gov.in/publications/annual-report
- Datta AK, Haider MZ, Ghosh SK. Economic analysis of dairy farming in Bangladesh. Trop Anim Health Prod. 2019;51:55-64.
- Harishkumar HV, Umesh KB, Kumar MS, Murali DN. Livelihood security of farm households under different farming systems in Kolar district of Karnataka-An economic analysis. Int J Agric Environ Biotechnol. 2016;9(2):313.
- Kumar AJAY, Yadav Sumita MK, Rohila AK. Constraints faced by the farmers in production and marketing of vegetables in Haryana. Indian J Agric Sci. 2019;89(1):153-160.
- Kumar P, Singh NP, Mathur VC. Sustainable agriculture and rural livelihoods: A synthesis. Agric Econ Res Rev. 2006;19:1-22.
- Rao CA, Raju BMK, Samuel J, Dupdal R, Reddy PS, Reddy DY, Ravindranath E, Rajeshwar M, Rao CS. Economic analysis of farming systems: Capturing the systemic aspects. Agric Econ Res Rev. 2017;30(1):3745.
- Singh SP, Gangwar B, Singh MP. Economics of farming systems in Uttar Pradesh. Agric Econ Res Rev. 2009;22(1):129-138.
- Torane VR, Naik BK, Kulkarni VS, Talathi JM. Farming systems diversification in North Konkan region of Maharashtra -An economic analysis. Agric Econ Res Rev. 2011;24:91-98.