
Research article · 2024 · Full text
International Journal of Agriculture Extension and Social DevelopmentIncome, employment and expenditure pattern of different farmers and income groups: Research conducted in West Bengal's Bardhaman district
Volume 7(8) · Pages 393–396 · DOI: 10.33545/26180723.2024.v7.i8f.954 ↗
Research areasAgricultural Economics and PracticesAgricultural risk and resilience
Abstract
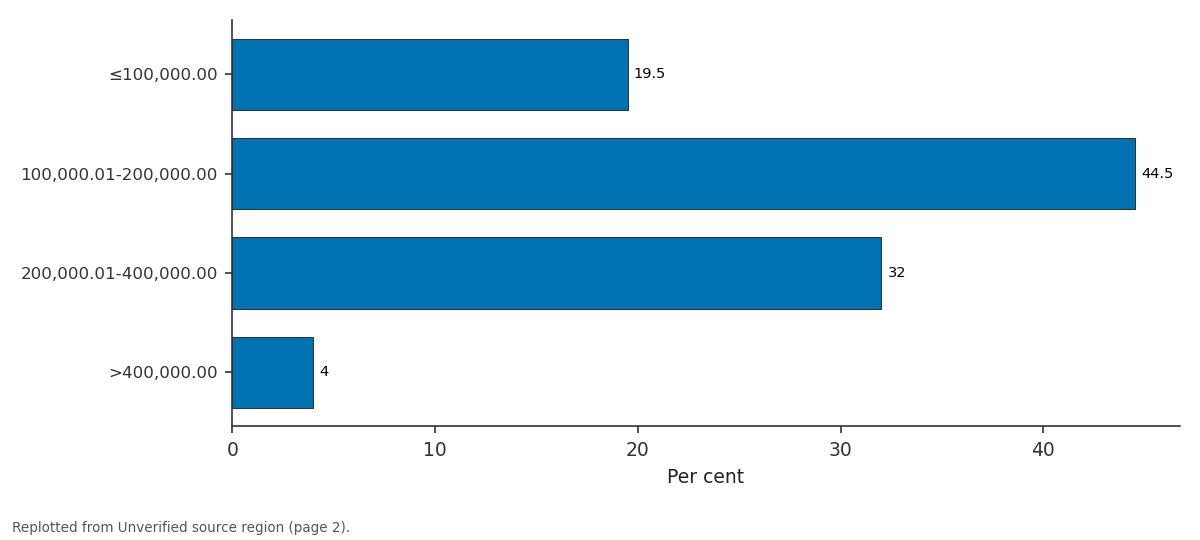
Author-writtenDue to the concentration of income in a small number of families, there is some skewness in the distribution of income in the sample. Merely 4% of the populace earns more than Rs. 400000 annually and most of the population near about 45% have income level below Rs.100000/year. The reason behind low level income generation due to low level of employment generation. Within the research region, 37.08 percent of all family members are employed. Thus, higher numbers of people are totally dependent on others. So, here, very important analysis is required that is consumption patterns of the households which will be helpful for the analysis of savings-expenditure patterns. We, know that basic need of the household is food, cloth and shelters. Lower income group households fail to save their earning or very negligible savings. They almost use all of their earnings. There are two types of consumption food consumption and non-food consumption. This study reveals how consumption pattern for different categories is changed with the changes of income.
Summary
Source-checkedPlain-language reading of the full paper, prepared with AI and checked against the text. Each point links to the authors' own words.
Why it matters
- Agriculture is vital for India's overall economic expansion because a large portion of the population depends on it for food security and employment. View evidence ↗
- Analyzing purchasing patterns is important because they reflect changes in life quality, which is a primary measure of economic growth. View evidence ↗
- Low-income households often struggle to save money, typically spending nearly all of their earnings on basic needs. View evidence ↗
The question
- The study aims to determine how consumption patterns across different categories change as income levels vary. View evidence ↗
What they did
- A total of 200 farmers were selected using the Simple Random Technique Without Replacement Method. View evidence ↗
- Data analysis involved calculating average means, ratios, cost of cultivation, returns from various sources, and using simple tabular percentage calculations. View evidence ↗
What they found
- Only 37.08% of all family members in the sample are earning members, resulting in an earner-to-dependent ratio of 1:1.70. View evidence ↗
- Income distribution is skewed, with only 4% of households earning more than Rs. 400,000 annually, while 19.50% earn less than Rs. 100,000. View evidence ↗
- The lowest income group (average income Rs. 79,210.71) spends 43.47% of their total consumption expenditure on food. View evidence ↗
- In the highest income group (average income Rs. 440,246.79), food items account for only 25.62% of total consumption. View evidence ↗
- As income levels increase, the proportion of spending on food decreases while the proportion spent on non-food items increases. View evidence ↗
What it means
- The authors conclude that there is an inverse relationship between wealth and the propensity to consume food products, and a direct relationship with non-food products. View evidence ↗
- The authors state that the willingness to save is directly correlated with income and inversely correlated with consumption spending. View evidence ↗
Visual summary
2 visualsIllustrations explain the paper; charts are replotted from the paper's own table values.
Per cent: ≤100,000.00 vs 100,000.01-200,000.00 vs 200,000.01-400,000.00 vs >400,000.00
Replotted from a table (page 2) of the original paper. Every bar is the paper's own table value.
View source evidence ↗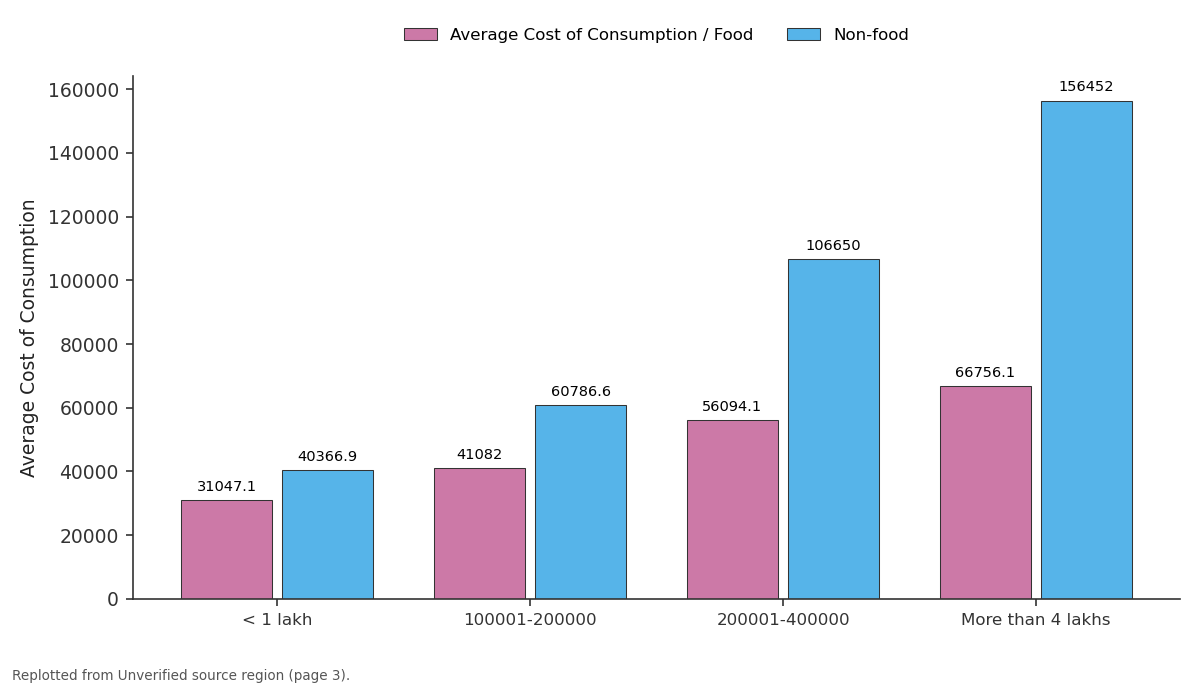
Average Cost of Consumption / Food and Non-food: < 1 lakh vs 100001-200000 vs 200001-400000 vs More than 4 lakhs
Replotted from a table (page 3) of the original paper. Every bar is the paper's own table value.
View source evidence ↗Figures & tables
From the original paper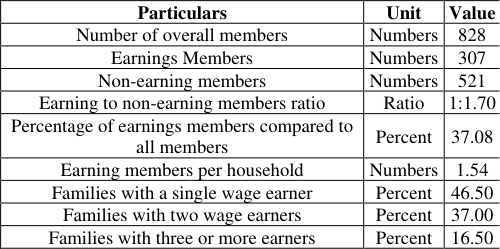 Table 1
 Table 3
Introduction
For the previous few years, the agricultural sector's percentage contribution to India's GDP has been about 15%, and it is steadily. Although agriculture's share of the GDP is decreasing, it still contributes significantly to the Indian economy, employing 45.76% of the labour force [2] and having a positive ripple effect on the non-agricultural sector's economy due to its forward and backward linkage. The bulk of the people in the nation relies on agriculture to provide both employment and food security, therefore inclusive growth in this sector is crucial to the overall expansion of the Indian economy [3] . A quicker and more inclusive sustainable growth rate is contingent upon agricultural development, according to the 12 th Five Year Plan Approach. Real development and growth that is shared by all segments of the population-has not occurred in our nation. Poverty, unemployment, unequal access to healthcare, education, and other essential services are among the issues we face. Inequitable Our economy is also characterized by sectoral expansion [4] . Services drove the expansion that followed the reform. Compared to the 1980s, not much has been developed in the commodity sector expansion (agricultural and industry). The agriculture sector, which had growth of less than 2% annually from the mid-1990s to the mid-2000s, is a cause for particular concern [5] . Concerns about livelihoods and food security are also quite important. Increased life quality is a key measure of economic growth, and as life quality increases, so should purchasing patterns, demonstrating the importance of this relationship. The characteristics of the consumption budget make the household's welfare level quite evident. With their limited revenue stream, it is expected of small and marginal farmers to spend most of their income on consumption.
Materials and Methods
For the present investigation four blocks of Purba Bardhaman district named Andal, Kalna-I, Katwa-I and Kalna-I were selected purposively. Fifty farmers from each block were selected and interviewed. Farmers are selected by Simple Random Technique Without Replacement Method (SRTWRM). To analyse the result simple tabular percentage calculation, comparisons, different ratios, average mean, cost of cultivation, returns from different sources and income were calculated. A total of 200 farmers were selected for research of the study. In order to calculate the cost of cultivation and returns of different crops in the locale of research the method used by Esar and Sachdeva (2023) was adopted [6] .
Income and employment options on the farm
The following calculations were used to determine the farmers' or producers' return on income: 1. Yield times average selling price equals gross return.
The weighted average of the prices at which the produce has been sold is the average selling price.
The structure of income and expenses
The per capita income, per capita consumption, consumption income ratio, average income, and average consumption expenditure have all been examined in order to meet the goals of earnings and family spending habits.
To get a more accurate comparison, the employment and scope of employment patterns, in addition to the consumption habits of medium-and large-sized farmers in the study region, which have also been examined and contrasted.
Results and Discussion
Table 1 indicates that with 828 members overall, 307 of them are income earners, meaning that earners to nonearning dependents are distributed 1:1.70. There are just 1.54 earning members per family. The number of household wage earners influences the family's income level to some amount. More earning members will affect the income distribution and, in turn, the pattern of consumption in rural areas where employment opportunities are few and pay rates are lower. Due to the concentration of income in a small number of families, the sample's income distribution is a little skewed. Table 2 shows that in terms of annual family income, just 4% earn more than Rs. 400000.00. The annual income of 19.50 percent of households is less than Rs 100,000.00. The majority of households, or 44.50 percent, have an annual income between Rs. 100000.01 and Rs. 200000.00, while the remaining 32.0 percent have an income between Rs. 200000.01 and Rs. 400000.00. Household consumption patterns change with income. The lower income groups typically have a propensity to spend more than they make. Many households have poor incomes, which may prevent them from meeting all of their demands. They either take out loans or sell assets they already own to make up the difference between their excess expenditure and income. Table 4 displays the average annual income of the various income categories together with their consumption spending. When comparing the average revenue and consumption expenditures of various income level for both food and nonfood products, it is evident that the APC is greater for lower income level than for higher income ones. At an income per household of Rs. 79210.71 and an average total consumption of Rs. 71414.07, the consumption-income ratio of lowest level of income group is 0.90. 43.47 percent of consumption expenditures go toward food, with the remaining portion going toward non-food products.
| Particulars | Unit | Value |
|---|---|---|
| Number of overall members | Numbers | 828 |
| Earnings Members | Numbers | 307 |
| Non-earning members | Numbers | 521 |
| Earning to non-earning members ratio | Ratio | 1:1.70 |
| Percentage of earnings members compared to all members | Percent | 37.08 |
| Earning members per household | Numbers | 1.54 |
| Families with a single wage earner | Percent | 46.50 |
| Families with two wage earners | Percent | 37.00 |
| Families with three or more earners | Percent | 16.50 |
Table text extracted from the original PDF; superscript letters are shown inline. The original table image is below.
View original table image
Discussion
In the study titled "Beyond Consumption Expenditure: Income Inequality and Its Sources in India," Agrawal and Agrawal (2022) noted that much of the existing research on inequality in India has primarily addressed consumption inequality. Their analysis compares inequality in both consumption expenditure and income. They found that income inequality experienced a slight increase, while consumption expenditure inequality remained unchanged. Additionally, their study broke down income inequality by its sources, revealing that wage and agricultural incomes are the main contributors to inequality in rural areas, whereas in urban areas, wage and business incomes are the principal factors driving inequality [7] . Similar results were identified in the present study that the sample's income distribution is a little skewed. In terms of annual family income, just 4% earn more than Rs. 4 lakhs per annum.
In the study "Per Capita Consumption Expenditure and Personal Disposable Income in India: An Econometric Analysis," Mallik et al. (2012) examined how per capita personal consumption expenditure adjusts in response to changes in personal disposable income over an extended period. The research revealed that a 1% change in per capita disposable income results in a 16% change in per capita personal consumption expenditure. This indicates that a significant portion of income in India is allocated to consumption rather than savings, with only a small fraction reserved for saving [8] . In the present study similar findings were identified a decreasing trend with increase in income.
The average propensity to savings is increasing with the increase in income. Household consumption patterns also change with income. The lower income groups typically have a propensity to spend more than they make. Many households have poor incomes, which may prevent them from meeting all of their demands. They either take out loans or sell assets they already own to make up the difference between their excess expenditure and income. Table 4 displays the average annual income of the various income categories together with their consumption spending.
Conclusion
The percentage of the people in the study region who does not make a living is larger than that of those who do. As a result, a larger proportion of the unemployed rely on their earning family members. The majority of earner families consist of one or two employed earners, whereas the number of families with more than two or multiple earners is very small. Due to the concentration of income in a small number of families, the sample's income distribution is a little skewed. In terms of annual family income, just 4% earn more than Rs. 400000.00. The annual income of 19.50 percent of households is less than Rs 10,000.00. Most households make an average annual income of less than Rs. 2,000,000.00. The average income of each occupational category influences the differences in the consumption income ratio and average consumption spending. The average inclination to consume food products declines and non-food products increases with an increase in wealth, and vice versa. Conversely, the average willingness to save is inversely correlated with consumption spending and directly correlated with income. Consequently, when income levels grow, the fraction of spending for food articles drops even as the percentage of expenses for non-food products increases. As income levels rise, there is a negative tendency observed in both the consumption income ratio and per capita consumption. The proportion of consumption expenditures that are not related to food rises as a result of higher income groups spending more on consumer durables and other pointless consumption products.
Figures and tables from the paper
| Occupation Groups | Average Income | Average Consumption cost | — | — | Consumption/income | Per capita revenue | Per capita consumption |
|---|---|---|---|---|---|---|---|
| Food | Non-food | Total | |||||
| Cultivators | 95697.5 | 32905.82 | 48536.27 | 81442.09 | 0.85 | 22464.20 | 19117.86 |
| Agricultural Labour | 46689.23 | 25915.57 | 21889.62 | 47805.19 | 1.02 | 11090.08 | 11355.15 |
| Non-Agricultural Labour | 61667.32 | 28132.67 | 30380.59 | 58513.26 | 0.95 | 14859.59 | 14099.58 |
| Business Man | 272578.43 | 58386.40 | 106176.35 | 164562.80 | 0.60 | 66972.59 | 39653.67 |
| Service-man | 307482.37 | 57315.62 | 112754.29 | 170069.90 | 0.55 | 76678.89 | 41683.80 |
| Total | 156822.97 | 40531.22 | 63947.42 | 104478.6 | 0.80 | 38413.07 | 25182.01 |
Table text extracted from the original PDF; superscript letters are shown inline. The original table image is below.
View original table image
References
8 in the original paper- The Economic Times. Share of agriculture in India's GDP declined to 15% in FY23; c2023 Dec 19 [cited 2024 Mar 20]. Available from: https://economictimes.indiatimes.com/news/economy/a griculture/share-of-agriculture-in-indias-gdp-declinedto-15-in-fy23govt/articleshow/106124466.cms?utm_source=contento finterestandutm_medium=textandutm_campaign=cppst
- Government of India Ministry of Agriculture and Farmers Welfare Department of Agriculture and Farmers Welfare. Report on agricultural issues; c2023 Dec 19 [cited 2024 Mar 20]. Available from: https://sansad.in/getFile/loksabhaquestions/annex/1714/ AS228.pdf?source=pqals
- Mukhopadhyay AK, Nayak S, Gangopadhyay D. Nonfarm occupation in rural India. India Sci Technol [Internet]; c2009 [cited 2024 Mar 23]. Available from: https://ssrn.com/abstract=1473036
- Ghosh N. Infrastructure, cost, and labour income in agriculture. Indian J Agric Econ. 2002;57(2):153-68.
- Dev MS. Small farmers in India: challenges and opportunities. Indira Gandhi Institute of Development Research [Internet]; c2012 [cited 2024 May 27]. Available from: http://www.igidr.ac.in/pdf/publication/WP-2012014.pdf
- Esar B, Sachdeva J. Cost and return from cultivation of major crops in Punjab. Agric Situ India. 2023;79(1):617.
- Agrawal T, Agrawal A. Beyond consumption expenditure: income inequality and its sources in India. Prog Dev Stud. 2022;23(1):7-27.
- Mallik L, Pradhan KC. Per capita consumption expenditure and personal disposable income in India: an econometric analysis. Int J Econ Res. 2012;3(2):96102.