
Research article · 2024 · Full text
International Journal of Agriculture Extension and Social DevelopmentWork profile and activity pattern of load carrying workers in grain market
Volume 7(8) · Pages 324–329 · DOI: 10.33545/26180723.2024.v7.i8e.931 ↗
Research areasAgriculture and Farm Safety
Abstract
Author-writtenThe agricultural sector is a major contributor to the Indian economy. Load carriers in grain markets work long hours, frequently starting early in the morning and finishing late in the evening. The study was to investigate workers' work profiles as well as their load-carrying activity patterns. During the survey work phase, two blocks selected at random from two districts in Haryana state. Forty physically fit people were chosen at random from four grain markets, yielding a total sample of 160 workers. The workers' employment profiles revealed that they were predominantly middle-aged and performed manual labor. The majority of workers carried loads on their shoulders with the help of others, earning daily wages and working long hours. All workers were using hook for load carrying and were doing 20-30 shift/day. Cent percent of worker carried 50 kg grain per shift and spending 2-4 hr. Hence it can be summarized that a huge majority of respondents were involved in work of grain market from more than 9 years and drinking water facilities were provided in all grain market. Most commonly body parts involved during load carrying activity were the upper back, lower back and shoulder while lower arms and chest were the least used body parts. The muscles of the upper back are responsible for maintaining posture, balance and distributing the load evenly. It is concluded that taking steps to improve working conditions and provide proper support to load carrying workers, it can help to ensure that they can continue to carry out their essential work safely.
Summary
Source-checkedPlain-language reading of the full paper, prepared with AI and checked against the text. Each point links to the authors' own words.
Why it matters
- Agriculture is a cornerstone of the Indian economy, employing half of the country's labor force. View evidence ↗
- Workers who handle grain are prone to musculoskeletal disorders due to repetitive heavy lifting and poor posture. View evidence ↗
- Mandi laborers typically work in an unorganized sector without guaranteed employment or legal protections for their working conditions. View evidence ↗
The question
- The study aimed to evaluate the work profiles and activity patterns of load-carrying workers in various grain markets. View evidence ↗
What they did
- The research was conducted in the Hisar and Fatehabad districts of Haryana, specifically within the cities of Hisar, Fatehabad, Ratia, and Hansi. View evidence ↗
- The sample consisted of 160 physically fit workers, with 40 participants selected from each of the four cities. View evidence ↗
- Data was collected via personal interviews and analyzed using frequency, percentage, weighted mean score (WMS), and ranking. View evidence ↗
What they found
- Half of the surveyed workers (50%) were between the ages of 31 and 42. View evidence ↗
- The majority of workers (54.4%) were employed on a contractual basis. View evidence ↗
- Most workers (73.7%) carried loads using a shift method rather than manually or by trolley. View evidence ↗
- The shoulder was the most common body part used for carrying loads, utilized by 63.1% of the sample. View evidence ↗
- All workers carried a load of 50 kg per shift. View evidence ↗
- Drinking water facilities were available in all the grain markets surveyed. View evidence ↗
- None of the grain markets provided medical facilities to the workers. View evidence ↗
What it means
- The authors conclude that improving working conditions and providing proper support is necessary to ensure the safety of load-carrying workers. View evidence ↗
Figures & tables
From the original paper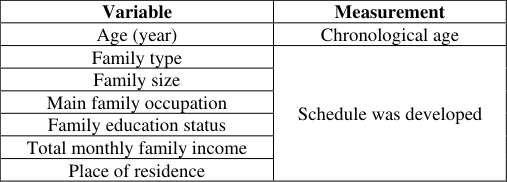 Table 1
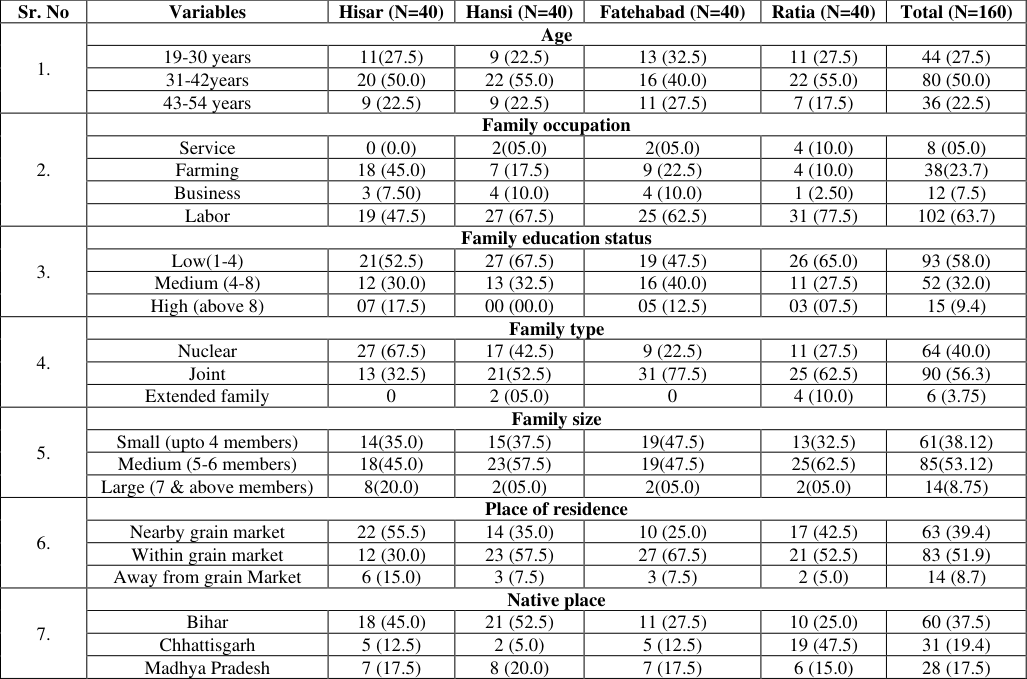 Table 1
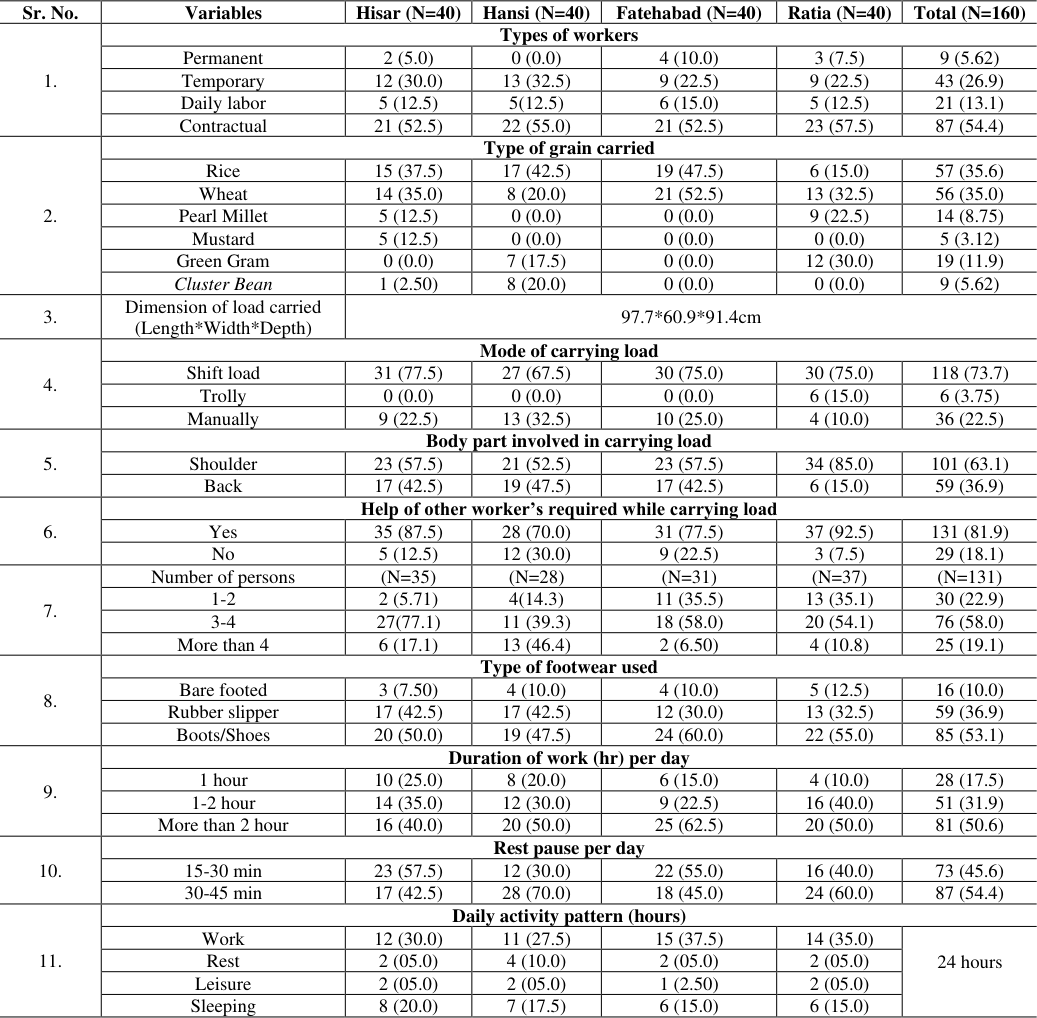 Table 2
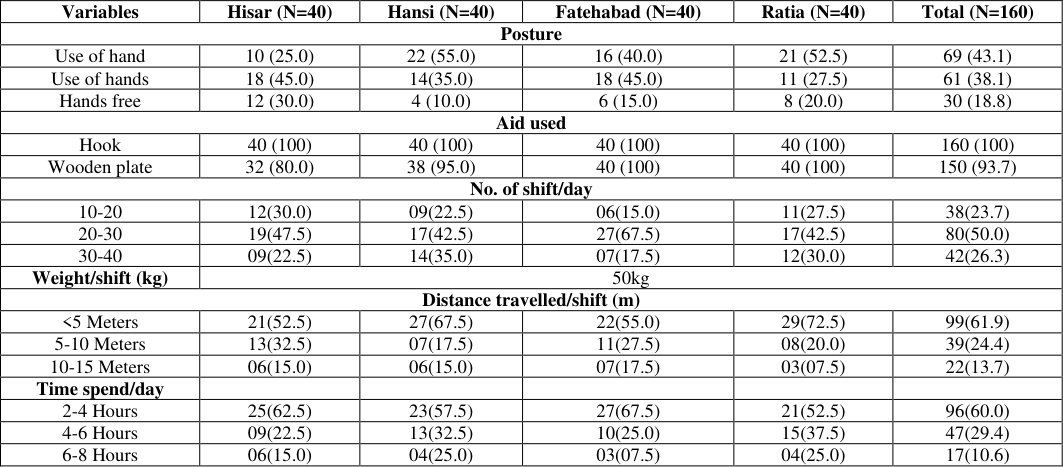 Table 3
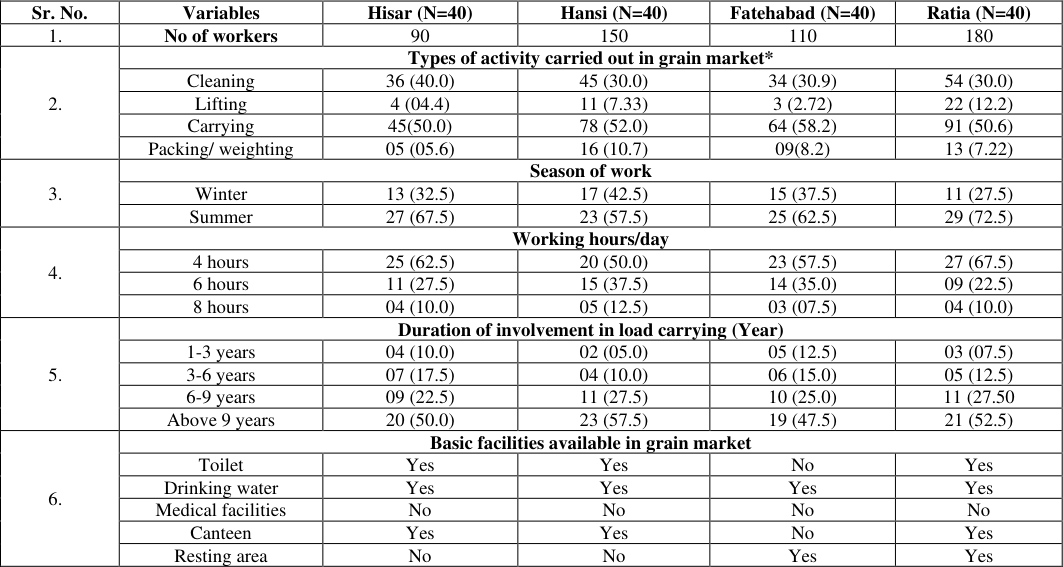 Table 4
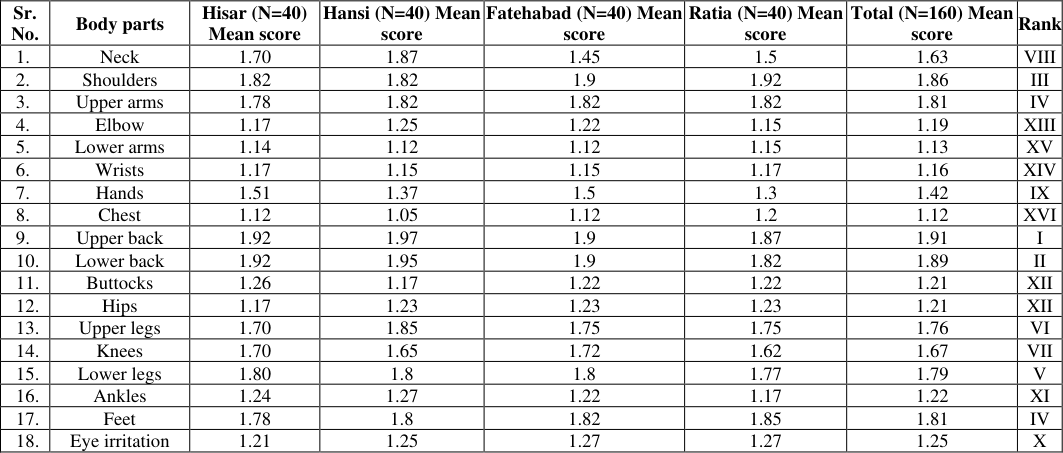 Table 5
Introduction
India's agriculture is a significant geographical issue. India has an agrarian economy, with more than 54% of its land classed as arable and 50% of the labour force employed in the agriculture sector (Annual report of 2020-21 of Department of Agriculture, Cooperation & Farmers' Welfare). One of the most significant industries in the Indian economy is the agricultural sector. There are three main harvesting seasons: Kharif, Rabi, and Zaid. Rice, jowar, bajra, maize, cotton, jute, sugarcane, sesame, and groundnuts are the main Kharif crops, which are grown in April and May and harvested in November. Wheat, tobacco, gramme, linseed, rapeseed, and mustard are the main Rabi crops; they are sown in late October or early November, and they are harvested in March. Zaid crops are summer season crops and they grow for a short time period between Kharif and Rabi crops like corn, cucumber, melon, pepper, tomato and some coarse cereals sown during the month of March and are generally harvested by June end. Mandi labour, like agricultural labour in fields, plays an important and intensive role in agricultural regulated markets. Mandi labour is defined as labour that works in regulated agriculture markets or Mandis during the Mandi season, i.e. when crops arrive. The Mandi labour performs a variety of tasks in a regulated agricultural market for various crop arrivals. In both the Rabi and kharif seasons, various activities such as unloading, packing, cleaning, stitching, loading, and so on are carried out for various crops. Labor in Mandi is only available during the marketing seasons of various crops, such as market arrivals of paddy and cotton in kharif and wheat crop in Rabi. The majority of Mandi labourers are unorganised. They are not guaranteed employment. There is no law that governs agricultural labourers' working conditions. They are completely denied of the benefits of medical facilities and social security. Less bargaining power results from a lack of trade unionism. Grain handlers suffer from musculoskeletal disorders as a result of working in an awkward posture with heavy loads and repetitive work at various locations throughout the workplace. The primary job component of Mandi workers is load handling, which entails lifting and carrying heavy loads of grain-filled sacs. Load carrying workers in grain markets work long hours, often starting early in the morning and working until late in the evening. They may work in all weather conditions, including extreme heat, cold, or rain. There are several methods for carrying a load manually. The mode of load carriage chosen is dictated by elements such as the number, volume, and distance to be carried, as well as terrain and the individual's physical qualities. The work is physically deManding and can lead to injuries or health problems if appropriate safety measures are not in place. In conclusion, load carrying workers play a vital role in the transport of grain and other agricultural products in many markets around the world. So, the current study was planned to assess work profile and load carrying activity pattern of workers of grain market in different areas. www.extensionjournal.com
Methodology
To attain the planned objectives study was conducted on load carrying activity workers of grain market in two district of Haryana state. Hisar and Fatehabad district which were randomly selected. Four cities i.e. Hisar, Fatehabad, Ratia and Hansi were also selected randomly. Sample was comprised of workers, who were involved in load carrying activity in the grain market. A total of 160 workers (40 from each city) were selected purposively who were physically fit and willing to cooperate in the study. A schedule was developed and tested on 20 respondents before conducting the actual study to collect the data. An observation sheet was prepared to assess the work profile and load carrying activity pattern of workers of grain market. Personal interview schedule was used to collect the data and frequency, percentage, WMS and rank were calculated to analysis the data. Tools/aids used: It is the type of mechanical assistance used by respondents to make their work easy. The study also found that the majority of workers were from Bihar (37.5%), Uttar Pradesh (25.6%), Chhattisgarh (19.4%), and Madhya Pradesh (17.5%). The native location of workers is critical for understanding regional dynamics and the variables influencing labor mobility. In the entire samples, 72.5% of workers had total monthly incomes ranging from Rs. 6,001 to Rs. 11,001, Rs. 12,001 to Rs. 17,001-22,001, and Rs. 10,001-22,001. As a result, the socioeconomic profile suggests that the majority of workers were between the ages of 31 and 42, had joint families and had a total monthly family income of Rs. 6,000 to 11,000.
Socio-personal and economic variables
Socio-personal and economic variables
Results and Discussion
Results and Discussion
Family occupation
Family occupation
Figures and tables from the paper
| Sr. No | Variables | Hisar (N=40) | Hansi (N=40) | Fatehabad (N=40) | Ratia (N=40) | Total (N=160) |
|---|---|---|---|---|---|---|
| 1. | Age | |||||
| 19-30 years | 11(27.5) | 9 (22.5) | 13 (32.5) | 11 (27.5) | 44 (27.5) | |
| 31-42years | 20 (50.0) | 22 (55.0) | 16 (40.0) | 22 (55.0) | 80 (50.0) | |
| 43-54 years | 9 (22.5) | 9 (22.5) | 11 (27.5) | 7 (17.5) | 36 (22.5) | |
| 2. | Family occupation | |||||
| Service | 0 (0.0) | 2(05.0) | 2(05.0) | 4 (10.0) | 8 (05.0) | |
| Farming | 18 (45.0) | 7 (17.5) | 9 (22.5) | 4 (10.0) | 38(23.7) | |
| Business | 3 (7.50) | 4 (10.0) | 4 (10.0) | 1 (2.50) | 12 (7.5) | |
| Labor | 19 (47.5) | 27 (67.5) | 25 (62.5) | 31 (77.5) | 102 (63.7) | |
| 3. | Family education status | |||||
| Low(1-4) | 21(52.5) | 27 (67.5) | 19 (47.5) | 26 (65.0) | 93 (58.0) | |
| Medium (4-8) | 12 (30.0) | 13 (32.5) | 16 (40.0) | 11 (27.5) | 52 (32.0) | |
| High (above 8) | 07 (17.5) | 00 (00.0) | 05 (12.5) | 03 (07.5) | 15 (9.4) | |
| 4. | Family type | |||||
| Nuclear | 27 (67.5) | 17 (42.5) | 9 (22.5) | 11 (27.5) | 64 (40.0) | |
| Joint | 13 (32.5) | 21(52.5) | 31 (77.5) | 25 (62.5) | 90 (56.3) | |
| Extended family | 0 | 2 (05.0) | 0 | 4 (10.0) | 6 (3.75) | |
| 5. | Family size | |||||
| Small (upto 4 members) | 14(35.0) | 15(37.5) | 19(47.5) | 13(32.5) | 61(38.12) | |
| Medium (5-6 members) | 18(45.0) | 23(57.5) | 19(47.5) | 25(62.5) | 85(53.12) | |
| Large (7 & above members) | 8(20.0) | 2(05.0) | 2(05.0) | 2(05.0) | 14(8.75) | |
| 6. | Place of residence | |||||
| Nearby grain market | 22 (55.5) | 14 (35.0) | 10 (25.0) | 17 (42.5) | 63 (39.4) | |
| Within grain market | 12 (30.0) | 23 (57.5) | 27 (67.5) | 21 (52.5) | 83 (51.9) | |
| Away from grain Market | 6 (15.0) | 3 (7.5) | 3 (7.5) | 2 (5.0) | 14 (8.7) | |
| 7. | Native place | |||||
| Bihar | 18 (45.0) | 21 (52.5) | 11 (27.5) | 10 (25.0) | 60 (37.5) | |
| Chhattisgarh | 5 (12.5) | 2 (5.0) | 5 (12.5) | 19 (47.5) | 31 (19.4) | |
| Madhya Pradesh | 7 (17.5) | 8 (20.0) | 7 (17.5) | 6 (15.0) | 28 (17.5) |
Table text extracted from the original PDF; superscript letters are shown inline. The original table image is below.
View original table image
| Sr. No. | Variables | Hisar (N=40) | Hansi (N=40) | Fatehabad (N=40) | Ratia (N=40) | Total (N=160) |
|---|---|---|---|---|---|---|
| 1. | Types of workers | |||||
| Permanent | 2 (5.0) | 0 (0.0) | 4 (10.0) | 3 (7.5) | 9 (5.62) | |
| Temporary | 12 (30.0) | 13 (32.5) | 9 (22.5) | 9 (22.5) | 43 (26.9) | |
| Daily labor | 5 (12.5) | 5(12.5) | 6 (15.0) | 5 (12.5) | 21 (13.1) | |
| Contractual | 21 (52.5) | 22 (55.0) | 21 (52.5) | 23 (57.5) | 87 (54.4) | |
| 2. | Type of grain carried | |||||
| Rice | 15 (37.5) | 17 (42.5) | 19 (47.5) | 6 (15.0) | 57 (35.6) | |
| Wheat | 14 (35.0) | 8 (20.0) | 21 (52.5) | 13 (32.5) | 56 (35.0) | |
| Pearl Millet | 5 (12.5) | 0 (0.0) | 0 (0.0) | 9 (22.5) | 14 (8.75) | |
| Mustard | 5 (12.5) | 0 (0.0) | 0 (0.0) | 0 (0.0) | 5 (3.12) | |
| Green Gram | 0 (0.0) | 7 (17.5) | 0 (0.0) | 12 (30.0) | 19 (11.9) | |
| Cluster Bean | 1 (2.50) | 8 (20.0) | 0 (0.0) | 0 (0.0) | 9 (5.62) | |
| 3. | Dimension of load carried (Length*Width*Depth) | 97.7*60.9*91.4cm | ||||
| 4. | Mode of carrying load | |||||
| Shift load | 31 (77.5) | 27 (67.5) | 30 (75.0) | 30 (75.0) | 118 (73.7) | |
| Trolly | 0 (0.0) | 0 (0.0) | 0 (0.0) | 6 (15.0) | 6 (3.75) | |
| Manually | 9 (22.5) | 13 (32.5) | 10 (25.0) | 4 (10.0) | 36 (22.5) | |
| 5. | Body part involved in carrying load | |||||
| Shoulder | 23 (57.5) | 21 (52.5) | 23 (57.5) | 34 (85.0) | 101 (63.1) | |
| Back | 17 (42.5) | 19 (47.5) | 17 (42.5) | 6 (15.0) | 59 (36.9) | |
| 6. | Help of other worker’s required while carrying load | |||||
| Yes | 35 (87.5) | 28 (70.0) | 31 (77.5) | 37 (92.5) | 131 (81.9) | |
| No | 5 (12.5) | 12 (30.0) | 9 (22.5) | 3 (7.5) | 29 (18.1) | |
| 7. | Number of persons | (N=35) | (N=28) | (N=31) | (N=37) | (N=131) |
| 1-2 | 2 (5.71) | 4(14.3) | 11 (35.5) | 13 (35.1) | 30 (22.9) | |
| 3-4 | 27(77.1) | 11 (39.3) | 18 (58.0) | 20 (54.1) | 76 (58.0) | |
| More than 4 | 6 (17.1) | 13 (46.4) | 2 (6.50) | 4 (10.8) | 25 (19.1) | |
| 8. | Type of footwear used | |||||
| Bare footed | 3 (7.50) | 4 (10.0) | 4 (10.0) | 5 (12.5) | 16 (10.0) | |
| Rubber slipper | 17 (42.5) | 17 (42.5) | 12 (30.0) | 13 (32.5) | 59 (36.9) | |
| Boots/Shoes | 20 (50.0) | 19 (47.5) | 24 (60.0) | 22 (55.0) | 85 (53.1) | |
| 9. | Duration of work (hr) per day | |||||
| 1 hour | 10 (25.0) | 8 (20.0) | 6 (15.0) | 4 (10.0) | 28 (17.5) | |
| 1-2 hour | 14 (35.0) | 12 (30.0) | 9 (22.5) | 16 (40.0) | 51 (31.9) | |
| More than 2 hour | 16 (40.0) | 20 (50.0) | 25 (62.5) | 20 (50.0) | 81 (50.6) | |
| 10. | Rest pause per day | |||||
| 15-30 min | 23 (57.5) | 12 (30.0) | 22 (55.0) | 16 (40.0) | 73 (45.6) | |
| 30-45 min | 17 (42.5) | 28 (70.0) | 18 (45.0) | 24 (60.0) | 87 (54.4) | |
| 11. | Daily activity pattern (hours) | |||||
| Work | 12 (30.0) | 11 (27.5) | 15 (37.5) | 14 (35.0) | 24 hours | |
| Rest | 2 (05.0) | 4 (10.0) | 2 (05.0) | 2 (05.0) | ||
| Leisure | 2 (05.0) | 2 (05.0) | 1 (2.50) | 2 (05.0) | ||
| Sleeping | 8 (20.0) | 7 (17.5) | 6 (15.0) | 6 (15.0) |
Table text extracted from the original PDF; superscript letters are shown inline. The original table image is below.
View original table image
| Variables | Hisar (N=40) | Hansi (N=40) | Fatehabad (N=40) | Ratia (N=40) | Total (N=160) |
|---|---|---|---|---|---|
| Posture | |||||
| Use of hand | 10 (25.0) | 22 (55.0) | 16 (40.0) | 21 (52.5) | 69 (43.1) |
| Use of hands | 18 (45.0) | 14(35.0) | 18 (45.0) | 11 (27.5) | 61 (38.1) |
| Hands free | 12 (30.0) | 4 (10.0) | 6 (15.0) | 8 (20.0) | 30 (18.8) |
| Aid used | |||||
| Hook | 40 (100) | 40 (100) | 40 (100) | 40 (100) | 160 (100) |
| Wooden plate | 32 (80.0) | 38 (95.0) | 40 (100) | 40 (100) | 150 (93.7) |
| No. of shift/day | |||||
| 10-20 | 12(30.0) | 09(22.5) | 06(15.0) | 11(27.5) | 38(23.7) |
| 20-30 | 19(47.5) | 17(42.5) | 27(67.5) | 17(42.5) | 80(50.0) |
| 30-40 | 09(22.5) | 14(35.0) | 07(17.5) | 12(30.0) | 42(26.3) |
| Weight/shift (kg) | 50kg | ||||
| Distance travelled/shift (m) | |||||
| <5 Meters | 21(52.5) | 27(67.5) | 22(55.0) | 29(72.5) | 99(61.9) |
| 5-10 Meters | 13(32.5) | 07(17.5) | 11(27.5) | 08(20.0) | 39(24.4) |
| 10-15 Meters | 06(15.0) | 06(15.0) | 07(17.5) | 03(07.5) | 22(13.7) |
| Time spend/day | |||||
| 2-4 Hours | 25(62.5) | 23(57.5) | 27(67.5) | 21(52.5) | 96(60.0) |
| 4-6 Hours | 09(22.5) | 13(32.5) | 10(25.0) | 15(37.5) | 47(29.4) |
| 6-8 Hours | 06(15.0) | 04(25.0) | 03(07.5) | 04(25.0) | 17(10.6) |
Table text extracted from the original PDF; superscript letters are shown inline. The original table image is below.
View original table image
| Sr. No. | Variables | Hisar (N=40) | Hansi (N=40) | Fatehabad (N=40) | Ratia (N=40) |
|---|---|---|---|---|---|
| 1. | No of workers | 90 | 150 | 110 | 180 |
| 2. | Types of activity carried out in grain market* | ||||
| Cleaning | 36 (40.0) | 45 (30.0) | 34 (30.9) | 54 (30.0) | |
| Lifting | 4 (04.4) | 11 (7.33) | 3 (2.72) | 22 (12.2) | |
| Carrying | 45(50.0) | 78 (52.0) | 64 (58.2) | 91 (50.6) | |
| Packing/ weighting | 05 (05.6) | 16 (10.7) | 09(8.2) | 13 (7.22) | |
| 3. | Season of work | ||||
| Winter | 13 (32.5) | 17 (42.5) | 15 (37.5) | 11 (27.5) | |
| Summer | 27 (67.5) | 23 (57.5) | 25 (62.5) | 29 (72.5) | |
| 4. | Working hours/day | ||||
| 4 hours | 25 (62.5) | 20 (50.0) | 23 (57.5) | 27 (67.5) | |
| 6 hours | 11 (27.5) | 15 (37.5) | 14 (35.0) | 09 (22.5) | |
| 8 hours | 04 (10.0) | 05 (12.5) | 03 (07.5) | 04 (10.0) | |
| 5. | Duration of involvement in load carrying (Year) | ||||
| 1-3 years | 04 (10.0) | 02 (05.0) | 05 (12.5) | 03 (07.5) | |
| 3-6 years | 07 (17.5) | 04 (10.0) | 06 (15.0) | 05 (12.5) | |
| 6-9 years | 09 (22.5) | 11 (27.5) | 10 (25.0) | 11 (27.50 | |
| Above 9 years | 20 (50.0) | 23 (57.5) | 19 (47.5) | 21 (52.5) | |
| 6. | Basic facilities available in grain market | ||||
| Toilet | Yes | Yes | No | Yes | |
| Drinking water | Yes | Yes | Yes | Yes | |
| Medical facilities | No | No | No | No | |
| Canteen | Yes | Yes | No | Yes | |
| Resting area | No | No | Yes | Yes |
Table text extracted from the original PDF; superscript letters are shown inline. The original table image is below.
View original table image
| Sr. No. | Body parts | Hisar (N=40) Mean score | Hansi (N=40) Mean score | Fatehabad (N=40) Mean score | Ratia (N=40) Mean score | Total (N=160) Mean score | Rank |
|---|---|---|---|---|---|---|---|
| 1. | Neck | 1.70 | 1.87 | 1.45 | 1.5 | 1.63 | VIII |
| 2. | Shoulders | 1.82 | 1.82 | 1.9 | 1.92 | 1.86 | III |
| 3. | Upper arms | 1.78 | 1.82 | 1.82 | 1.82 | 1.81 | IV |
| 4. | Elbow | 1.17 | 1.25 | 1.22 | 1.15 | 1.19 | XIII |
| 5. | Lower arms | 1.14 | 1.12 | 1.12 | 1.15 | 1.13 | XV |
| 6. | Wrists | 1.17 | 1.15 | 1.15 | 1.17 | 1.16 | XIV |
| 7. | Hands | 1.51 | 1.37 | 1.5 | 1.3 | 1.42 | IX |
| 8. | Chest | 1.12 | 1.05 | 1.12 | 1.2 | 1.12 | XVI |
| 9. | Upper back | 1.92 | 1.97 | 1.9 | 1.87 | 1.91 | I |
| 10. | Lower back | 1.92 | 1.95 | 1.9 | 1.82 | 1.89 | II |
| 11. | Buttocks | 1.26 | 1.17 | 1.22 | 1.22 | 1.21 | XII |
| 12. | Hips | 1.17 | 1.23 | 1.23 | 1.23 | 1.21 | XII |
| 13. | Upper legs | 1.70 | 1.85 | 1.75 | 1.75 | 1.76 | VI |
| 14. | Knees | 1.70 | 1.65 | 1.72 | 1.62 | 1.67 | VII |
| 15. | Lower legs | 1.80 | 1.8 | 1.8 | 1.77 | 1.79 | V |
| 16. | Ankles | 1.24 | 1.27 | 1.22 | 1.17 | 1.22 | XI |
| 17. | Feet | 1.78 | 1.8 | 1.82 | 1.85 | 1.81 | IV |
| 18. | Eye irritation | 1.21 | 1.25 | 1.27 | 1.27 | 1.25 | X |
Table text extracted from the original PDF; superscript letters are shown inline. The original table image is below.