
Research article · 2024 · Full text
International Journal of Agriculture Extension and Social DevelopmentEmpowering rural women through self help group in Vaishali district of Bihar
Volume 7(8) · Pages 249–253 · DOI: 10.33545/26180723.2024.v7.i8d.920 ↗
Research areasCOVID-19 Pandemic ImpactsAgricultural risk and resilienceMicrofinance and Financial Inclusion
Abstract
Author-writtenThe concept of Self Help Groups (SHGs) originated in the 1970s in Bangladesh through the pioneering work of Professor Muhammad Yunus, who later founded the Grameen Bank. The Grameen Bank model of microfinance and SHGs gained international recognition for its innovative approach to poverty alleviation and women's empowerment. For the study Ex-Post factor research design was used. Multi Stage Sampling was followed for the selection of district and respondents respectively. This study investigates the empowerment levels of Self-Help Groups (SHGs) compared to Non- SHGs, focusing on various socio-economic and political aspects. Data was collected from 130 respondents, divided evenly between SHGs and Non-SHGs. The findings reveal that SHGs exhibit higher levels of empowerment, with 21.54% classified as highly empowered, compared to only 13.85% in Non-SHGs. Key areas of empowerment include social empowerment, economical empowerment, political participation, awareness of women's rights, and economic opportunities, where SHGs consistently show stronger agreement among members. The correlation analysis indicates strong relationships between socio-economic factors and decision-making impacts, particularly in areas such as age, education, and family income, with SHGs displaying slightly higher coefficients across most variables. These results underscore the significant role of SHGs in enhancing not only economic status but also social and political awareness among their members.
Summary
Source-checkedPlain-language reading of the full paper, prepared with AI and checked against the text. Each point links to the authors' own words.
Why it matters
- Self-Help Groups (SHGs) are community-based organizations designed to help marginalized people save money and support each other through collective economic activities. View evidence ↗
- Globally, the SHG movement is recognized as an effective method for reducing poverty and empowering women. View evidence ↗
- In the economically disadvantaged state of Bihar, India, SHGs are used as a specific strategy to empower women and alleviate poverty. View evidence ↗
The question
- The study aimed to determine how SHGs impact the empowerment of women specifically within the Vaishali district. View evidence ↗
What they did
- The researchers used an ex-post factor research design and multi-stage sampling to select the district and the participants. View evidence ↗
- The study collected data from 130 respondents, split equally into two groups: those in SHGs and those not in SHGs. View evidence ↗
- Vaishali district was purposively chosen for the study because it contains the highest number of SHGs. View evidence ↗
What they found
- Women in SHGs showed higher overall empowerment, with 21.54% being highly empowered compared to 13.85% of women in Non-SHGs. View evidence ↗
- SHG members exhibited greater political empowerment, including better knowledge of political institutions and awareness of women's rights. View evidence ↗
- There is a strong positive correlation between age and empowerment for both groups (0.9504 for SHGs and 0.947 for Non-SHGs), meaning older women tend to be more empowered. View evidence ↗
- Higher education is significantly associated with increased empowerment in both groups, with correlation coefficients of 0.9222 for SHGs and 0.916 for Non-SHGs. View evidence ↗
- Economic motivation was the strongest driver of empowerment, showing the highest correlation coefficients for both SHGs (0.972) and Non-SHGs (0.8463). View evidence ↗
What it means
- The authors conclude that membership in Self-Help Groups significantly increases women's empowerment compared to those who are not members. View evidence ↗
Visual summary
2 visualsIllustrations explain the paper; charts are replotted from the paper's own table values.
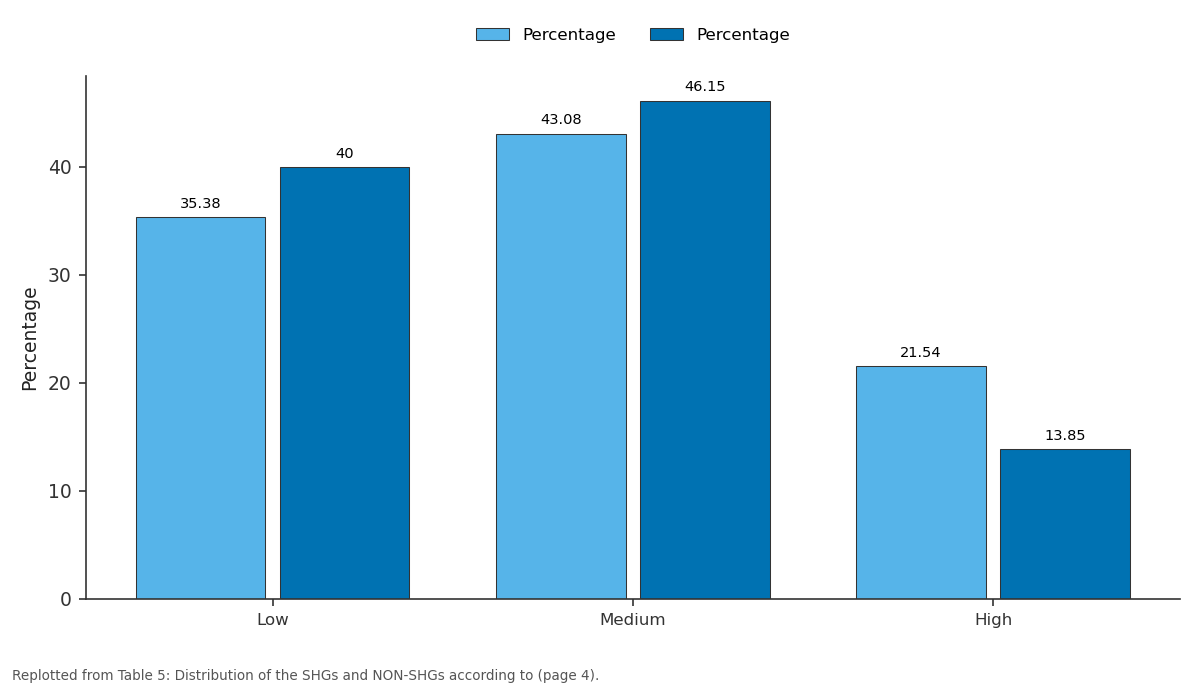
Percentage and Percentage: Low vs Medium vs High
Replotted from Table 5 (page 4) of the original paper. Every bar is the paper's own table value.
View source evidence ↗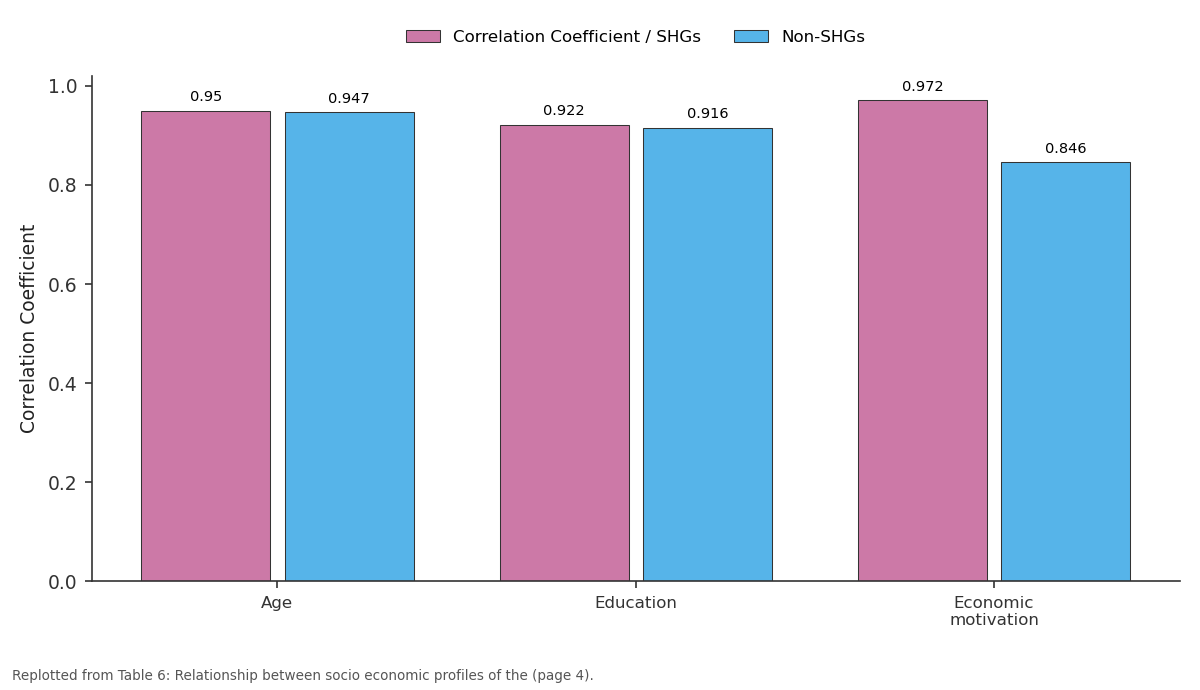
Correlation Coefficient / SHGs and Non-SHGs: Age vs Education vs Economic motivation
Replotted from Table 6 (page 4) of the original paper. Every bar is the paper's own table value.
View source evidence ↗Figures & tables
From the original paper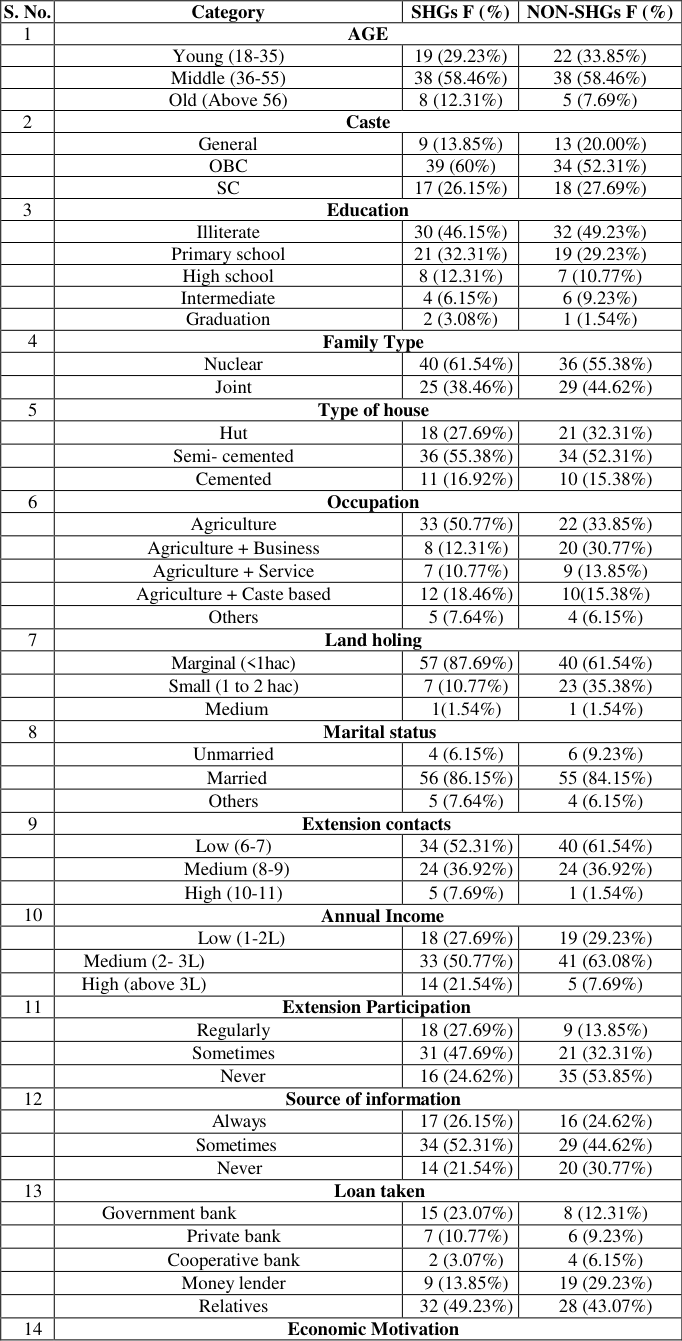 Table 1
 Table 1
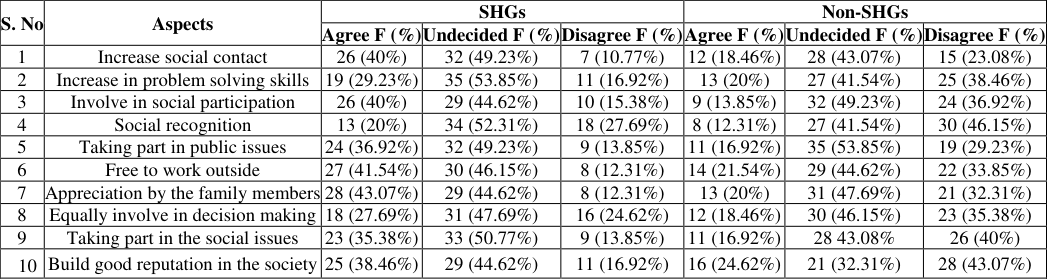 Table 2
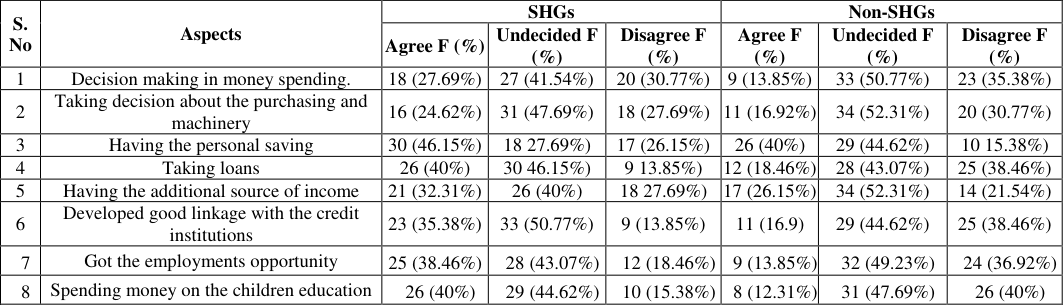 Table 3
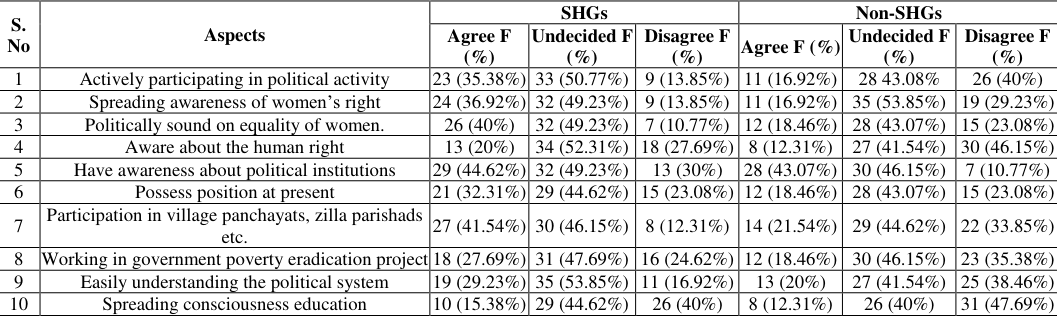 Table 4
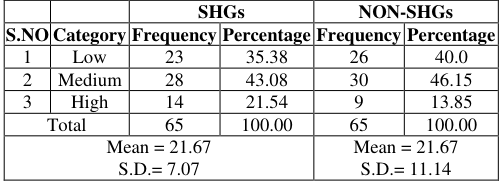 Table 5
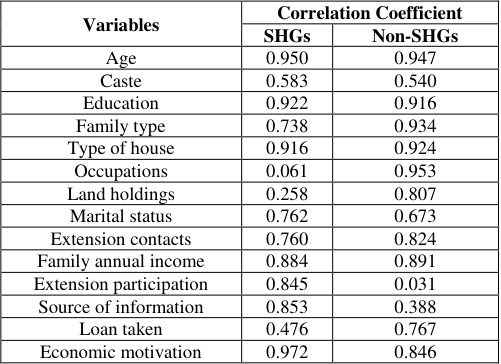 Table 6
Introduction
Self-Help Groups (SHGs) are grassroots organizations that enable individuals, primarily from marginalized communities, to come together to save money, provide mutual support, and engage in economic activities. The core philosophy of SHGs is to promote self-reliance and empowerment through collective action. These groups typically consist of 10-20 members who meet regularly to discuss savings, loans, and other issues affecting their lives. The SHG movement has become a powerful tool for poverty alleviation and women's empowerment globally.
Global Context of SHGs
The concept of self-help groups emerged in the 1970s as a response to the financial exclusion faced by low-income populations. One of the pioneering models was established by Muhammad Yunus in Bangladesh with the creation of the Grameen Bank in 1983. Yunus recognized that traditional banking systems often overlooked the poor, particularly women. By providing microloans without requiring collateral, he demonstrated that impoverished individuals could repay loans if given access to credit and support. The Grameen Bank model inspired similar initiatives worldwide, leading to the establishment of SHGs in various countries. The focus on empowering women through microfinance became a key component of many development strategies, highlighting the potential for economic growth and social change when women are given opportunities.
The Emergence of SHGs in India
In India, the SHG movement gained significant momentum in the late 1980s and early 1990s. The National Bank for Agriculture and Rural Development (NABARD) played a crucial role in promoting SHGs as a means to empower rural communities and enhance financial inclusion. NABARD initiated various programs aimed at forming SHGs and linking them with banks for credit access.
SHGs in Bihar: A Focus on Empowerment
Bihar, one of India's economically disadvantaged states, has embraced the SHG movement as a strategy for poverty alleviation and women's empowerment. The state government, along with various non-governmental organizations (NGOs), has actively promoted SHGs to support marginalized communities, particularly women. www.extensionjournal.com study. Multi stages sampling was followed for the present study for the selection of samples required. Vaishali district is selected purposively for the study because maximum no. of SHGs are in this district. With the help of pre tested interview schedule data was collected from 130 respondents which were selected randomly for the present study. 1: provides a thorough comparison of the socioeconomic characteristics between Self-Help Groups (SHGs) and Non-SHGs, highlighting several important differences across various categories. In terms of age distribution, both groups have similar percentages of young individuals (18-35 years). However, Trainees show a significantly higher percentage in the middle age range (36-55 years) compared to Non-Trainees. On the other hand, Non-Trainees have a greater representation of older individuals (above 56 years), indicating that younger and middle-aged individuals are more inclined to participate in SHGs, while older individuals tend to be less involved. Similar findings reported by Vaishnavi and Aski (2018) [9] . The table 5: The distribution of empowerment levels among Self-Help Groups (SHGs) and Non-SHGs reveals significant insights into their social, economic, and political empowerment. Among SHGs, 35.38% are categorized as having low empowerment, while 43.08% fall into the medium category, indicating a substantial portion experiencing moderate empowerment. Conversely, 21.54% of SHGs achieve high empowerment, suggesting that these groups have made notable strides in enhancing their social and economic status.
| — | — | SHGs | — | NON-SHGs | — |
|---|---|---|---|---|---|
| S.NO | Category | Frequency | Percentage | Frequency | Percentage |
| 1 | Low | 23 | 35.38 | 26 | 40.0 |
| 2 | Medium | 28 | 43.08 | 30 | 46.15 |
| 3 | High | 14 | 21.54 | 9 | 13.85 |
| Total | 65 | 100.00 | 65 | 100.00 | |
| Mean = 21.67 S.D.= 7.07 | Mean = 21.67 S.D.= 11.14 |
Table text extracted from the original PDF; superscript letters are shown inline. The original table image is below.
View original table image
Results and Discussion
In contrast, Non-SHGs show a higher percentage of individuals with low empowerment at 40%, while 46.15% are classified as medium. Notably, only 13.85% of Non-SHGs attain high empowerment, reflecting limited access to resources and support structures that SHGs provide. This disparity underscores the critical role of SHGs in fostering social cohesion, economic independence, and political awareness, enabling members to advocate for their rights and participate actively in community decision-making processes.
Overall, SHGs significantly enhance empowerment compared to their Non-SHG counterparts. Table 5: presents a comparative overview of the levels of impact experienced by Self-Help Groups (SHGs) and Non-SHG members. This comparison highlights the differences in various aspects of decision-making capabilities, the data indicates that SHG members generally report higher levels of decision-making capability compared to Non-SHG members. The table 6: The table presents the correlation coefficients that illustrate the relationship between various socioeconomic profiles of respondents and the overall impact of empowerment, distinguishing between Self-Help Groups (SHGs) and Non-SHGs. The data reveals a strong positive correlation between age and empowerment for both groups, with coefficients of 0.9504 for SHGs and 0.947 for Non-SHGs, indicating that older individuals tend to experience greater empowerment. Education also shows a significant positive correlation, with values of 0.9222 for SHGs and 0.916 for Non-SHGs, suggesting that higher educational attainment is associated with increased empowerment. Caste, family type, type of house, marital status, extension contacts, family annual income, and economic motivation also exhibit strong correlations across both groups, highlighting their importance in the empowerment process. www.extensionjournal.com Notably, economic motivation has the highest correlation coefficient of 0.972 for SHGs and 0.8463 for Non-SHGs, emphasizing its crucial role in driving empowerment. Conversely, the correlation between occupations and empowerment is weak for SHGs (0.06191) but strong for Non-SHGs (0.953), indicating differing dynamics based on group membership. Furthermore, extension participation shows a stark contrast, with a very low correlation for SHGs (0.0317) compared to a more substantial correlation for Non-SHGs (0.8451). Overall, the data underscores the complex interplay between socio-economic factors and empowerment outcomes, with variations evident between SHG and Non-SHG respondents.
| Variables | Correlation Coefficient | — |
|---|---|---|
| SHGs | Non-SHGs | |
| Age | 0.950 | 0.947 |
| Caste | 0.583 | 0.540 |
| Education | 0.922 | 0.916 |
| Family type | 0.738 | 0.934 |
| Type of house | 0.916 | 0.924 |
| Occupations | 0.061 | 0.953 |
| Land holdings | 0.258 | 0.807 |
| Marital status | 0.762 | 0.673 |
| Extension contacts | 0.760 | 0.824 |
| Family annual income | 0.884 | 0.891 |
| Extension participation | 0.845 | 0.031 |
| Source of information | 0.853 | 0.388 |
| Loan taken | 0.476 | 0.767 |
| Economic motivation | 0.972 | 0.846 |
Table text extracted from the original PDF; superscript letters are shown inline. The original table image is below.
View original table image
Conclusion
It is concluded that -Age-wise distribution shows a similar pattern, with a majority of women belonging to the middle age group (36-55 years). Caste-wise, OBC women dominate in both SHG and Non-SHG categories. Educational levels indicate a higher percentage of illiterate women in both groups. Family type shows a majority of nuclear families in SHG, while joint families dominate in Non-SHG. Occupation-wise, agriculture is the primary source of income, with a higher percentage of SHG women engaged in agriculture and business. Landholding patterns reveal a majority of marginal farmers (<1 hectare) in both groups. Marital status shows a higher percentage of married women in both categories. Extension contacts and participation indicate a higher percentage of women with medium to low extension contacts and participation in SHG. Annual income shows a higher percentage of women with medium income (2-3 lakhs) in Non-SHG. Source of information and loantaking patterns vary, with a higher percentage of SHG women relying on relatives for loans. Economic motivation levels indicate a higher percentage of women with medium motivation in SHG.
Figures and tables from the paper
| S. No. | Category | SHGs F (%) | NON-SHGs F (%) |
|---|---|---|---|
| 1 | AGE | ||
| Young (18-35) | 19 (29.23%) | 22 (33.85%) | |
| Middle (36-55) | 38 (58.46%) | 38 (58.46%) | |
| Old (Above 56) | 8 (12.31%) | 5 (7.69%) | |
| 2 | Caste | ||
| General | 9 (13.85%) | 13 (20.00%) | |
| OBC | 39 (60%) | 34 (52.31%) | |
| SC | 17 (26.15%) | 18 (27.69%) | |
| 3 | Education | ||
| Illiterate | 30 (46.15%) | 32 (49.23%) | |
| Primary school | 21 (32.31%) | 19 (29.23%) | |
| High school | 8 (12.31%) | 7 (10.77%) | |
| Intermediate | 4 (6.15%) | 6 (9.23%) | |
| Graduation | 2 (3.08%) | 1 (1.54%) | |
| 4 | Family Type | ||
| Nuclear | 40 (61.54%) | 36 (55.38%) | |
| Joint | 25 (38.46%) | 29 (44.62%) | |
| 5 | Type of house | ||
| Hut | 18 (27.69%) | 21 (32.31%) | |
| Semi- cemented | 36 (55.38%) | 34 (52.31%) | |
| Cemented | 11 (16.92%) | 10 (15.38%) | |
| 6 | Occupation | ||
| Agriculture | 33 (50.77%) | 22 (33.85%) | |
| Agriculture + Business | 8 (12.31%) | 20 (30.77%) | |
| Agriculture + Service | 7 (10.77%) | 9 (13.85%) | |
| Agriculture + Caste based | 12 (18.46%) | 10(15.38%) | |
| Others | 5 (7.64%) | 4 (6.15%) | |
| 7 | Land holing | ||
| Marginal (<1hac) | 57 (87.69%) | 40 (61.54%) | |
| Small (1 to 2 hac) | 7 (10.77%) | 23 (35.38%) | |
| Medium | 1(1.54%) | 1 (1.54%) | |
| 8 | Marital status | ||
| Unmarried | 4 (6.15%) | 6 (9.23%) | |
| Married | 56 (86.15%) | 55 (84.15%) | |
| Others | 5 (7.64%) | 4 (6.15%) | |
| 9 | Extension contacts | ||
| Low (6-7) | 34 (52.31%) | 40 (61.54%) | |
| Medium (8-9) | 24 (36.92%) | 24 (36.92%) | |
| High (10-11) | 5 (7.69%) | 1 (1.54%) | |
| 10 | Annual Income | ||
| Low (1-2L) | 18 (27.69%) | 19 (29.23%) | |
| Medium (2- 3L) | 33 (50.77%) | 41 (63.08%) | |
| High (above 3L) | 14 (21.54%) | 5 (7.69%) | |
| 11 | Extension Participation | ||
| Regularly | 18 (27.69%) | 9 (13.85%) | |
| Sometimes | 31 (47.69%) | 21 (32.31%) | |
| Never | 16 (24.62%) | 35 (53.85%) | |
| 12 | Source of information | ||
| Always | 17 (26.15%) | 16 (24.62%) | |
| Sometimes | 34 (52.31%) | 29 (44.62%) | |
| Never | 14 (21.54%) | 20 (30.77%) | |
| 13 | Loan taken | ||
| Government bank | 15 (23.07%) | 8 (12.31%) | |
| Private bank | 7 (10.77%) | 6 (9.23%) | |
| Cooperative bank | 2 (3.07%) | 4 (6.15%) | |
| Money lender | 9 (13.85%) | 19 (29.23%) | |
| Relatives | 32 (49.23%) | 28 (43.07%) | |
| 14 | Economic Motivation |
Table text extracted from the original PDF; superscript letters are shown inline. The original table image is below.
View original table image
| — | Low (14-15) | 27 (41.54%) | 15(23.07%) |
|---|---|---|---|
| Medium (16-17) | 30 (46.15%) | 33 (50.77%) | |
| High (18-19) | 8 (12.31%) | 17 (26.15%) |
Table text extracted from the original PDF; superscript letters are shown inline. The original table image is below.
View original table image
| S. No | Aspects | SHGs | — | — | Non-SHGs | — | — |
|---|---|---|---|---|---|---|---|
| Agree F (%) | Undecided F (%) | Disagree F (%) | Agree F (%) | Undecided F (%) | Disagree F (%) | ||
| 1 | Increase social contact | 26 (40%) | 32 (49.23%) | 7 (10.77%) | 12 (18.46%) | 28 (43.07%) | 15 (23.08%) |
| 2 | Increase in problem solving skills | 19 (29.23%) | 35 (53.85%) | 11 (16.92%) | 13 (20%) | 27 (41.54%) | 25 (38.46%) |
| 3 | Involve in social participation | 26 (40%) | 29 (44.62%) | 10 (15.38%) | 9 (13.85%) | 32 (49.23%) | 24 (36.92%) |
| 4 | Social recognition | 13 (20%) | 34 (52.31%) | 18 (27.69%) | 8 (12.31%) | 27 (41.54%) | 30 (46.15%) |
| 5 | Taking part in public issues | 24 (36.92%) | 32 (49.23%) | 9 (13.85%) | 11 (16.92%) | 35 (53.85%) | 19 (29.23%) |
| 6 | Free to work outside | 27 (41.54%) | 30 (46.15%) | 8 (12.31%) | 14 (21.54%) | 29 (44.62%) | 22 (33.85%) |
| 7 | Appreciation by the family members | 28 (43.07%) | 29 (44.62%) | 8 (12.31%) | 13 (20%) | 31 (47.69%) | 21 (32.31%) |
| 8 | Equally involve in decision making | 18 (27.69%) | 31 (47.69%) | 16 (24.62%) | 12 (18.46%) | 30 (46.15%) | 23 (35.38%) |
| 9 | Taking part in the social issues | 23 (35.38%) | 33 (50.77%) | 9 (13.85%) | 11 (16.92%) | 28 43.08% | 26 (40%) |
| 10 | Build good reputation in the society | 25 (38.46%) | 29 (44.62%) | 11 (16.92%) | 16 (24.62%) | 21 (32.31%) | 28 (43.07%) |
Table text extracted from the original PDF; superscript letters are shown inline. The original table image is below.
View original table image
| S. No | Aspects | SHGs | — | — | Non-SHGs | — | — |
|---|---|---|---|---|---|---|---|
| Agree F (%) | Undecided F (%) | Disagree F (%) | Agree F (%) | Undecided F (%) | Disagree F (%) | ||
| 1 | Decision making in money spending. | 18 (27.69%) | 27 (41.54%) | 20 (30.77%) | 9 (13.85%) | 33 (50.77%) | 23 (35.38%) |
| 2 | Taking decision about the purchasing and machinery | 16 (24.62%) | 31 (47.69%) | 18 (27.69%) | 11 (16.92%) | 34 (52.31%) | 20 (30.77%) |
| 3 | Having the personal saving | 30 (46.15%) | 18 27.69%) | 17 (26.15%) | 26 (40%) | 29 (44.62%) | 10 15.38%) |
| 4 | Taking loans | 26 (40%) | 30 46.15%) | 9 13.85%) | 12 (18.46%) | 28 (43.07%) | 25 (38.46%) |
| 5 | Having the additional source of income | 21 (32.31%) | 26 (40%) | 18 27.69%) | 17 (26.15%) | 34 (52.31%) | 14 (21.54%) |
| 6 | Developed good linkage with the credit institutions | 23 (35.38%) | 33 (50.77%) | 9 (13.85%) | 11 (16.9) | 29 (44.62%) | 25 (38.46%) |
| 7 | Got the employments opportunity | 25 (38.46%) | 28 (43.07%) | 12 (18.46%) | 9 (13.85%) | 32 (49.23%) | 24 (36.92%) |
| 8 | Spending money on the children education | 26 (40%) | 29 (44.62%) | 10 (15.38%) | 8 (12.31%) | 31 (47.69%) | 26 (40%) |
Table text extracted from the original PDF; superscript letters are shown inline. The original table image is below.
View original table image
| S. No | Aspects | SHGs | — | — | Non-SHGs | — | — |
|---|---|---|---|---|---|---|---|
| Agree F (%) | Undecided F (%) | Disagree F (%) | Agree F (%) | Undecided F (%) | Disagree F (%) | ||
| 1 | Actively participating in political activity | 23 (35.38%) | 33 (50.77%) | 9 (13.85%) | 11 (16.92%) | 28 43.08% | 26 (40%) |
| 2 | Spreading awareness of women’s right | 24 (36.92%) | 32 (49.23%) | 9 (13.85%) | 11 (16.92%) | 35 (53.85%) | 19 (29.23%) |
| 3 | Politically sound on equality of women. | 26 (40%) | 32 (49.23%) | 7 (10.77%) | 12 (18.46%) | 28 (43.07%) | 15 (23.08%) |
| 4 | Aware about the human right | 13 (20%) | 34 (52.31%) | 18 (27.69%) | 8 (12.31%) | 27 (41.54%) | 30 (46.15%) |
| 5 | Have awareness about political institutions | 29 (44.62%) | 32 (49.23%) | 13 (30%) | 28 (43.07%) | 30 (46.15%) | 7 (10.77%) |
| 6 | Possess position at present | 21 (32.31%) | 29 (44.62%) | 15 (23.08%) | 12 (18.46%) | 28 (43.07%) | 15 (23.08%) |
| 7 | Participation in village panchayats, zilla parishads etc. | 27 (41.54%) | 30 (46.15%) | 8 (12.31%) | 14 (21.54%) | 29 (44.62%) | 22 (33.85%) |
| 8 | Working in government poverty eradication project | 18 (27.69%) | 31 (47.69%) | 16 (24.62%) | 12 (18.46%) | 30 (46.15%) | 23 (35.38%) |
| 9 | Easily understanding the political system | 19 (29.23%) | 35 (53.85%) | 11 (16.92%) | 13 (20%) | 27 (41.54%) | 25 (38.46%) |
| 10 | Spreading consciousness education | 10 (15.38%) | 29 (44.62%) | 26 (40%) | 8 (12.31%) | 26 (40%) | 31 (47.69%) |
Table text extracted from the original PDF; superscript letters are shown inline. The original table image is below.
View original table image
References
9 in the original paper- Awasthi A. The role of self-help groups in empowering rural women: A study in Bihar. Int J Soc Sci Econ Res. 2016;1(4):23-30.
- Bhattacharya S, Gupta A. Women's empowerment and self-help groups: A study of rural Bihar. Asian J Women Stud. 2017;23(4):401-418.
- Choudhary R. Economic impact of self-help groups on women's livelihoods in Bihar. J Rural Econ Dev. 2019;8(2):112-130.
- Kumar R, Singh P. Economic empowerment of rural women through self-help groups in Bihar. J Rural Dev. 2018;37(2):145-160.
- Mishra S. Political participation of women in Bihar: The influence of self-help groups. Indian J Gender Stud. 2020;27(1):56-75.
- Pandey R. Social empowerment through self-help groups: A case study of rural women in Bihar. J Community Dev. 2019;54(3):200-215.
- Sharma T, Verma K. Empowering rural women: Analyzing the impact of self-help groups on economic and political participation in Bihar. Int J Rural Stud. 2021;12(1):45-60.
- Yadav N. Assessing the impact of SHGs on women's empowerment in Bihar: A comprehensive review. J Soc Change Dev. 2024;15(2):78-92.
- Vaishnavi S, Aski SG. Socio-economic profile of onion growers in north Karnataka. Adv Res J Soc Sci. 2018;9(2):158-163.
Cited by 1
From OpenAlex, OpenCitations and reference lists read by Scinovex
- Profile characteristics of rural women beneficiaries under the Jeevika programme in Samastipur district of Bihar
Rishu Babu, Parvez Rajan · International Journal of Agriculture Extension and Social Development · 2026
The profile characteristics of programme beneficiaries provide important insights for understanding the outreach and effective implementation of rural development interventions. The present study was undertaken to analyse the profile characteristics of rural women beneficiaries under the JEEViKA programme in Samastipur district of Bihar. An ex-post facto research design with a survey approach was adopted for the study. Samastipur district and Sarairanjan block were selected purposively, and four villages were chosen for the investigation. A total of 145 beneficiaries were selected through prop