
Research article · 2024 · Full text
International Journal of Agriculture Extension and Social DevelopmentImproving yield and quality of water spinach (Ipomoea aquatica) through optimization of biochar and organic fertilizer application rates
Volume 7(8) · Pages 265–269 · DOI: 10.33545/26180723.2024.v7.i8d.923 ↗
Research areasAgricultural Science and Fertilization
Abstract
Author-writtenThis study investigates the effects of optimized biochar and organic fertilizer application rates on the yield and quality of water spinach (Ipomoea aquatica). A series of field experiments were conducted to determine the optimal combination of biochar and organic fertilizer that maximizes crop performance. Key parameters evaluated include plant height, leaf number, chlorophyll content, and overall biomass production. The results indicate that specific application rates of biochar and organic fertilizer significantly enhance both the growth and nutritional quality of water spinach. The findings suggest that the strategic use of biochar and organic fertilizers can be an effective agronomic practice for sustainable vegetable production. Future research should focus on long-term soil health impacts and economic viability of the optimized fertilization strategy.
Summary
Source-checkedPlain-language reading of the full paper, prepared with AI and checked against the text. Each point links to the authors' own words.
Why it matters
- Water spinach is a widely grown leafy vegetable in tropical and subtropical areas, valued for its culinary uses and nutritional content, including calcium, iron, and vitamins A and C. View evidence ↗
- Biochar is a carbon-rich material produced via pyrolysis that can mitigate climate change by sequestering carbon and improve plant growth by enhancing nutrient availability, water retention, and soil structure. View evidence ↗
- Organic fertilizers made from animal and plant residues improve microbial activity and soil organic matter while providing essential nutrients. View evidence ↗
What they did
- The research used a Randomized Complete Block Design (RCBD) with 18 plots (50 m² each) across a 900 m² area, featuring 6 treatments with 3 replications each. View evidence ↗
- Six treatments were tested, varying organic fertilizer from 5 to 7 tons/ha and biochar from 2 to 3 tons/ha, with T1 (5 tons organic/2 tons biochar) serving as the control. View evidence ↗
What they found
- Fertilizer application rates did not affect the timing of harvests or the germination period, which remained uniform across all treatments. View evidence ↗
- At the final harvest, T6 produced the tallest plants (23.9 cm) compared to the control T1 (20.8 cm), a difference that was statistically significant. View evidence ↗
- T6 achieved the highest Leaf Area Index (LAI) of 1.56 m² leaves/m² soil at the first harvest, while the control T1 had the lowest at 1.4 m² leaves/m² soil. View evidence ↗
- At the first harvest, T4 had the highest fresh plant weight (83.2 g), and all treatments significantly outperformed the control T1 (65.16 g). View evidence ↗
- The highest actual yield was recorded in T6 at 35.4 tons/ha, whereas the lowest was in the control T1 at 26.8 tons/ha. View evidence ↗
- T6 had a significantly higher average number of leaves per shoot (11.07) compared to the control T1 (9.4). View evidence ↗
- T6 produced shoots with the largest average diameter (6.4 mm), while T1 and T3 had the smallest (6.1 mm). View evidence ↗
What it means
- The authors conclude that Treatment T6 provided the best overall performance, significantly improving leaf area index, plant height, and leaf number compared to the control. View evidence ↗
- The authors state that future research is needed to evaluate the economic viability and long-term impacts of this fertilization strategy on soil health. View evidence ↗
Visual summary
3 visualsIllustrations explain the paper; charts are replotted from the paper's own table values.
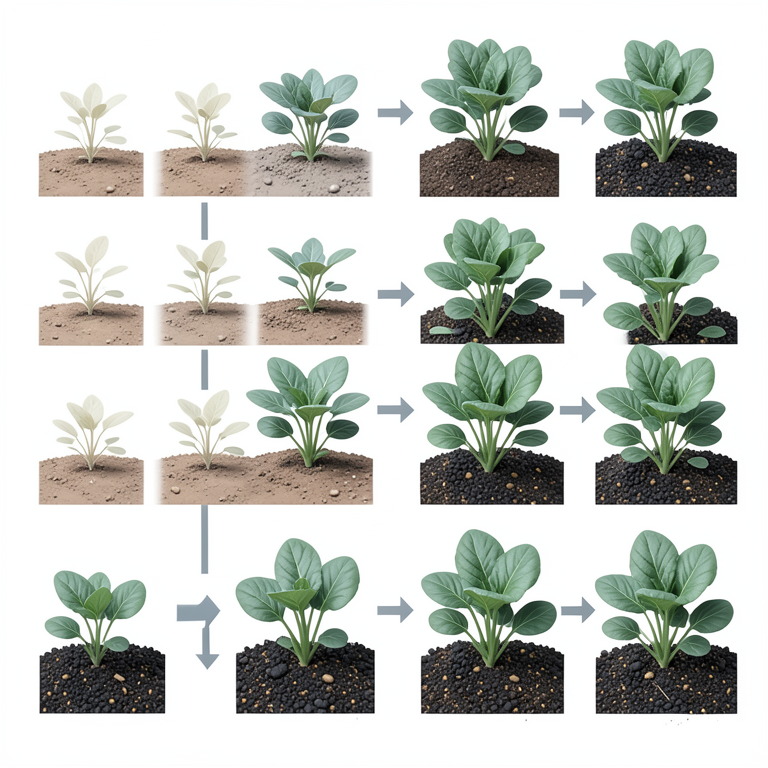
Treatment Matrix
AI-generated conceptual illustration (water spinach (Ipomoea aquatica) plants in soil). It explains the idea and does not show study data.
View source evidence ↗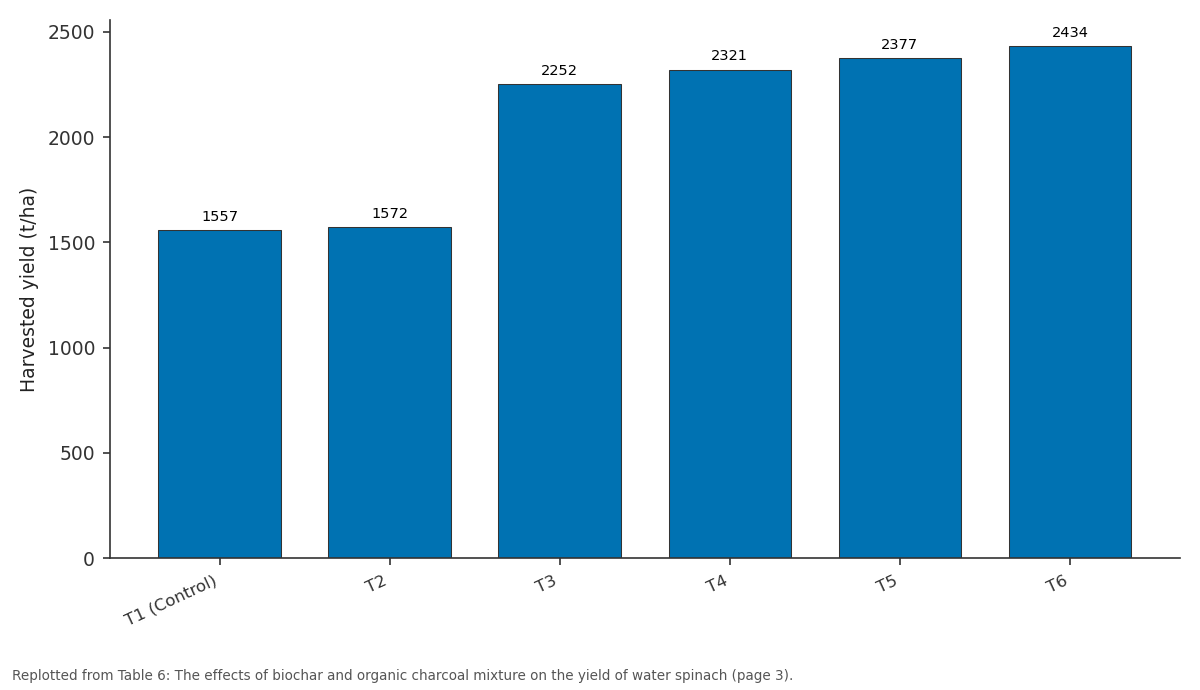
Individual yield (g/plant): T1 (Control) vs T2 vs T3 vs T4 vs T5
Replotted from Table 6 (page 3) of the original paper. Every bar is the paper's own table value.
View source evidence ↗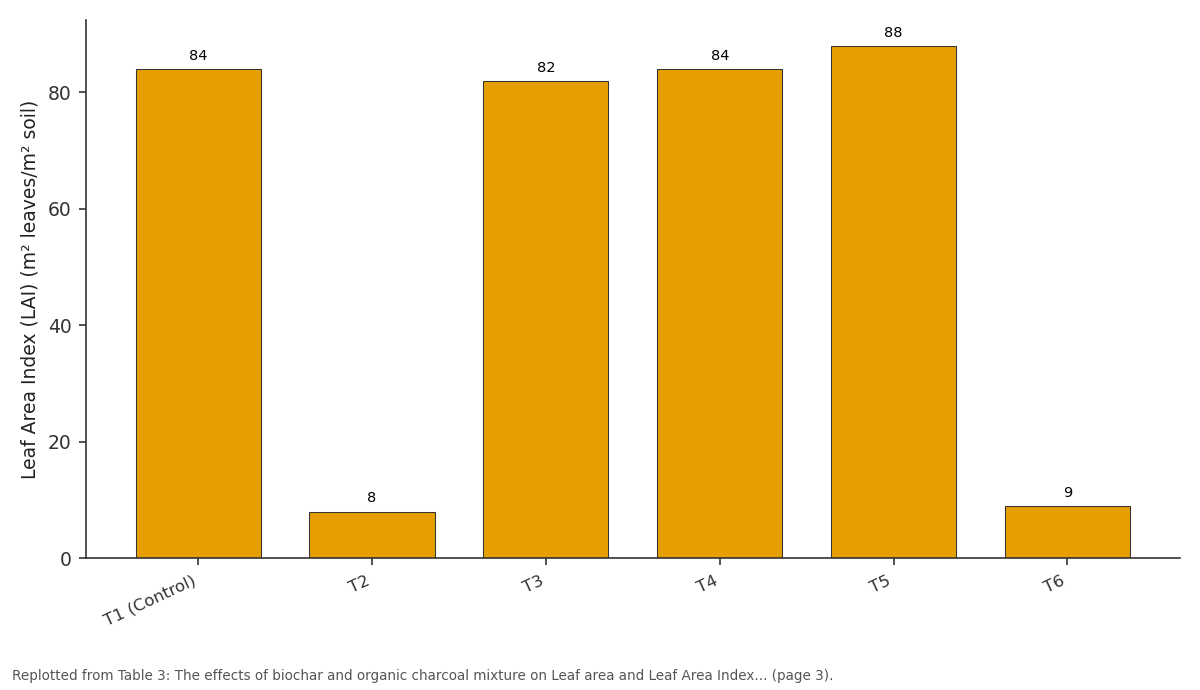
30 days after sowing: T1 (Control) vs T2 vs T3 vs T4 vs T5
Replotted from Table 3 (page 3) of the original paper. Every bar is the paper's own table value.
View source evidence ↗Figures & tables
From the original paper Table 1
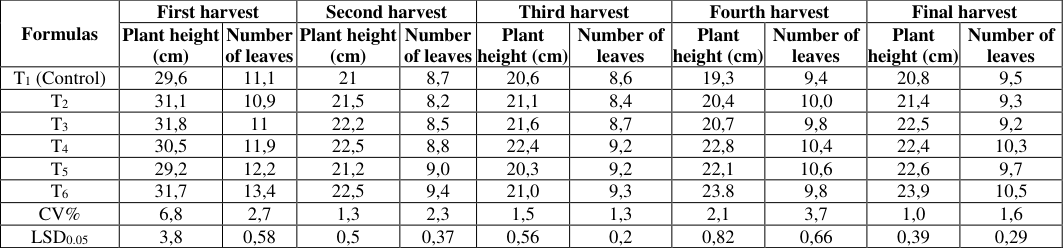 Table 2
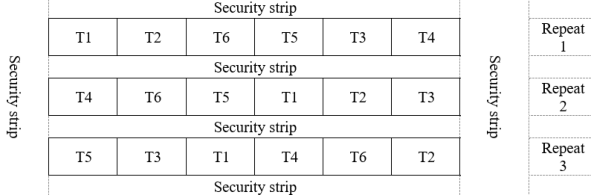 Figure 1
 Table 3
 Table 4
 Table 5
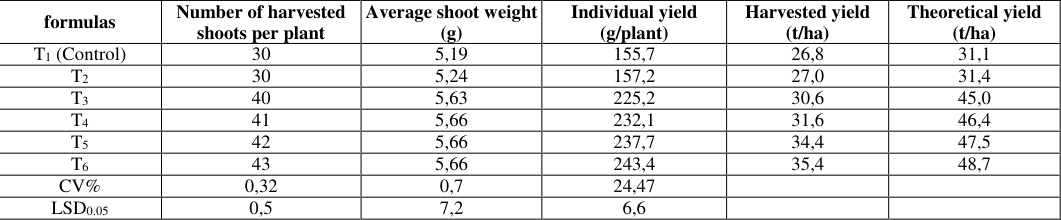 Table 6
 Table 7
Introduction
Water spinach (Ipomoea aquatica), commonly known as morning glory or kangkong, is a widely cultivated leafy vegetable in tropical and subtropical regions. It is highly valued for its nutritional content, including vitamins A and C, iron, and calcium, as well as for its culinary versatility. Given the growing demand for sustainable agricultural practices, there is an increasing interest in enhancing the yield and quality of water spinach through environmentally friendly methods. Biochar, a carbon-rich product obtained from the pyrolysis of organic materials, has gained attention for its potential to improve soil fertility and plant growth. Biochar application can enhance soil structure, water retention, and nutrient availability while also sequestering carbon, thus contributing to climate change mitigation. However, the optimal application rates of biochar for different crops and soil types remain to be fully understood. Organic fertilizers, derived from plant and animal residues, provide essential nutrients to crops while improving soil organic matter and microbial activity. They are a key component of sustainable agriculture, offering a renewable alternative to synthetic fertilizers. The synergistic use of biochar and organic fertilizers has been suggested to further improve soil health and crop productivity, yet detailed studies on the precise optimization of these inputs are limited. This study aims to fill this knowledge gap by investigating the effects of varying application rates of biochar and organic fertilizers on the yield and quality of water spinach. By systematically analyzing plant growth parameters, chlorophyll content, and overall biomass production, we seek to identify the optimal combination of these amendments for enhancing water spinach cultivation. The findings of this research will contribute to the development of sustainable agricultural practices that maximize both productivity and environmental benefits. In the following sections, we present the materials and methods used in our experiments, the results obtained, and a discussion of their implications for water spinach production and broader agricultural practices.
Materials and Research Methods
Materials and Research Methods
Materials
Biochar: Sourced from coconut coir, pyrolyzed at 300 °C for 2 hours. Organic fertilizer: Produced from composted straw and peanut plant stems combined with Effective Microorganisms (EM) inoculant.
Methods
The experiment was designed according to the Randomized Complete Block Design (RCBD). Each experiment included 6 treatments with 3 replications. The total number of plots per experiment was 18, with each plot covering an area of 50 m², and the total experimental area was 900 m². www.extensionjournal.com T1: 5 tons of organic fertilizer/ha and 2 tons of biochar/ha (Control) T2: 6 tons of organic fertilizer/ha and 2 tons of biochar/ha T3: 7 tons of organic fertilizer/ha and 2 tons of biochar/ha T4: 5 tons of organic fertilizer/ha and 3 tons of biochar/ha T5: 6 tons of organic fertilizer/ha and 3 tons of biochar/ha T6: 7 tons of organic fertilizer/ha and 3 tons of biochar/ha The germination period remained uniform across all treatments, and the variations in fertilizer application rates did not influence the harvest time for each cycle.
Research Results and Discussion
Nonetheless, there were noticeable differences in growth and development indicators among the treatments. Fresh plant weight: At 15 days after planting, the highest fresh weight was observed in T6 (20.31 g), and the lowest in T4 (18.24 g). At the first harvest stage, T4 had the highest fresh weight (83.2 g) and T1 had the lowest (65.16 g). All other treatments had significantly higher fresh weights compared to the control, with a 95% confidence level.
Table 5:
The effects of biochar and organic charcoal mixture on pest and disease incidence in water spinach Leaf yellowing: This condition may be caused by nutrient deficiencies, particularly nitrogen. In such cases, additional nitrogenous fertilizers should be applied. Yellowing may also result from prolonged rainfall leading to waterlogging.
Formulas
Formulas
White rust Leaf miners Leaf yellowing Rate of affected plants
White rust Leaf miners Leaf yellowing Rate of affected plants
Severity of damage
Severity of damage
Rate of affected plants
Rate of affected plants
Severity of damage
Severity of damage
Rate of affected plants
Rate of affected plants
Severity of damage
To address this, ensure proper drainage, remove and discard yellowing or decaying leaves to prevent disease spread, and trim any damaged branches caused by rain. Average shoot weight: There is a noticeable difference in the average shoot weight among the treatments. The highest average shoot weight was observed in T4, T5, and T6 (5.66 g/shoot), while the lowest was in T1 (5.19 g/shoot). The other treatments ranged from 5.24 g to 5.63 g per shoot.
Yield per plant: The highest yield per plant was achieved in T6 (243.4 g/plant), while the lowest was in T1 (155.7 g/plant). This difference is statistically significant at the 95% confidence level.
Theoretical yield: The highest theoretical yield was recorded in T6 (48.7 tons/ha), followed by T4 (47.5 tons/ha), and the lowest was in T1 (31.1 tons/ha).
Actual yield:
The highest actual yield was obtained from T6 (35.4 tons/ha), and the lowest from T1 (26.8 tons/ha). The other treatments showed yields as follows: T2 (27 tons/ha), T3 (30.6 tons/ha), T4 (31.6 tons/ha), and T5 (34.4 tons/ha).
Increasing the application rates of organic fertilizer and biochar improved the quality compared to the control treatment, with the most pronounced effect observed in T6.
Shoot diameter:
The average diameter was largest in T6 (6.4 mm) and smallest in T1 and T3 (6.1 mm). The highest average number of leaves per shoot was observed in T6 (11.07 leaves/shoot), while the lowest was in T1 (9.4 leaves/shoot). This difference is statistically significant at the 95% confidence level. The average number of leaves in T6 was significantly higher than in the other treatments.
Leaf length:
The average leaf length was greatest in T4 (13.42 cm), surpassing all other treatments.
Leaf width:
The widest average leaf width was found in T1 (1.92 cm), while the narrowest was in T2 (1.88 cm).
Among the treatments, T6 exhibited the best shoot quality with the longest shoot length (22.03 cm), the widest diameter (6.4 mm), the highest number of leaves (13.09 leaves), and the largest, greenest leaves. In contrast, T1 had the shortest shoot length (21.82 cm) and the fewest number of leaves per shoot (9.4). Increasing the application rates of organic fertilizer and biochar led to better shoot quality compared to the control, with T6 showing the most significant improvement. The increase in organic fertilizer and biochar application resulted in higher effectiveness at the 95% confidence level.
Conclusion
The germination period remained consistent across all treatments, and fertilizer application rates did not affect the harvest time for each cycle. Treatment T6 showed the best overall performance, with significant improvements in plant height, number of leaves, and leaf area index (LAI) at various growth stages compared to the control. Fresh plant weight was highest in T6 at 15 days after planting and showed significant differences across treatments at the first harvest stage, with T4 having the highest weight. Pests and diseases, though not severe, require regular monitoring and appropriate control measures to prevent significant impact on yields. Theoretical and actual yields were highest in T6, followed by T4, with significant improvements in quality and yield parameters compared to the control. Shoot quality, including length, diameter, and number of leaves, was significantly better in T6, demonstrating that increased application rates of organic fertilizer and biochar resulted in higher effectiveness.
Figures and tables from the paper
| Formulas | First harvest | — | Second harvest | — | Third harvest | — | Fourth harvest | — | Final harvest | — |
|---|---|---|---|---|---|---|---|---|---|---|
| Plant height (cm) | Number of leaves | Plant height (cm) | Number of leaves | Plant height (cm) | Number of leaves | Plant height (cm) | Number of leaves | Plant height (cm) | Number of leaves | |
| T1 (Control) | 29,6 | 11,1 | 21 | 8,7 | 20,6 | 8,6 | 19,3 | 9,4 | 20,8 | 9,5 |
| T2 | 31,1 | 10,9 | 21,5 | 8,2 | 21,1 | 8,4 | 20,4 | 10,0 | 21,4 | 9,3 |
| T3 | 31,8 | 11 | 22,2 | 8,5 | 21,6 | 8,7 | 20,7 | 9,8 | 22,5 | 9,2 |
| T4 | 30,5 | 11,9 | 22,5 | 8,8 | 22,4 | 9,2 | 22,8 | 10,4 | 22,4 | 10,3 |
| T5 | 29,2 | 12,2 | 21,2 | 9,0 | 20,3 | 9,2 | 22,1 | 10,6 | 22,6 | 9,7 |
| T6 | 31,7 | 13,4 | 22,5 | 9,4 | 21,0 | 9,3 | 23.8 | 9,8 | 23,9 | 10,5 |
| CV% | 6,8 | 2,7 | 1,3 | 2,3 | 1,5 | 1,3 | 2,1 | 3,7 | 1,0 | 1,6 |
| LSD0.05 | 3,8 | 0,58 | 0,5 | 0,37 | 0,56 | 0,2 | 0,82 | 0,66 | 0,39 | 0,29 |
Table text extracted from the original PDF; superscript letters are shown inline. The original table image is below.
View original table image
| Formulas | Leaf area (dm²) | — | — | Leaf Area Index (LAI) (m² leaves/m² soil) | — | — |
|---|---|---|---|---|---|---|
| 15 days after sowing | 30 days after sowing | First harvest | 15 days after sowing | 30 days after sowing | First harvest | |
| T1 (Control) | 1,6 | 4,2 | 6,8 | 0,32 | 0,84 | 1,4 |
| T2 | 1,3 | 4 | 5,8 | 0,26 | 0,8 | 1,2 |
| T3 | 1,4 | 4,1 | 7,3 | 0,28 | 0,82 | 1,5 |
| T4 | 1,6 | 4,2 | 7,1 | 0,32 | 0,84 | 1,5 |
| T5 | 1,5 | 4,4 | 7,4 | 0,30 | 0,88 | 1,5 |
| T6 | 1,8 | 4,5 | 7,8 | 0,36 | 0,9 | 1,56 |
Table text extracted from the original PDF; superscript letters are shown inline. The original table image is below.
View original table image
| Formulas | SPAD | — | — | Fresh plant weight (g) | — | — | Dry Matter Content (%) | — | — |
|---|---|---|---|---|---|---|---|---|---|
| 15 days after sowing | 30 days after sowing | First harvest | 15 days after sowing | 30 days after sowing | First harvest | 15 days after sowing | 30 days after sowing | First harvest | |
| T1 (Control) | 7,39 | 19,6 | 65,16 | 26,8 | 28,0 | 13,6 | 31,8 | 38,3 | 46,4 |
| T2 | 8,17 | 18,74 | 74,33 | 25,7 | 23,7 | 12,4 | 31.8 | 38,7 | 45,2 |
| T3 | 8 | 19,75 | 70,65 | 25,5 | 27,6 | 12,6 | 31,7 | 38,3 | 47,2 |
| T4 | 7,94 | 19,03 | 83,2 | 24,3 | 27,2 | 11,1 | 31,2 | 39,3 | 47,5 |
| T5 | 8,1 | 18,24 | 72,75 | 25,8 | 28,5 | 11,7 | 31,1 | 38,4 | 46,5 |
| T6 | 8,14 | 20,31 | 76,96 | 26,17 | 23,9 | 11,73 | 31,6 | 38,8 | 47,8 |
Table text extracted from the original PDF; superscript letters are shown inline. The original table image is below.
View original table image
| Formulas | Shoot length (cm) | Leaf length (cm) | Leaf width (cm) | Number of leaves per shoot | Shoot diameter (mm) |
|---|---|---|---|---|---|
| T1 (Control) | 21,82 | 12,92 | 1,92 | 9,40 | 6,1 |
| T2 | 21,45 | 12,99 | 1,88 | 9,87 | 6,2 |
| T3 | 22,32 | 13,06 | 1,91 | 10,60 | 6,1 |
| T4 | 22,21 | 13,39 | 1,91 | 10,80 | 6,2 |
| T5 | 21,51 | 13,42 | 1,91 | 10,47 | 6,3 |
| T6 | 22,03 | 13,09 | 1,90 | 11,07 | 6,4 |
| CV% | 0,9 | 0,4 | 0,13 | 0,68 | 0,3 |
| LSD0. 05 | 2,3 | 1,7 | 3,7 | 3,6 | 2,6 |
Table text extracted from the original PDF; superscript letters are shown inline. The original table image is below.
View original table image
References
18 in the original paper- Mamun SA, et al. Phytoaccumulation of cadmium in leafy vegetables grown in contaminated soil under varying rates of compost and phosphate fertilizer application. Commun Soil Sci Plant Anal. 2021;52(18):2161-2176.
- Sun H, Chen Y, Yi Z. After-effects of hydrochar amendment on water spinach production, N leaching, and N2O emission from a vegetable soil under varying N-inputs. Plants. 2022;11(24):3444.
- Wang L, et al. Yield and nutritional quality of water spinach (Ipomoea aquatica) as influenced by hydroponic nutrient solutions with different pH adjustments. Int J Agric Biol. 2017;19(4).
- Sarkar RK, Jana JC, Datta S. Effect of boron and zinc application on growth, seed yield and seed quality of water spinach (Ipomoea reptans Poir.) under terai region of West Bengal. J Appl Nat Sci. 2017;9(3):16961702.
- Ibrahim MH, Mohd Zain NA. Effect of nitrogen rates www.extensionjournal.com on growth and quality of water spinach (Ipomoea aquatica). Ann Res Rev Biol. 2018;26(1):1-12.
- Pandey P, et al. Effect of different media on the growth, yield and quality of water spinach under container gardening. Int J Adv Res Biotechnol Nanotechnol. 2019;1(1):28-38.
- Sarkar RK, Jana JC, Datta S. Effect of different sowing times and spacings on growth, yield and quality of water spinach (Ipomoea reptans Poir.) under terai region of West Bengal. J Appl Nat Sci. 2014;6(2):489494.
- Endut A, et al. Effect of flow rate on water quality parameters and plant growth of water spinach (Ipomoea aquatica) in an aquaponic recirculating system. Desalination Water Treat. 2009;5(1-3):19-28.
- Noor NM, Mohd Ropi NA, Leong HY. Effects of organic, inorganic and compound fertilizer on growth and quality of water spinach (Ipomoea aquatica) under polyculture condition. J Agrobiotech. 2022;13(1):1-12.
- Li W, et al. Effects of water spinach (Ipomoea aquatica) cultivation on water quality and performance of Chinese soft-shelled turtle (Pelodiscus sinensis) pond culture. Aquacult Environ Interact. 2016;8:567-574.
- Kitayama M, et al. Effect of light quality on physiological disorder, growth, and secondary metabolite content of water spinach (Ipomoea aquatica Forssk) cultivated in a closed-type plant production system. HortSci Technol. 2019;37(2):206-218.
- Sarkar RK, Jana JC, Datta S. Effect of cutting frequencies and nitrogen levels on growth, green and seed yield and quality of water spinach (Ipomoea reptans Poir.). J Appl Nat Sci. 2014;6(2):545-551.
- Yusufirashim R-E, et al. Growth, photosynthesis and quality of water spinach (Ipomoea aquatica) as influenced by magnetic nanoparticles (MNP) application. Ann Res Rev Biol. 2019;31(6):1-15.
- Gangopadhyay M, et al. Water spinach (Ipomoea aquatica Forsk.) breeding. In: Advances in Plant Breeding Strategies: Vegetable Crops, Volume 10: Leaves, Flowerheads, Green Pods, Mushrooms and Truffles. 2021;183-215.
- Luyen LT, Preston TR. Effect of level of urea fertilizer on biomass production of water spinach (Ipomoea aquatica) grown in soil and in water. Livest Res Rural Dev. 2004;16(10):67-73.
- Uddin M, Kashem A, Osman KT. Effect of organic and inorganic fertilizers on phytoavailability of phosphorus to water spinach (Ipomoea aquatica cv. Kankon). J Agric Biol Sci. 2012;7(3):152-156.
- Akter B, Chakraborty SC, Salam MA. Aquaponic production of Tilapia (Oreochromis niloticus) and water spinach (Ipomoea aquatica) in Bangladesh. Res Agric Livest Fish. 2018;5(1):93-106.
- Wang L, et al. Yield and nutritional quality of water spinach (Ipomoea aquatica) as influenced by hydroponic nutrient solutions with different pH adjustments. Int J Agric Biol. 2017;19(4):635-642.