
Research article · 2024 · Full text
International Journal of Agriculture Extension and Social DevelopmentScale to measure the attitude of farmers towards district agro-met units (DAMUS) Project
Volume 7(8S) · Pages 65–69 · DOI: 10.33545/26180723.2024.v7.i8sb.913 ↗
Research areasAgricultural Economics and PracticesLivestock Management and Performance ImprovementAgricultural Systems and Practices
Abstract
Author-writtenAgriculture in India is heavily dependent on weather, with crop yields largely determined by the monsoon season. Farmers require timely and accurate weather information to make informed decisions regarding harvesting, watering, planting, and pest control. The need for such information has become even more critical due to the increased uncertainty in weather patterns caused by climate change. Weather services like the District Agro-Met Units (DAMUs) provide localized and detailed forecasts that are essential for farmers to enhance their productivity and resilience to adverse weather conditions. Given the importance of studying farmers' attitudes towards the DAMUs project, a scale has been developed to measure these attitudes. The Scale Product Method was employed, which combines Thurstone’s technique of equal appearing interval scale for item selection with Likert’s technique of summated rating. The development process began with identifying key aspects and collecting relevant items. This was followed by a relevancy and item analysis, and finally, checking the reliability and validity to ensure precision and consistency of the results. Initially, 47 statements were selected, and through this process, 15 statements were ultimately retained in the scale to measure the attitude of farmers towards DAMUs project. The developed scale was found to be reliable.
Summary
Source-checkedPlain-language reading of the full paper, prepared with AI and checked against the text. Each point links to the authors' own words.
Why it matters
- Indian agriculture depends heavily on weather conditions, with the monsoon season being the primary determinant of crop yields. View evidence ↗
- Climate change has increased the uncertainty of weather patterns, making accurate forecasts more critical for farmers. View evidence ↗
- District Agro-Met Units (DAMUs) provide localized and detailed weather information, which is more useful to farmers than generalized forecasts. View evidence ↗
The question
- The objective of the study was to develop and standardize a scale to measure farmers' attitudes toward the DAMUs project. View evidence ↗
What they did
- The researchers used the 'Scale Product Method,' combining Thurston's equal appearing interval scale for item selection and Likert's summated rating for responses. View evidence ↗
- An initial pool of 47 non-ambiguous statements was selected from literature and discussions with extension personnel. View evidence ↗
- The items were sent to 142 judges; 65 responded, and after eliminating careless responses, 50 schedules were used for scale construction. View evidence ↗
- Reliability was tested using the split-half technique on 20 respondents, dividing the final 15 statements into odd and even sets. View evidence ↗
What they found
- The item selection process reduced the initial 47 statements to a final set of 15 statements for the attitude scale. View evidence ↗
- The scale's reliability coefficient was 0.76 using Rulon's Formula, which increased to 0.86 after applying the Spearman-Brown correction factor. View evidence ↗
- The instrument is presumed to have content validity based on expert discussions, literature reviews, and judge ratings. View evidence ↗
What it means
- The authors conclude that the developed scale is reliable and valid, and recommend its use by other investigators in agricultural organizations with necessary modifications. View evidence ↗
Visual summary
3 visualsIllustrations explain the paper; charts are replotted from the paper's own table values.
Scale Product Method Workflow
AI-generated conceptual illustration (Agricultural farmers in a rural field setting). It explains the idea and does not show study data.
View source evidence ↗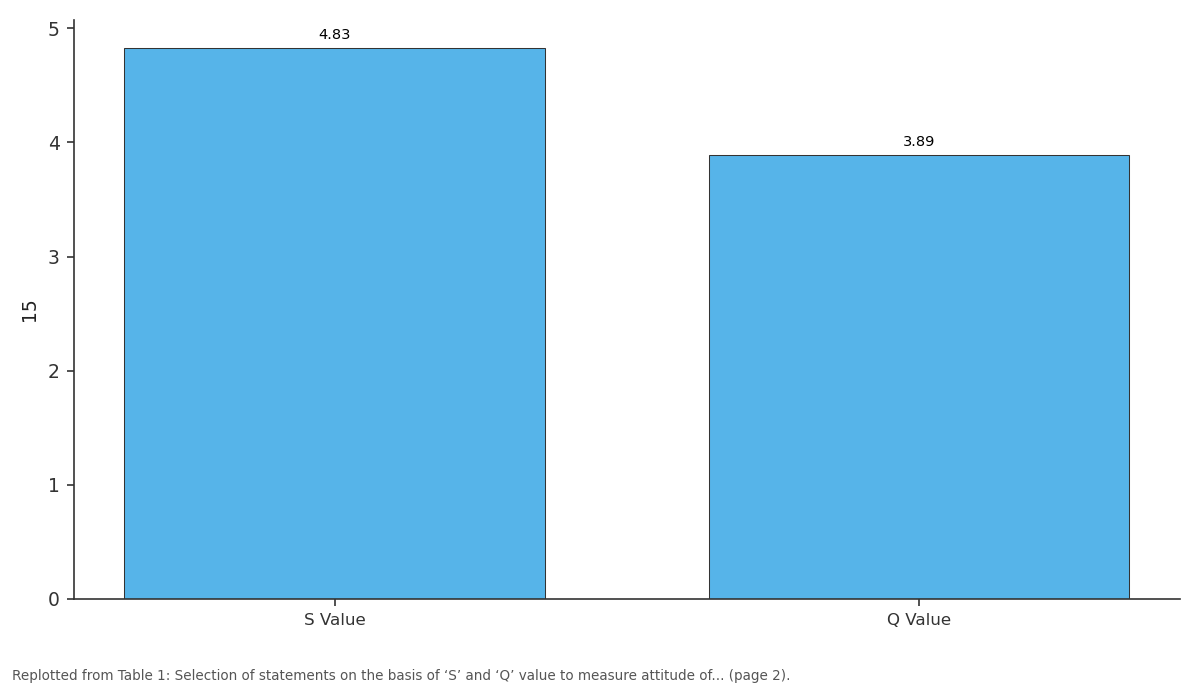
15: S Value vs Q Value
Replotted from Table 1 (page 2) of the original paper. Every bar is the paper's own table value.
View source evidence ↗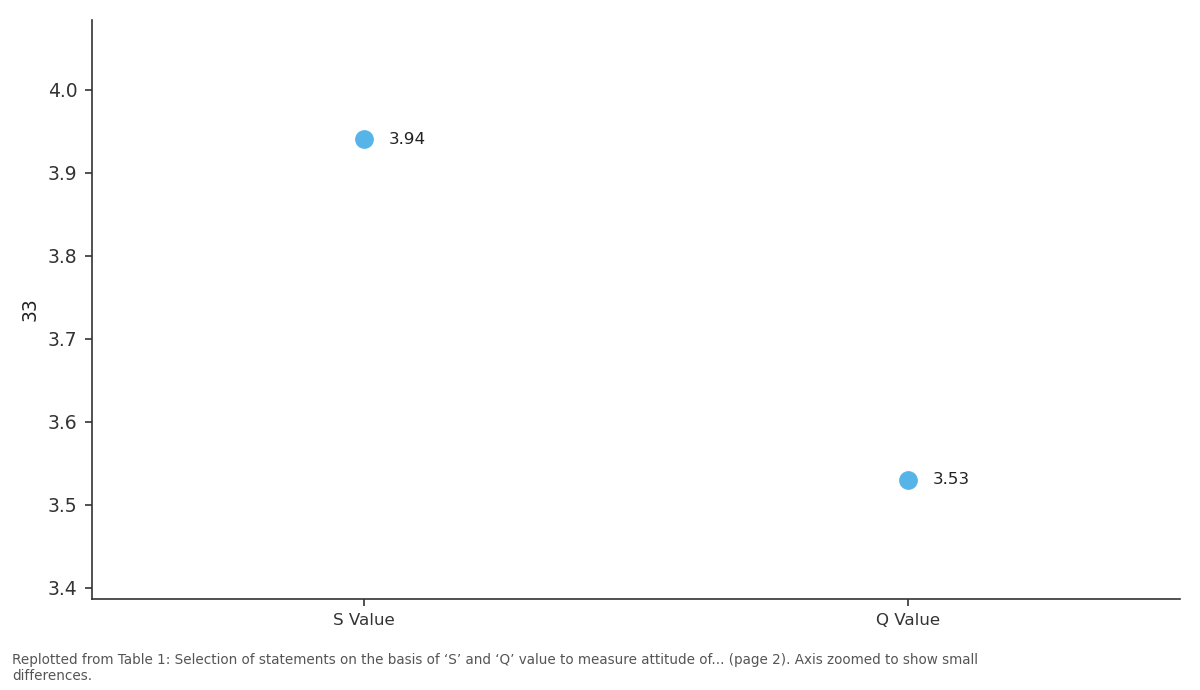
33: S Value vs Q Value
Replotted from Table 1 (page 2) of the original paper. Every bar is the paper's own table value.
View source evidence ↗Figures & tables
From the original paper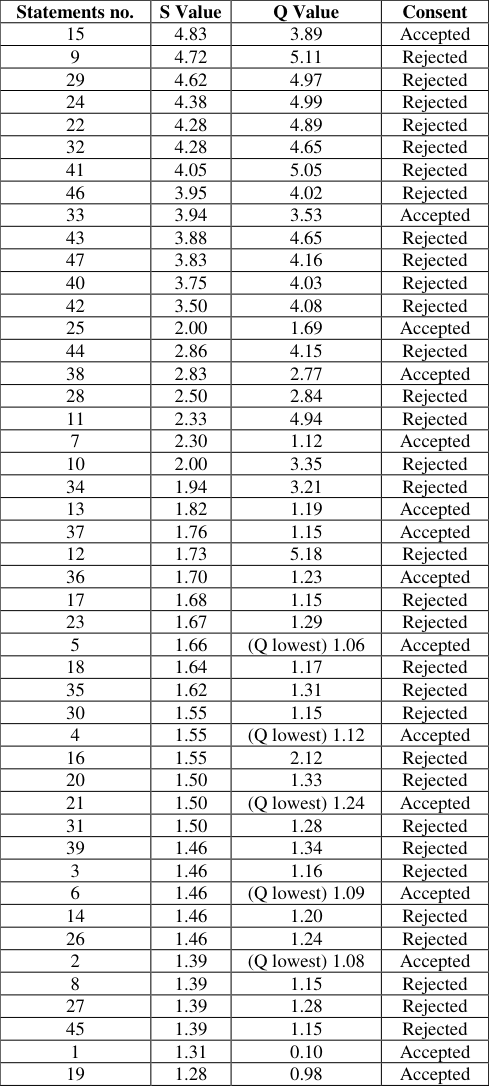 Table 1
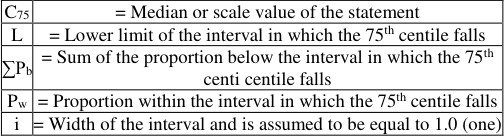 Table 1
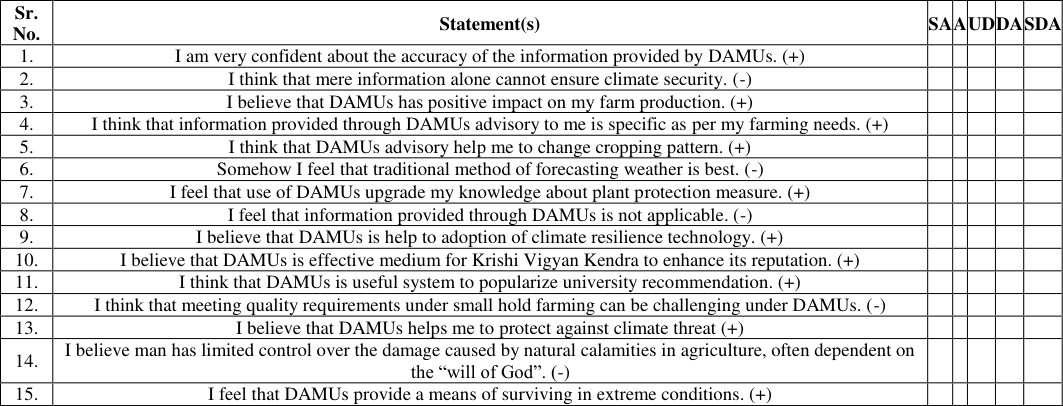 Table 2
Introduction
Agriculture in India is highly reliant on the weather, and crop yields are mostly determined by the monsoon season. Farmers need quick and accurate weather information in order to make well-informed decisions about harvesting, watering, planting, and pest control. By lowering the hazards brought on by erratic weather patterns, weather services improve food security and minimize crop losses. Farmers now need access to accurate weather forecasts even more because climate change has increased weather pattern uncertainty in recent years. Compared to generalized forecasts, weather services like DAMUs offer localized and detailed weather information that is more pertinent and helpful for farmers. Farmers that use this information to optimize their agricultural techniques will be more productive and resilient to bad weather. Overall, to help the agricultural sector, guarantee food security, and enhance farmers' lives, India urgently needs efficient weather services. In order to improve farmers' decision-making skills and overall agricultural productivity, the District Agro-Met Units (DAMUs) project seeks to offer farmers with localized weather information and agricultural advice. Knowing how farmers feel about DAMUs is important for evaluating the acceptability and efficacy of these efforts, as agriculture is the main source of income for many. Farmers' positive perceptions and active engagement are critical to the project's success since they have a substantial impact on the agricultural outcomes in this region. Keeping this in view, a standardized scale has been developed to measure the attitude of farmers towards DAMUs project.
Objective
To develop and standardize a scale to measure the attitude of farmers towards DAMUs project
Materials and Methods
Among available techniques for the construction of the scales, the Thurston's Equal Appearing Interval Scale (1928) [9] and the Likert's Summated Rating Scale (1932) [8] are quite well-known. However, both these methods suffer from the limitations, the first one in getting discriminating response and second one in the selection of items. Thus, the technique chosen to construct the attitude scale was "Scale Product Method" which combines the Thurston's technique of equal appearing interval scale for selection of the items and Likert's technique of summated rating for ascertaining the response on the scale as proposed by Eysenck and www.extensionjournal.com Crown (1949) [3] . The procedures are followed as followed by Chauhan et al. (2022) [1] , Yeragorla et al. (2021) [12] , Jagadeeswari et al. (2019) [5] and Vinaya et al. (2018) [11] .
Steps in construction of attitude scale
Steps in development of the attitude scale explained as below:
Item selection
The items of attitude scale refer to statements related to attitude. Primarily, large number of statements reflecting attitude towards working in rural area were collected from relevant literature and constructed through discussion with extension personnel. The statements thus selected were edited on the basis of criteria shown by Edwards (1957) [2] and at last, 47 statements were selected as they were found to be non-ambiguous. The selected statements are presented in Table 1.
| Statements no. | S Value | Q Value | Consent |
|---|---|---|---|
| 15 | 4.83 | 3.89 | Accepted |
| 9 | 4.72 | 5.11 | Rejected |
| 29 | 4.62 | 4.97 | Rejected |
| 24 | 4.38 | 4.99 | Rejected |
| 22 | 4.28 | 4.89 | Rejected |
| 32 | 4.28 | 4.65 | Rejected |
| 41 | 4.05 | 5.05 | Rejected |
| 46 | 3.95 | 4.02 | Rejected |
| 33 | 3.94 | 3.53 | Accepted |
| 43 | 3.88 | 4.65 | Rejected |
| 47 | 3.83 | 4.16 | Rejected |
| 40 | 3.75 | 4.03 | Rejected |
| 42 | 3.50 | 4.08 | Rejected |
| 25 | 2.00 | 1.69 | Accepted |
| 44 | 2.86 | 4.15 | Rejected |
| 38 | 2.83 | 2.77 | Accepted |
| 28 | 2.50 | 2.84 | Rejected |
| 11 | 2.33 | 4.94 | Rejected |
| 7 | 2.30 | 1.12 | Accepted |
| 10 | 2.00 | 3.35 | Rejected |
| 34 | 1.94 | 3.21 | Rejected |
| 13 | 1.82 | 1.19 | Accepted |
| 37 | 1.76 | 1.15 | Accepted |
| 12 | 1.73 | 5.18 | Rejected |
| 36 | 1.70 | 1.23 | Accepted |
| 17 | 1.68 | 1.15 | Rejected |
| 23 | 1.67 | 1.29 | Rejected |
| 5 | 1.66 | (Q lowest) 1.06 | Accepted |
| 18 | 1.64 | 1.17 | Rejected |
| 35 | 1.62 | 1.31 | Rejected |
| 30 | 1.55 | 1.15 | Rejected |
| 4 | 1.55 | (Q lowest) 1.12 | Accepted |
| 16 | 1.55 | 2.12 | Rejected |
| 20 | 1.50 | 1.33 | Rejected |
| 21 | 1.50 | (Q lowest) 1.24 | Accepted |
| 31 | 1.50 | 1.28 | Rejected |
| 39 | 1.46 | 1.34 | Rejected |
| 3 | 1.46 | 1.16 | Rejected |
| 6 | 1.46 | (Q lowest) 1.09 | Accepted |
| 14 | 1.46 | 1.20 | Rejected |
| 26 | 1.46 | 1.24 | Rejected |
| 2 | 1.39 | (Q lowest) 1.08 | Accepted |
| 8 | 1.39 | 1.15 | Rejected |
| 27 | 1.39 | 1.28 | Rejected |
| 45 | 1.39 | 1.15 | Rejected |
| 1 | 1.31 | 0.10 | Accepted |
| 19 | 1.28 | 0.98 | Accepted |
Table text extracted from the original PDF; superscript letters are shown inline. The original table image is below.
View original table image
Determination of scale and quartile value
The five points of the rating scale were assigned score ranking from 1 for not important and 5 for very important.
The responses of 50 judges on 47 items were transferred into the master sheet. The appropriateness and relevancy was calculated by using statistics advocated by 'Scale Product Method'. Based on judgement, the Median value of distribution and the Quartile value (Q) for the statement concerned were calculated. The following procedure was use for calculation of S and Q values.
Where, The inter quartile range was worked out for determination of ambiguity involved in the statement by taking the difference between C75 (Q3) and C25 (Q1), that means Q = C75 -C25 for each statement. In this manner, the inter-quartile range (Q) for each statement was worked out and presented in Table 1. Thurstone et al. and C have (Edwards, 1957) [2] described criteria in addition to Q as a basis for rejecting statement in scales constructed by the method of the equal appearing interval. In this case statements no.
Reliability of the scale
The split-half technique was used to measure the reliability of the scale. The 15 statements were divided into two equal halves as two separate sets with 8 odd numbered and 7 even numbered statements in order. These were administered to 20 respondents. Each of the two sets was treated as separate scale and scores for both the sets from the 20 respondents were obtained. The coefficient of reliability was calculated by Rulon's Formula (Guilford 1954) [4] , which came to 0.76. Reliability is directly related to the length of scale when we split to odd and even number items. The reliability coefficient which has been calculated is the value of half size of the original scale. In case of finding reliability using split half method, researcher needs to apply correction factor for final value of reliability. In this scale it was found 0.86.
Validity of the scale
The validity of a test depends on its accuracy in measuring what it is intended to measure (Kerlinger, 1976) [6] . The validity of this scale was assessed using content validity, www.extensionjournal.com which involves evaluating how well the scale's content represents the subject matter domain under study. To ensure this, items were selected through expert discussions, literature reviews, and strict adherence to judges' ratings. As a result, it is presumed that the instrument meets the criteria for content validity.
Results and Discussion
A standardized scale for measuring attitude of farmers towards DAMUs project was developed according to scale product method which combines the Thurston's technique of equal appearing interval scale for selection of the items and Likert's technique of summated rating. The selected 15 statements for final format of the attitude scale have been randomly arranged to avoid response bias. The final format of the scale is presented in Table 2. This scale was found to be reliable with a correlation coefficient of 0.86. I think that mere information alone cannot ensure climate security. (-) 3.
I believe that DAMUs has positive impact on my farm production. (+) 4.
I think that information provided through DAMUs advisory to me is specific as per my farming needs. (+) 5.
I think that DAMUs advisory help me to change cropping pattern. (+) 6.
Somehow I feel that traditional method of forecasting weather is best. (-) 7.
I feel that use of DAMUs upgrade my knowledge about plant protection measure. (+) 8.
I feel that information provided through DAMUs is not applicable. (-) 9.
I believe that DAMUs is help to adoption of climate resilience technology. (+) 10.
I believe that DAMUs is effective medium for Krishi Vigyan Kendra to enhance its reputation. (+) 11.
I think that DAMUs is useful system to popularize university recommendation. (+) 12.
I think that meeting quality requirements under small hold farming can be challenging under DAMUs. (-) 13.
I believe that DAMUs helps me to protect against climate threat (+)
I believe man has limited control over the damage caused by natural calamities in agriculture, often dependent on the "will of God". (-) 15.
I feel that DAMUs provide a means of surviving in extreme conditions. (+) SA=Strongly Agree; A=Agree; UD=Undecided; DA= Disagree; SDA=Strongly Disagree
Administration of the scale
The final format of the attitude scale includes 15 selected statements, which have been randomly arranged in Table 2 to avoid response biases. Among these, five statements (numbers 2, 6, 8, 12, and 14) indicate an unfavorable attitude, while the remaining ten statements indicate a favorable attitude. Responses to these 15 statements can be collected using a five-point continuum of agreement and disagreement: strongly agree, agree, undecided, disagree, and strongly disagree. The respective weightings are 5, 4, 3, 2, and 1 for favorable statements, and 1, 2, 3, 4, and 5 for unfavorable statements. The total attitude score for each respondent is calculated by summing the scores of all statements based on their responses, resulting in a possible score range from 15 to 75.
Conclusion
The implementation of DAMUs services is crucial for the farming community to secure their livelihood. Farmers with a positive attitude towards the DAMUs project can engage more effectively and benefit from it, making it essential to accurately measure their attitudes. To achieve this, an attitude scale was developed using the 'Scale Product Method,' which combines Thurstone's technique of equal appearing interval scale for item selection and Likert's technique of summated rating. The scale development process included identifying relevant aspects, collecting pertinent items, and conducting relevancy and item analysis. The reliability and validity of the scale were thoroughly checked to ensure precision and consistency. Initially, 47 statements were selected, and through rigorous analysis, 15 statements were ultimately retained in the scale. This developed scale was found to be both reliable and valid.This scale can be used by other investigators in the context of Agricultural Universities or other organizations, with necessary modifications, to measure the attitudes of farmers towards the DAMUs project.
References
9 in the original paper- Chauhan CD, Patel JB. A scale to measure the attitude of member farmers of gram panchayat towards Pradhan Mantri Fasal Bima Yojana. Guj J Ext Edu. 2022;31(1):1-5.
- Edwards AL. Techniques of attitude scale construction. Bombay: Vekils, Feffer and Simons Private Ltd.; 1957.
- Eysenck HJ, Crown S. An experimental study in opinion attitude methodology. Int J Attitude Res. 1949;3:47-86.
- Jagadeeswari B, Vinaya Kumar HM, Patel JB. Attitude of postgraduate students towards research. Guj J Ext Edu. 2019;30(1):87-89.
- Maheswaran, Pandya RD. Development of scale on attitude of woman faculties towards professionalism. Guj J Ext Edu. 2022;33(2):1-4.
- Thurstone LL, Chave EG. The measurement of opinion. J Abnorm Psychol. 1928;22:415-30.
- Thurstone LL. The measurement of attitude. Am J Sociol. 1946;39:50. www.extensionjournal.com
- Vinaya Kumar HM, Patel JB, Chauhan NB. Attitude of farmers towards Agricultural Produce Market Committee. Guj J Ext Edu. 2018;29(2):224-226.
- Yeragorla V, Patel JB, Vinaya Kumar HM. Development of a scale to measure the attitude of extension personnel towards e-extension. Guj J Ext Edu. 2021;32(1):34-37.