
Research article · 2024 · Full text
International Journal of Agriculture and Food SciencePreparation and quality characterization of Singhara Gond Pak
Volume 6(2) · Pages 05–10 · DOI: 10.33545/2664844x.2024.v6.i2a.194 ↗
Research areasFood Science and Nutritional StudiesPhytochemicals and Medicinal PlantsAgricultural Economics and Practices
Abstract
Author-writtenWater chestnuts, commonly called as ‘Singhara’ are fruits grown in ponds, scientifically known as Trapa natans. The study was framed to standardized Singhara Gond Pak and to know quality parameters. The nutritional analysis of the selected sample B Singhara Pak where chestnut flour 50% and wheat flour 50% has a Carbohydrate of 89.82 g/100 gms, 1.43g/100 gms of Protein, 366.8 kcal/100 gms of Energy, 0.2 g/100 gms of Total Fats, 8.19 g/100 gms of Moisture, 0.36 g/100 gms of Ash and 5.7 g/100 gms of Crude Fibre. Mineral parameters where 55 mg/100 gms of Calcium and 1.46 g/100 gms of Iron. The results shown significant antioxidant activity, with a DPPH radical scavenging activity is [1278ppm], FRAP value is [9.798µmol], and ABTS radical scavenging activity is [76.05GAE/g], making it a promising food product with potential health benefits. Also, the microbial analysis showed the results such as for aerobic plate count below
Summary
Source-checkedPlain-language reading of the full paper, prepared with AI and checked against the text. Each point links to the authors' own words.
Why it matters
- Wheat Pak, also known as Sukhdi or Gond Pak, is a traditional Gujarati sweet valued for its flavor and warming properties during winter. View evidence ↗
- Singhara Gond Pak is a variation that uses chestnut flour and edible gums to support postpartum recovery and energy for lactating mothers. View evidence ↗
- Water chestnut flour is a gluten-free option that may provide cardiovascular and digestive health benefits. View evidence ↗
The question
- The researchers aimed to standardize the preparation of Singhara Gond Pak and evaluate its quality parameters. View evidence ↗
What they did
- A panel of 20 judges used a 7-point hedonic scale to evaluate the sensory attributes of the three samples. View evidence ↗
- Sensory data were analyzed using mean, standard deviation, and ANOVA with a significance level of P = 0.05. View evidence ↗
What they found
- Nutritional analysis of Sample B showed 89.82g/100g carbohydrates, 1.43g/100g protein, 366.8 kcal/100g energy, 0.2g/100g total fats, 8.19g/100g moisture, 0.36g/100g ash, and 5.7g/100g crude fiber. View evidence ↗
- Sample B contained 55 mg/100g of calcium and 1.46 mg/100g of iron. View evidence ↗
- Sample B exhibited significant antioxidant activity, with DPPH at 1278 ppm, FRAP at 9.798 µmol, and ABTS at 76.05 GAE/g. View evidence ↗
- Microbiological analysis showed aerobic plate counts and yeast/molds both below 10 CFU/g, and Enterobacteriaceae was absent. View evidence ↗
What it means
- The authors concluded that the 50:50 ratio of wheat to chestnut flour (Sample B) is the most preferred formulation. View evidence ↗
- The authors state that the product has a viable 30-day shelf life, making it a potential commercial food product. View evidence ↗
Visual summary
1 visualsIllustrations explain the paper; charts are replotted from the paper's own table values.
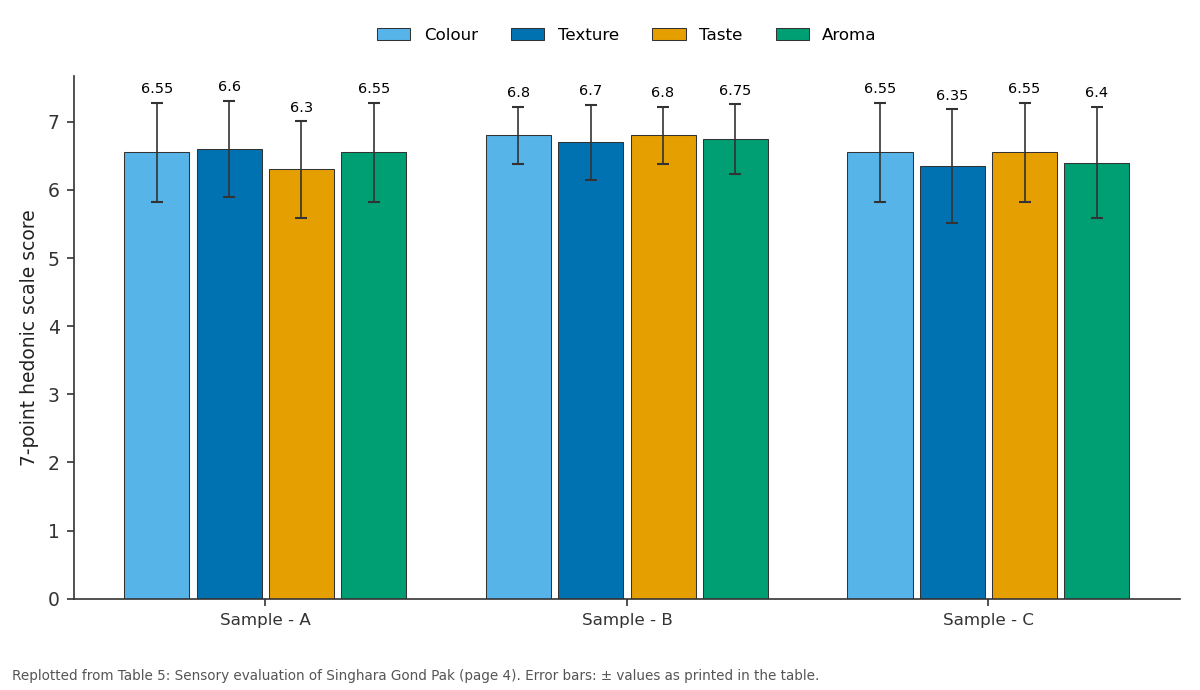
Colour and Texture and more: Sample - A vs Sample - B vs Sample - C
Replotted from Table 5 (page 4) of the original paper. Every bar is the paper's own table value.
View source evidence ↗Figures & tables
From the original paper Table 1
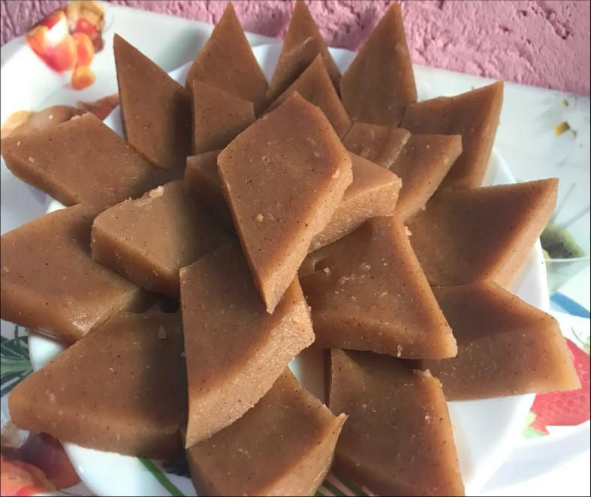 Figure 1
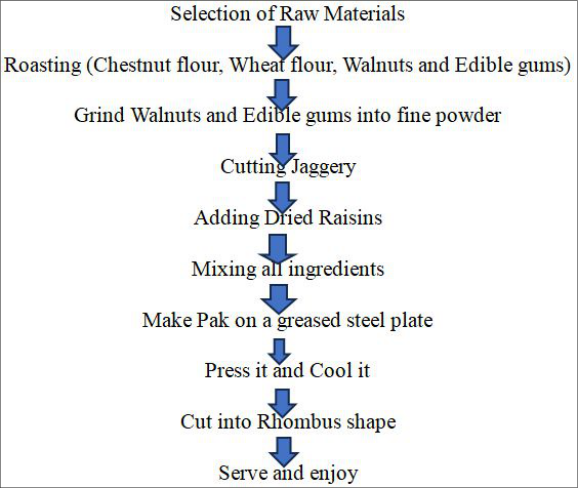 Figure 1
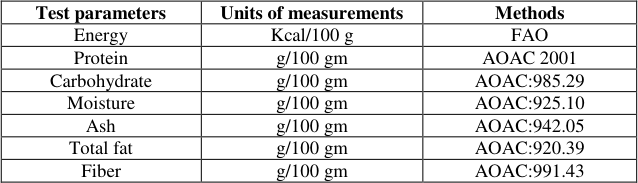 Table 2
 Table 3
 Table 4
 Table 5
 Table 6
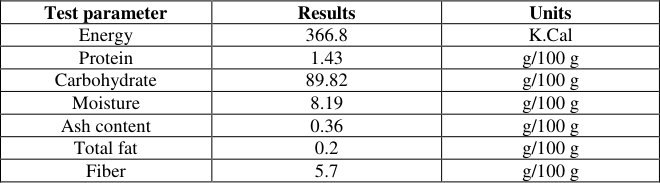 Table 7
 Table 8
 Table 9
 Table 10
Introduction
The history of Gujarati sweets is rich with cultural and culinary traditions, and one notable delicacy is "Wheat Pak", also known as "Sukhdi" or "Gond Pak". Traditionally made with wheat flour, jaggery and ghee, this sweet treat is a favorite during winters for its warming properties and delightful flavor. Often served at festivals and special occasions, its crispy texture and sweetness make it a beloved dessert for all ages (M. Tarla Dalal, 2024) [12] . An interesting variation, 'Singhara Gond Pak", incorporates chestnut flour and edible gums, offering benefits particularly for lactating mothers by boosting energy, enhancing milk supply and supporting postpartum recovery (Dr. Sharada Sphoorthi. Y, 2023) [19] . Indian water chestnut flour, or "Singhare ka Atta", holds significant cultural and culinary importance, especially during religious fasting periods like Navratri. This gluten-free flour is rich in essential nutrients and offers numerous health benefits, including improved cardiovascular and digestive health (Singh, 2015) [19] . Wheat flour, a staple in Indian cuisine, is versatile and essential for making traditionally breads like chapati and roti (Goyal & Choudhary, 2018) [16] . Jaggery, an unrefined sugar, is valued for its distinct flavor and nutritional benefits (Patil & Patil, 2020; Kumar & Reddy, 2019) [17,18] . Ghee, a clarified butter, is renowned for its rich taste and health properties (Desai & Kapadia, 2020: Kumar & Kumar, 2019) [13,18] . By the above literature aimed to study the preparation and quality characterization of Singhara Gond Pak. and cook, stirring continuously, on medium heat, till fragrant. Side by side, heat 2-3 tsp water in another pan, add jaggery and let it melt. Roast walnut and edible gums and grind them into a fine powder. Add the roasted flour in a large bowl and then add walnuts and edible gums powder and mix well. Pour the jaggery syrup and mix till well combined. Add dried raisins. Once the temperature of this reduces slightly then grease your steel plate with some ghee. Place the mixture on the greased plate. Press it and cool it at room temperature. Cut it into rhombus shape. Serve and enjoy.
Organoleptic evaluation
The sensory evaluation was carried out three samples of singhara gond pak prepared Sample A, B and C by using a 7-point hedonic scale with panel of 20 judges considering 6 parameters such as colour, texture, aroma, taste, appearance, overall acceptability and identified best scores sample, the best score identified sample carried out for further analysis.
Nutritional evaluation
Proximate analysis is a set of methods used to determine the nutritional composition of a food sample. It involves the measurement of various components such as energy, moisture, protein, fat, carbohydrates, ash and fiber.
Energy determination
The energy present in the selected sample was calculated and presented in the table. Energy content of the food product was determined using the FAO method. (Food and Agriculture Orgaization of the United Nations, 2003).
Protein determination
The AOAC 2001 by using Kjeldahl method, which is used for the determination of protein in the selected food sample.
(AOAC International, 2001). Protein (%) = (N x 6.25) / Sample weight (g)
Carbohydrates determination
The AOAC 985.29 by using high-performance liquid chromatography (HPLC) method, which is used for the determination of carbohydrates in the selected food sample.
(AOAC International, 2022).
Moisture determination
The AOAC 925.10 21 st Edition is a method for determining the moisture content in the selected food sample by air oven dry method. (AOAC International, 2022).
Moisture content (%) = [(Initial weight (W1) -Final weight(W2))/ Initial weight (W1)] x 100.
Ash Determination
The AOAC 942.05 is a method for determination of ash content in the selected food sample by gravimetric method.
(AOAC International, 2022).
Ash content (%) = (Weight of ash/ Weight of the sample) x 100.
Fat Determination
The AOAC (Association of Official Agricultural Chemists) 20 th Edition 2016 method (920.39) by gravimetric determination, which is used for the determination of fat in selected food sample. (AOAC International, 2019).
Fat (%) = (Weight of extracted fat/ Weight of the sample) x 100.
Fiber Content
The AOAC 991.43 is a method for determination of total fiber content in the selected food sample by enzymaticgravimetric method. (AOAC International, 2022).
Total Dietary Fiber % (TDF) = [Initial weight of the sample (W1) -Weight of the protein residue (W2) -Weight of the ash residue(W3) + Weight of the filtered fiber residue (W4)] / Initial weight of the sample (W1) x 100 The assessment of calcium and iron concentrations in the samples was conducted (Table 3). Calcium levels were quantified using the AOAC method 984.27, Similarly, iron content was analyzed employing AOAC method 985.35.
| Test parameters | Units of measurements | Methods |
|---|---|---|
| Calcium | mg/100 gm | AOAC 984.27 |
| Iron | mg/100 gm | AOAC 985.35 |
Table text extracted from the original PDF; superscript letters are shown inline. The original table image is below.
View original table image
Calcium (Ca):
The AOAC 984.27 is a method for determination of calcium content in the selected food sample by Atomic Absorption Spectroscopy (AAS). (AOAC International, 2022).
Antioxidant analysis of singhara gond pak
The antioxidant activity of food samples was evaluated using assays: DPPH (2,2-diphenyl-1-picrylhydrazyl), FRAP (Ferric Reducing Antioxidant Power), and ABTS (2,2'azinobis(3-ethylbenzothiazoline-6-sulfonic acid)) assays. Each assay was conducted following standardized procedures. [11] FRAP µmol Fe +2 /g Benzie & Strain (1996) [10] ABTS GAE/g Re et al., 1999 [1] DPPH methods: (2,2-Diphenyl-1-picryhydrazyl) is a method for determination of antioxidant activity in the selected food sample. (Brand-Williams et al., 1995) [11] .
Antioxidant activity (%) = [(Absorbance of the DPPH solution without sample -Absorbance of the DPPH solution with sample) / Absorbance of the DPPH solution without sample control] x 100 FRAP method: (Ferric Reducing Antioxidant Power) is a method for determination of antioxidant activity in the selected food sample. (Benzie and Strain, 1996) [10] .
FRAP value (µmol TE/g) = (Absorbance of the sample-Absorbance of the blank) / (Absorbance of the Trolox standard -Absorbance of the blank) x Concentration of Trolox standard (µmol/ml) x Dilution factor ABTS method: (2,2'-Azino-bis (3-ethylbenzothiazoline-6sulfonic acid)) is a method for determination of antioxidant activity in the selected food sample. (Re et al., 1999) [1] .
ABTS value (µmol TE/g) = (Absorbance of the sample-Absorbance of the blank) / (Absorbance of the Trolox standard -Absorbance of the blank) x Concentration of Trolox standard (µmol/ml) x Dilution factor
Microbiological analysis
Microbial analysis such as aerobic plate count, yeast & molds and Enterobacteriaceae was carried out for 30 days of study by procedure followed by Indian standard method.
(FSSAI Manual, 2 nd Edn. 2022).
Statistical analysis
Data obtained from sensory analysis is subjected to mean and standard deviation and it was statistically calculated by ANOVA using a significance of P value 0.05.
Results and Discussion
Results and Discussion
Sensory evaluation
The mean and standard deviation of the sensory scores for different parameters in terms of Colour, sample A has a mean value of 6.55 with a standard deviation of 0.73 while sample B has a mean value of 6.80 with a standard deviation of 0.42 and sample C has a mean value of 6.55 with a standard deviation of 0.73 (Table 5). Regarding Texture, sample A has a mean value 6.60 with a standard deviation of 0.71, while sample B has a mean value 6.70 with a standard deviation of 0.55 and sample C has a mean value 6.35 with a standard deviation of 0.83. Further Taste, sample A has a mean value 6.30 with a standard deviation of 0.71, while sample B has a mean value of 6.80 with a standard deviation of 0.42 and sample C has a mean value of 6.55 with a standard deviation of 0.73. In terms of Aroma, sample A has a mean value 6.55 with a standard deviation of 0.73 while sample B has a mean value 6.75 with a standard deviation of 0.51 and sample C has a mean value 6.40 with a standard deviation of 0.82. For Appearance, sample A has a mean value 6.45 with a standard deviation of 0.76, while sample B has a mean value 6.65 with a standard deviation of 0.58, and sample C has a mean value 6.30 with a standard deviation of 0.86. These measurements provide an assessment of the sensory attributes for three samples A, B and C. Sample B generally tends to have higher mean value across all attributes, indicating a potentially better sensory experience compared to sample A and C. 7). [12] .
| Sample | Colour | Texture | Taste | Aroma | Appearance | Overall acceptability |
|---|---|---|---|---|---|---|
| Sample - A | 6.55±0.73 | 6.60±0.71 | 6.30±0.71 | 6.55±0.73 | 6.45±0.76 | 6.58±0.72 |
| Sample - B | 6.80±0.42 | 6.70±0.55 | 6.80±0.42 | 6.75±0.51 | 6.65±0.58 | 6.75±0.51 |
| Sample - C | 6.55±0.73 | 6.35±0.83 | 6.55±0.73 | 6.40±0.82 | 6.30±0.86 | 6.40±0.83 |
Table text extracted from the original PDF; superscript letters are shown inline. The original table image is below.
View original table image
Mineral analysis of singhara gond pak (sample B)
Calcium Content results showed significant calcium content in the selected food sample is 55 mg/100 gms. Iron Content results showed significant iron content in the selected food sample is 1.46 mg/100 gms. Compared to wheat Pak calcium is 6.1 mg is lower than Singhara Gond Pak and iron is 0.4 mg is higher in Singhara Gond Pak. (M. Tarla Dalal, 2024) [12] .
Microbiological analysis of singhara gond pak
The microbial analysis was performed such as aerobic plate count as <10 CFU/g, yeast & molds as <10 CFU/g and Enterobacteriaceae showing the results as absent respectively (Table 10). (FSSAI Manual, 2 nd Edn. 2022).
| Test parameters | Results | Units |
|---|---|---|
| Aerobic plate count | <10 | CFU/g |
| Yeast & molds | <10 | CFU/g |
| Enterobacteriaceae | Absent | CFU/g |
Table text extracted from the original PDF; superscript letters are shown inline. The original table image is below.
View original table image
Conclusion
This study successfully created Singhara Gond Pak with improved nutritional benefits and longer shelf life by combining Wheat flour with Chestnut flour in various ratios. Among the three samples tested organoleptically, the sample B i.e 50:50 (Wheat flour: Chestnut flour) ratio was determined to be the most preferred. The nutritious blend, showcasing superior antioxidant and microbial properties. This blend demonstrated an impressive 30-day shelf life with minimal activity, indicating its potential as a viable commercial food product. The results of this study emphasize the potential of Wheat and Chestnut flour blends in developing nutritious and long-lasting food items, offering a valuable contribution to both food industry and consumers.
Figures and tables from the paper
| Sample Name | Wheat Flour (g) | Chestnut Flour (g) | Walnuts (g) | Edible Gums (g) | Jaggery (g) | Dried Raisins (g) |
|---|---|---|---|---|---|---|
| Sample A | 30 g | 20 g | 15g | 10 g | 15g | 10 g |
| Sample B | 25 g | 25 g | 15 g | 10 g | 15 g | 10 g |
| Sample C | 20 g | 30 g | 15g | 10 g | 15g | 10 g |
Table text extracted from the original PDF; superscript letters are shown inline. The original table image is below.
View original table image
| Test parameters | Units of measurements | Methods |
|---|---|---|
| Energy | Kcal/100 g | FAO |
| Protein | g/100 gm | AOAC 2001 |
| Carbohydrate | g/100 gm | AOAC:985.29 |
| Moisture | g/100 gm | AOAC:925.10 |
| Ash | g/100 gm | AOAC:942.05 |
| Total fat | g/100 gm | AOAC:920.39 |
| Fiber | g/100 gm | AOAC:991.43 |
Table text extracted from the original PDF; superscript letters are shown inline. The original table image is below.
View original table image
| Antioxidant activity | Units | Method |
|---|---|---|
| DPPH | ppm | Brand-Williams et al., 1995 [11] |
| FRAP | µmol Fe +2 /g | Benzie & Strain (1996) [10] |
| ABTS | GAE/g | Re et al., 1999 [1] |
Table text extracted from the original PDF; superscript letters are shown inline. The original table image is below.
View original table image
| Source of variation | Sum of Squares | Degrees of Freedom | Mean Square | F-Statistic | P-Value | F Crit |
|---|---|---|---|---|---|---|
| Between groups | 0.562 | 2 | 0.263 | 0.575 | 0.575 | 3.885 |
| Within groups | 7.639 | 15 | 0.510 | |||
| Total | 8.165 | 17 |
Table text extracted from the original PDF; superscript letters are shown inline. The original table image is below.
View original table image
| Test parameter | Results | Units |
|---|---|---|
| Energy | 366.8 | K.Cal |
| Protein | 1.43 | g/100 g |
| Carbohydrate | 89.82 | g/100 g |
| Moisture | 8.19 | g/100 g |
| Ash content | 0.36 | g/100 g |
| Total fat | 0.2 | g/100 g |
| Fiber | 5.7 | g/100 g |
Table text extracted from the original PDF; superscript letters are shown inline. The original table image is below.
View original table image
| Test parameter | Results | Units |
|---|---|---|
| Calcium | 55 | mg/100 gm |
| Iron | 1.46 | mg/100 gm |
Table text extracted from the original PDF; superscript letters are shown inline. The original table image is below.
View original table image
| S. No. | Test parameters | Units | Results |
|---|---|---|---|
| 1. | DPPH | Ppm | 1278 |
| 2. | FRAP | µmol | 9.798 |
| 3. | ABTS | GAE/g | 76.05 |
Table text extracted from the original PDF; superscript letters are shown inline. The original table image is below.
View original table image
References
9 in the original paper- Re R, Pellegrini N, Proteggente A, Pannala A, Yang M, Rice-Evans C. Antioxidant activity applying an improved ABTS radical cation decolorization assay. Free Radic Biol Med. 1999;26(9-10):1231-1237.
- Benzie IFF, Strain JJ. The ferric reducing ability of plasma (FRAP) as a measure of antioxidant power: The FRAP assay. Anal Biochem. 1996;239(1):70-76. DOI: 10.1006/abio.1996.0292.
- Brand-Williams W, Cuvelier ME, Berset C. Use of a free radical method to evaluate antioxidant activity. LWT Food Sci. Technol. 1995;28(1):25-30. DOI: 10.1016/S0023-6438(95)80008-5.
- Dalal T. Golpapdi, Gujarati Gol Papdi Recipe. Tarla Dalal. [cited 2024 Jun 23]. Available from:.
- Desai HK, Kapadia VB. Nutritional and therapeutic aspects of ghee. J Food Sci. Technol. 2020;57(3):96573.
- Goyal SK, Choudhary AK. Quality characteristics of Indian wheat varieties and their suitability for different end-products. J Food Sci. Technol. 2018;55(7):26602669.
- Patil PD, Patil PB. Nutritional and medicinal values of jaggery. Int J Chem. Stud. 2020;8(1):19-22.
- Singh RB, Saini A, Kaushik S, Sharma S, Kumar R, Singh S. Nutritional value of water chestnut flour and International Journal of Agriculture and Food Science https://www.agriculturaljournals.com its food applications. J Food Sci. Technol. 2015;52(6):3350-3355. DOI: 10.1007/s13197-014-1385-7. Available from: https://doi.org/10.1007/s13197-014-1385-7
- Sphoorthi YS. Benefits of Singhara Gond Pak for lactating mothers. J Nutr Health. 2023;15(2):112-118. DOI: 10.1234/jnh.2023.112. Available from: https://doi.org/10.1234/jnh.2023.112