
Research article · 2024 · Full text
International Journal of Agriculture Extension and Social DevelopmentKnowledge of farmers towards improved green gram production practices in Mayurbhanj district of Odisha
Volume 7(8S) · Pages 07–10 · DOI: 10.33545/26180723.2024.v7.i8sa.890 ↗
Research areasAgricultural Economics and PracticesLivestock Management and Performance ImprovementAgricultural Systems and Practices
Abstract
Author-writtenThe present study was conducted in Mayurbhanj district of Odisha to assess farmer’s knowledge regarding improved green gram production practices. The researcher purposively selected 120 respondents from 6 villages under Shyamakhunta block, focusing on areas with high number of green gram growers. The study findings revealed that the majority of respondents belong to various socio-economic profiles. Most of the respondents fall within age of 36-55 years (42.50%) having highest male respondents (52.50%) belongs to OBC caste (66.67%), have family size upto 5 member (63.33%), having nuclear family type (60%), have high school (39.16%), lived in cemented house (87.56%), exclusively engaged in farming (50.75%), having income upto 48000 (58.55%). Source of information, risk bearing capacity, progressiveness and mass media exposure were at a medium level for 73.24%, 65.73%, 41.67% & 51.66% whereas scientific orientation were at a low level for 51.45%. Regarding knowledge, the study found that the highest level of knowledge was about field preparation (91.67%) and overall a majority of respondents (76.66%) have medium level of knowledge. The study also revealed significant and positive correlation between various variables and farmer’s knowledge of recommended green gram production practices. Age, gender, risk bearing capacity, scientific orientation, mass media exposure had shown a highly significant correlation with knowledge towards recommended green gram production practices.
Summary
Source-checkedPlain-language reading of the full paper, prepared with AI and checked against the text. Each point links to the authors' own words.
Why it matters
- Agriculture is a critical pillar of the Indian economy, providing a livelihood for approximately 65% to 70% of the country's labor force. View evidence ↗
- Green gram is a valuable crop because it provides high-quality protein, serves as green manure, and can be used as cattle feed. View evidence ↗
- As a legume, green gram helps prevent soil erosion and can fix 30-40 kg of atmospheric nitrogen per hectare. View evidence ↗
The question
- The objective of this study was to measure the level of knowledge farmers have regarding improved production practices for green gram. View evidence ↗
What they did
- The study was conducted in the Shyamakhunta block of the Mayurbhanj district in Odisha, involving 120 purposively selected respondents from six villages. View evidence ↗
- Researchers used a descriptive design, collecting data through personal interviews and a pre-structured interview schedule conducted at the farmers' homes or fields. View evidence ↗
- The collected data were analyzed using statistical tools to determine frequency and percentage distributions. View evidence ↗
What they found
- The typical respondent was a male (52.50%) from the OBC caste (66.67%), aged 36-55 (42.50%), living in a cemented house (87.56%) with a nuclear family (60%) of up to 5 members (63.33%), educated to high school (39.16%), exclusively farming (50.75%), and earning up to 48,000 (58.55%). View evidence ↗
- Most farmers showed medium levels of source of information (73.24%), risk bearing capacity (65.73%), progressiveness (41.67%), and mass media exposure (51.66%), while over half (51.45%) had a low level of scientific orientation. View evidence ↗
- The highest level of specific knowledge among respondents was related to field preparation, with 91.67% providing fully correct answers. View evidence ↗
- Factors such as age, gender, house type, source of information, scientific orientation, risk bearing capacity, progressiveness, and mass media exposure were all positively and significantly correlated with the farmers' knowledge of recommended practices. View evidence ↗
What it means
- The authors conclude that most farmers in the study area have only a medium level of knowledge regarding improved green gram production practices. View evidence ↗
Visual summary
1 visualsIllustrations explain the paper; charts are replotted from the paper's own table values.
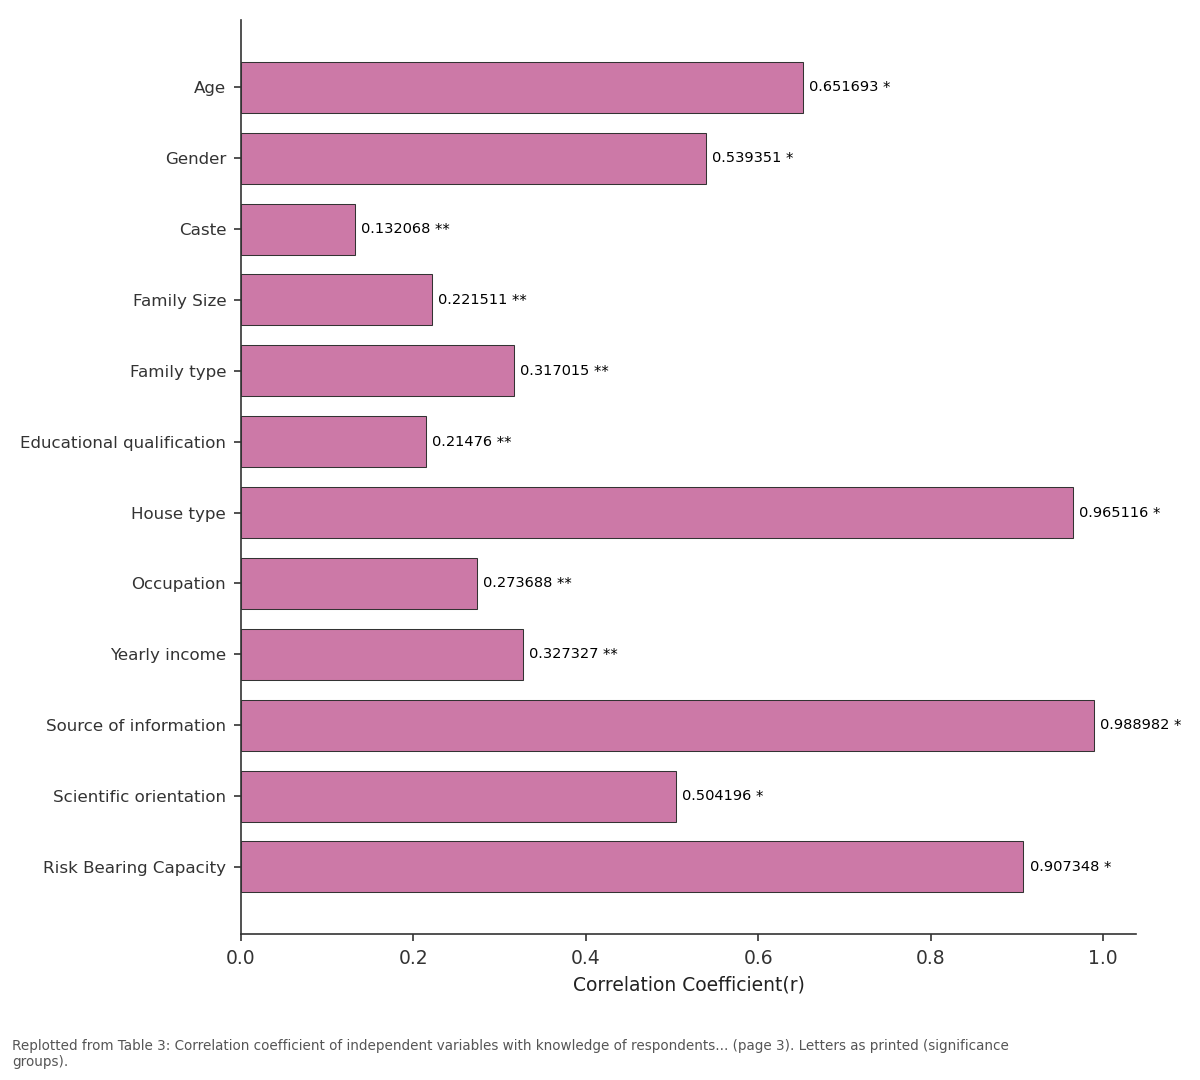
Correlation Coefficient(r): Age vs Gender vs Caste vs Family Size vs Family type
Replotted from Table 3 (page 3) of the original paper. Every bar is the paper's own table value.
View source evidence ↗Figures & tables
From the original paper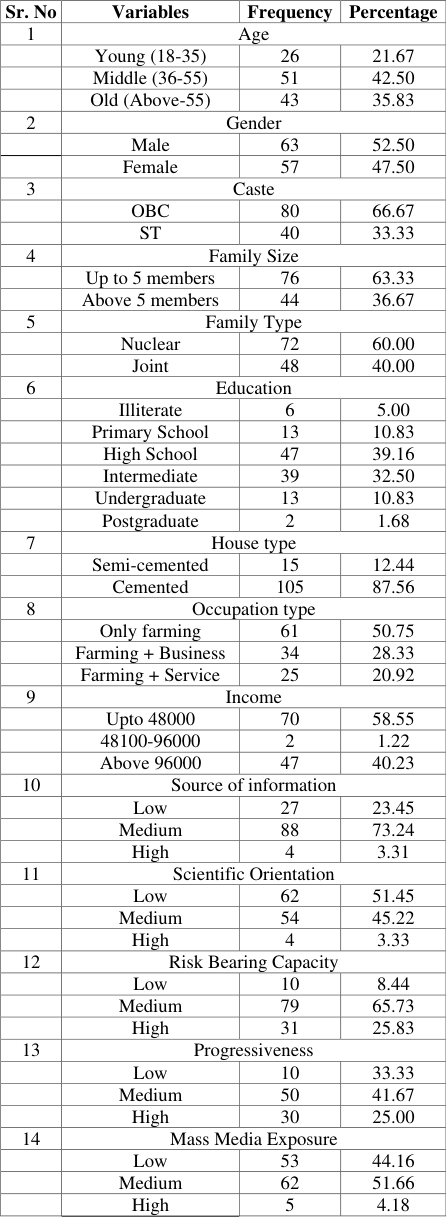 Table 1
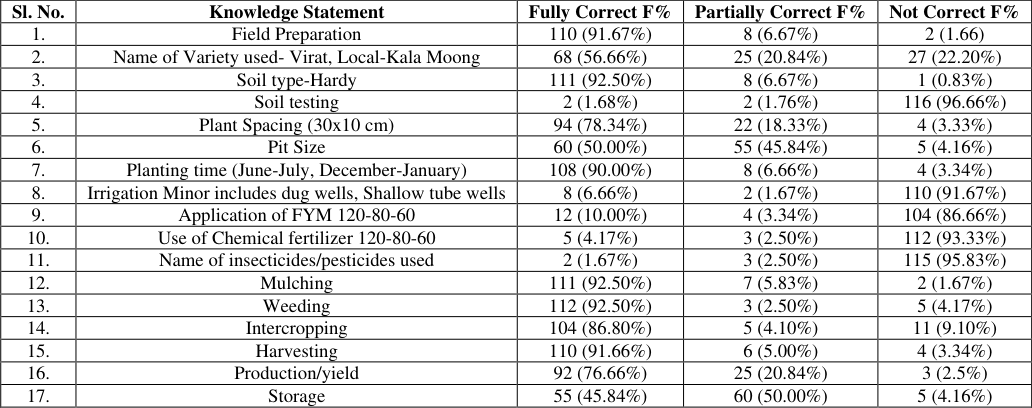 Table 2
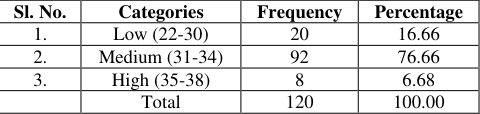 Table 3
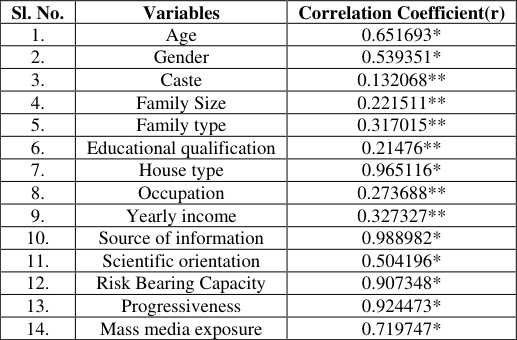 Table 3
Introduction
Agriculture has always played a significant role in Indian Economy. The great significance of agriculture in the country's economy is well understood by the fact that it is the mainstay of the people. India is predominantly an agricultural country, as more than 58.00 percent of its population is living in villages and the majority of them are engaged in the agricultural enterprise. Agriculture is the backbone of our country and has a prime role in Indian economy. This sector provides livelihood to about 65 percent to 70 percent of the labour force. Agriculture not only provides food for growing population but also contributes around 14.60 percent ages of country's GDP with tremendous domestic and export potential. Green gram (Vigna radiata L.) is commonly known as "mung" or "mung bean". It belongs to the family Leguminosae and subfamily Papilionaceae. Green gram is a native of India and central Asia and has grown in these regions since prehistoric times. The total area covered under pulses in India was 28.63 million hectares and production was 23.22 million tones with a productivity of 811 kg/ha. The total area covered under green gram in India was 4.25 million hectares and production was 2.41 million tones with a productivity of 567 kg/ha. Green gram is one of the important pulse crop in India. It has been stated that Green Gram is cultivated in India since ancient times. Green Gram is a native of India and Central Asia and grown in these regions since prehistoric times. It is widely cultivated in Asia including India, Pakistan, Bangladesh, Sri Lanka, Thailand, Cambodia, Vietnam etc. Green gram is commonly named as mung bean. Most important kharif season pulse crop in India. Green gram is excellent source of high quality protein. It is used as green manuring crop. It can also be used as a feed for cattle even husk of the seed can be soaked in water and used as cattle feed. Green gram is rich source of Riboflavin, Thiamine and Vitamin C. It is a leguminous crop that has capacity to fix atmospheric nitrogen (30-40 kg N/ha). It also helps in preventing soil erosion. In North India, it is cultivated in both Kharif and summer seasons and in South India, it is cultivated in rabi season. Green gram is grown in India in kharif, rabi, summer and also a catch crop between two main seasons. It is also being grown for green manure, which may be continued for grain, if rainfall is not sufficient for planting rice. It is a drought resistant crop and suitable for dryland farming. It is predominantly used as an intercrop www.extensionjournal.com with crops like cotton and red gram. It is also used as intercrop with fruit crops like mango, citrus. In Odisha green gram is cultivated in the districts of Ganjam, Puri, Khordha, Cuttack, Nayagarh, Balasore, Kendrapara and Mayurbhanj. In Mayurbhanj it is mainly cultivated in the blocks of Kuliana, Bangiriposhi, Badasahi and Shyamakhunta. The biological value improves greatly, when wheat or rice is combined with green gram because of the complementary relationship of the essential amino acids such as lysine and sulphur containing amino acids methionine and cysteine. It is also used as nutritive fodder, specially for milch animals. Green gram also have medicinal properties, like curing diabetes, sexual dysfunction, nervous disorder, hair disorders, digestive system disorders and rheumatic affections. It is valued for its high digestibility and freedom from flatulence effect. Green gram is grown as sole crop, mixed crop, catch crop or sequential crop under rainfed or semi irrigated condition in kharif and spring/summer season. It is a tropical crop and it requires hot and humid climate. It can also tolerate high temperature.
Pulses have excellent source of high quality protein, essential amino acids, fatty acids, minerals and vitamins for millions of Indians. In addition, pulses also play an important role in improving soil health, long term fertility and sustainability of the cropping systems. Suitable for dryland farming and predominantly used as an intercrop with other crops.
Research Methodology
The present study was conducted in Mayurbhanj district of Odisha. Atotal 120 respondents were selected from 6 villages of one block i.e., Shyamakhunta in Mayurbhanj district. Personal interview method was utilized by the investigator himself, either at their home or at their field. Descriptive research design has been used in the present study. The data collected from the respondents by using prestructured interview schedule. Data analysis is done through frequency and percentage distribution using statistical tools. For calculating percentage, frequency was multiplied by 100 and divided by total number of respondents.
Objective
To measure the knowledge of improved green gram production practices by the respondents.
Results and Discussion
The data presented in Table 1 revealed that majority of green gram growers (42.50%) were of middle age group followed by old age group (35.83%) and young age group (21.67%). It also stated that 52.50 percent were of female and 47.50 percent were of male. Around 66.67 percent belonged to OBC category whereas 33.33 percent belonged to ST category and (63.33%) belongs to upto 5 members family size whereas (36.67%) belongs to above 5 members family size. 60 percent belongs to nuclear family type and 40 percent belongs to joint family type. Majority of the respondents were found to be literate were educated upto high school (39.16%) and intermediate (32.50%) whereas 10.83 percent were educated upto primary school and undergraduate, 1.68 percent were educated upto postgraduate and 5 percent were illiterate. [12] . [2] . www.extensionjournal.com
| Sr. No | Variables | Frequency | Percentage |
|---|---|---|---|
| 1 | Age | ||
| Young (18-35) | 26 | 21.67 | |
| Middle (36-55) | 51 | 42.50 | |
| Old (Above-55) | 43 | 35.83 | |
| 2 | Gender | ||
| Male | 63 | 52.50 | |
| Female | 57 | 47.50 | |
| 3 | Caste | ||
| OBC | 80 | 66.67 | |
| ST | 40 | 33.33 | |
| 4 | Family Size | ||
| Up to 5 members | 76 | 63.33 | |
| Above 5 members | 44 | 36.67 | |
| 5 | Family Type | ||
| Nuclear | 72 | 60.00 | |
| Joint | 48 | 40.00 | |
| 6 | Education | ||
| Illiterate | 6 | 5.00 | |
| Primary School | 13 | 10.83 | |
| High School | 47 | 39.16 | |
| Intermediate | 39 | 32.50 | |
| Undergraduate | 13 | 10.83 | |
| Postgraduate | 2 | 1.68 | |
| 7 | House type | ||
| Semi-cemented | 15 | 12.44 | |
| Cemented | 105 | 87.56 | |
| 8 | Occupation type | ||
| Only farming | 61 | 50.75 | |
| Farming + Business | 34 | 28.33 | |
| Farming + Service | 25 | 20.92 | |
| 9 | Income | ||
| Upto 48000 | 70 | 58.55 | |
| 48100-96000 | 2 | 1.22 | |
| Above 96000 | 47 | 40.23 | |
| 10 | Source of information | ||
| Low | 27 | 23.45 | |
| Medium | 88 | 73.24 | |
| High | 4 | 3.31 | |
| 11 | Scientific Orientation | ||
| Low | 62 | 51.45 | |
| Medium | 54 | 45.22 | |
| High | 4 | 3.33 | |
| 12 | Risk Bearing Capacity | ||
| Low | 10 | 8.44 | |
| Medium | 79 | 65.73 | |
| High | 31 | 25.83 | |
| 13 | Progressiveness | ||
| Low | 10 | 33.33 | |
| Medium | 50 | 41.67 | |
| High | 30 | 25.00 | |
| 14 | Mass Media Exposure | ||
| Low | 53 | 44.16 | |
| Medium | 62 | 51.66 | |
| High | 5 | 4.18 |
Table text extracted from the original PDF; superscript letters are shown inline. The original table image is below.
View original table image
Association of selected independent variables with dependent variables
Association of selected independent variables with dependent variables
Conclusion
It is concluded that majority of the respondents having middle-aged engaged in farming. Most of them were found to be literate, farming was the main occupation, earning an annual income of upto Rs. 48000. Majority of respondents belong to OBC caste with upto 5 members family type belongs to joint family type. The study reveals that farmers hold a medium knowledge level (76.66%) towards improved green gram production practices followed by low level (16.66%) and high level (6.68%). Variables namely age, gender, caste, family size, age, educational qualification, house type, occupation, source of information, scientific orientation, risk bearing capacity, mass media exposure were positively and significantly correlated with knowledge of respondents towards recommended green gram production practices at 0.01% level of probability.
Figures and tables from the paper
| Sl. No. | Knowledge Statement | Fully Correct F% | Partially Correct F% | Not Correct F% |
|---|---|---|---|---|
| 1. | Field Preparation | 110 (91.67%) | 8 (6.67%) | 2 (1.66) |
| 2. | Name of Variety used- Virat, Local-Kala Moong | 68 (56.66%) | 25 (20.84%) | 27 (22.20%) |
| 3. | Soil type-Hardy | 111 (92.50%) | 8 (6.67%) | 1 (0.83%) |
| 4. | Soil testing | 2 (1.68%) | 2 (1.76%) | 116 (96.66%) |
| 5. | Plant Spacing (30x10 cm) | 94 (78.34%) | 22 (18.33%) | 4 (3.33%) |
| 6. | Pit Size | 60 (50.00%) | 55 (45.84%) | 5 (4.16%) |
| 7. | Planting time (June-July, December-January) | 108 (90.00%) | 8 (6.66%) | 4 (3.34%) |
| 8. | Irrigation Minor includes dug wells, Shallow tube wells | 8 (6.66%) | 2 (1.67%) | 110 (91.67%) |
| 9. | Application of FYM 120-80-60 | 12 (10.00%) | 4 (3.34%) | 104 (86.66%) |
| 10. | Use of Chemical fertilizer 120-80-60 | 5 (4.17%) | 3 (2.50%) | 112 (93.33%) |
| 11. | Name of insecticides/pesticides used | 2 (1.67%) | 3 (2.50%) | 115 (95.83%) |
| 12. | Mulching | 111 (92.50%) | 7 (5.83%) | 2 (1.67%) |
| 13. | Weeding | 112 (92.50%) | 3 (2.50%) | 5 (4.17%) |
| 14. | Intercropping | 104 (86.80%) | 5 (4.10%) | 11 (9.10%) |
| 15. | Harvesting | 110 (91.66%) | 6 (5.00%) | 4 (3.34%) |
| 16. | Production/yield | 92 (76.66%) | 25 (20.84%) | 3 (2.5%) |
| 17. | Storage | 55 (45.84%) | 60 (50.00%) | 5 (4.16%) |
Table text extracted from the original PDF; superscript letters are shown inline. The original table image is below.
View original table image
| Sl. No. | Categories | Frequency | Percentage |
|---|---|---|---|
| 1. | Low (22-30) | 20 | 16.66 |
| 2. | Medium (31-34) | 92 | 76.66 |
| 3. | High (35-38) | 8 | 6.68 |
| Total | 120 | 100.00 |
Table text extracted from the original PDF; superscript letters are shown inline. The original table image is below.
View original table image
| Sl. No. | Variables | Correlation Coefficient(r) |
|---|---|---|
| 1. | Age | 0.651693* |
| 2. | Gender | 0.539351* |
| 3. | Caste | 0.132068** |
| 4. | Family Size | 0.221511** |
| 5. | Family type | 0.317015** |
| 6. | Educational qualification | 0.21476** |
| 7. | House type | 0.965116* |
| 8. | Occupation | 0.273688** |
| 9. | Yearly income | 0.327327** |
| 10. | Source of information | 0.988982* |
| 11. | Scientific orientation | 0.504196* |
| 12. | Risk Bearing Capacity | 0.907348* |
| 13. | Progressiveness | 0.924473* |
| 14. | Mass media exposure | 0.719747* |
Table text extracted from the original PDF; superscript letters are shown inline. The original table image is below.
View original table image
References
12 in the original paper- Arunachalam R. Spread and acceptance of recommended production technologies in green gram and black gram: a comparative analysis. Legume Res. 2011;34(1):8-13.
- Boora SK, Kaur B, Tyagi R, Bishnoi DK, Manisha, Rohit. Extent of adoption of intercropping practices among farmers of Haryana. Indian J Ext Educ. 2023;59(1):24-27.
- Devi Ganga M, Kumar Ch A, Srinivas Kumar D. Impact analysis of trainings and front line demonstrations in black gram (Vigna mungo) cultivation. J Krishi Vigyan. 2017;6(1):97-100.
- Devi MG, Kumar CA, Kumar DS. Impact analysis of trainings and front line demonstrations in black gram (Vigna mungo) cultivation. J Krishi Vigyan. 2017;6(1):97-100.
- Dhayal BL, Mehta BM. Study on knowledge and adoption of greengram production technology by farmers in Chhotaudaipur district of Gujarat. Agric Update. 2015;10(4):318-22.
- Kassem Alotaibi, Aldosri M, Muddassir. Exploring the relationship between information-seeking behaviour and adoption of biofertilizers among onion farmers. Agronomy. 2021;11(6):1258.
- Mohanty AK, Lepch B, Kumar A. Constraints analysis in adoption of vegetable production technologies for livelihood perspective of tribal farmers in North Sikkim. Indian Res J Ext Educ. 2013;13(2):51-56.
- Roy SK, Singh AK, Singh NJ. Water productivity of major pulses: A review. Agric Water Manage. 2023;281:108249.
- Sailo Z, Longkumer J, Ozukum L, Sangtam SM. Technological gap in adoption of improved oil palm cultivation practices by oil palm growers in Kolasib district of Mizoram. Int J Agric Sci Res. 2021;11(1):5964.
- Sathuragiri V, Muthumani K. A study of production problems faced by coconut farmers in Theni district confront. Ilkogretim Online -Elem Educ Online. 2020;19(4):7283-300.
- Yadav BC, Choudhary R, Saran PL. Adoption of improved production technology of mandarin in Rajasthan, India: A review. Afr J Agric Res. 2013;8(49):6590-600.
- Yanos MA, Leal RC. Mung bean (Vigna radiata) as a source of income among farmers. J Bus Econ Rev. 2020;5(1):10-17.