
Research article · 2024 · Full text
International Journal of Agriculture Extension and Social DevelopmentAttitude of trainees and non-trainees towards training activities conducted by Krishi Vigyan Kendra in East Champaran district of Bihar
Volume 7(8) · Pages 139–143 · DOI: 10.33545/26180723.2024.v7.i8b.887 ↗
Research areasEmotional Intelligence and PerformanceLivestock Management and Performance ImprovementEducational Challenges and Innovations
Abstract
Author-writtenThis study examines the effectiveness of Krishi Vigyan Kendra (KVK) training programs by assessing farmers' attitudes, knowledge levels, and the relationship between socio-economic profiles and training outcomes. Data from trainees and non-trainees reveal mixed perceptions, with significant about the practical benefits and inclusivity of KVK training. While many respondents were undecided or disagreed about KVK's support effectiveness, there was positive feedback regarding the performance of KVK scientists and demonstration programs. Trainees generally had more positive attitudes, with 18.33% showing low attitudes compared to 43.33% of non-trainees, and 30.00% of trainees exhibiting high attitudes versus 25.00% of non-trainees. Correlation analysis indicated that socio-economic factors such as education and social participation significantly influenced attitudes, highlighting the need for KVK to enhance practical support and inclusivity to better serve all farmers. This study investigates farmer attitudes toward training programs, highlighting their critical impact on engagement and adoption of agricultural practices. It finds that positive attitudes toward training are associated with increased participation and successful implementation of new techniques, while negative attitudes can hinder these outcomes. The research emphasizes the importance of addressing farmers' perceptions and concerns to enhance the effectiveness of training initiatives and improve overall agricultural productivity.
Summary
Source-checkedPlain-language reading of the full paper, prepared with AI and checked against the text. Each point links to the authors' own words.
Why it matters
- Agriculture is the primary source of livelihood for more than 58% of rural households in India. View evidence ↗
- Krishi Vigyan Kendra (KVK) programs aim to improve farmer livelihoods and productivity by providing necessary skills and knowledge on sustainable farming. View evidence ↗
- The adoption of new agricultural techniques and participation rates are significantly influenced by whether farmers have a positive attitude toward training. View evidence ↗
The question
- The study aimed to measure and compare the attitudes of farmers who had received KVK training (trainees) and those who had not (non-trainees). View evidence ↗
What they did
- The researchers used an ex-post facto research design to examine the effects of training after it had already occurred. View evidence ↗
- The study was conducted in the East Champaran district, selecting a total of 120 participants consisting of both trainees and non-trainees. View evidence ↗
- Farmer attitudes were measured using a set of statements where respondents could choose to agree, disagree, or remain undecided. View evidence ↗
What they found
- Trainees were significantly less likely to have a low attitude toward KVK activities (18.33%) compared to non-trainees (43.33%). View evidence ↗
- A higher percentage of trainees exhibited a high attitude level (30.00%) than non-trainees (25.00%). View evidence ↗
- The majority of both groups displayed a moderate attitude, with 35.00% of trainees and 31.67% of non-trainees falling into the medium category. View evidence ↗
- Farmers generally provided positive feedback regarding the performance of KVK scientists and the adequacy of field demonstration programs. View evidence ↗
What it means
- The authors concluded that attitude levels are positively and significantly linked to various socio-economic factors, including education, income, and social participation. View evidence ↗
- The study recommends that KVK improve its inclusivity and practical support to more effectively serve the entire farming community. View evidence ↗
Visual summary
2 visualsIllustrations explain the paper; charts are replotted from the paper's own table values.
Comparison of Attitude Levels
AI-generated conceptual illustration (Indian farmers in rural Bihar). It explains the idea and does not show study data.
View source evidence ↗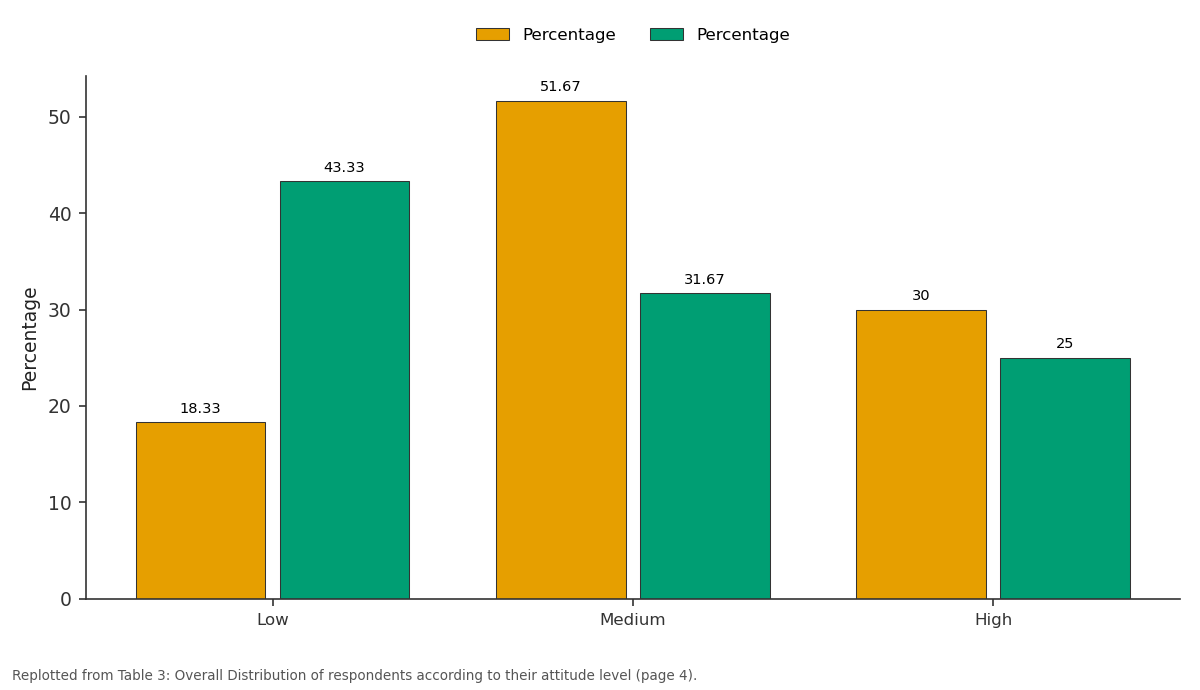
Percentage and Percentage: Low vs Medium vs High
Replotted from Table 3 (page 4) of the original paper. Every bar is the paper's own table value.
View source evidence ↗Figures & tables
From the original paper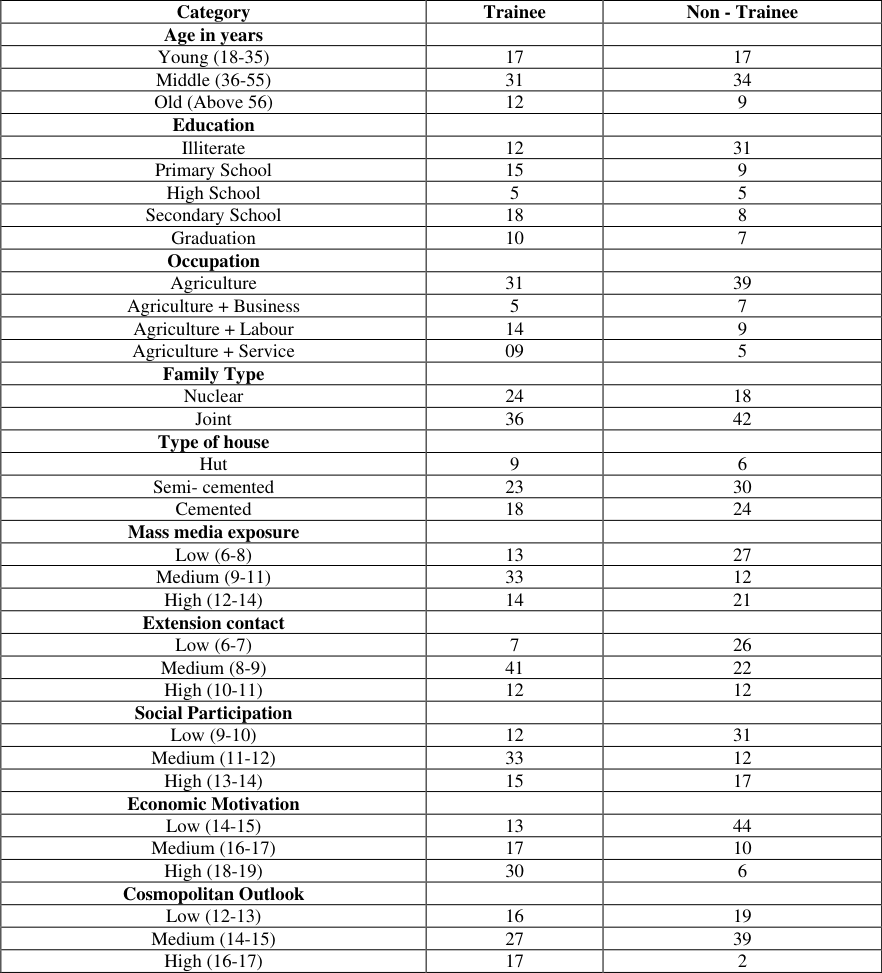 Table 1
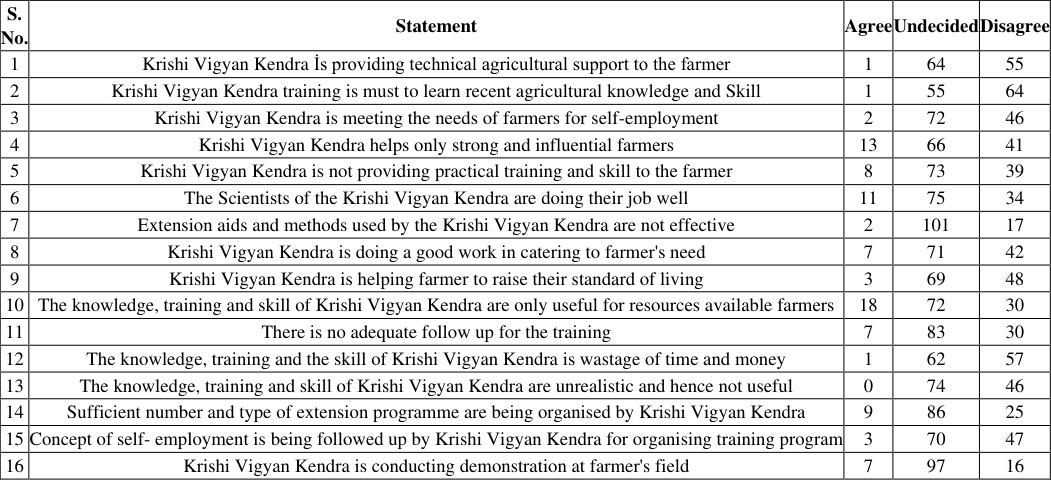 Table 2
 Table 3
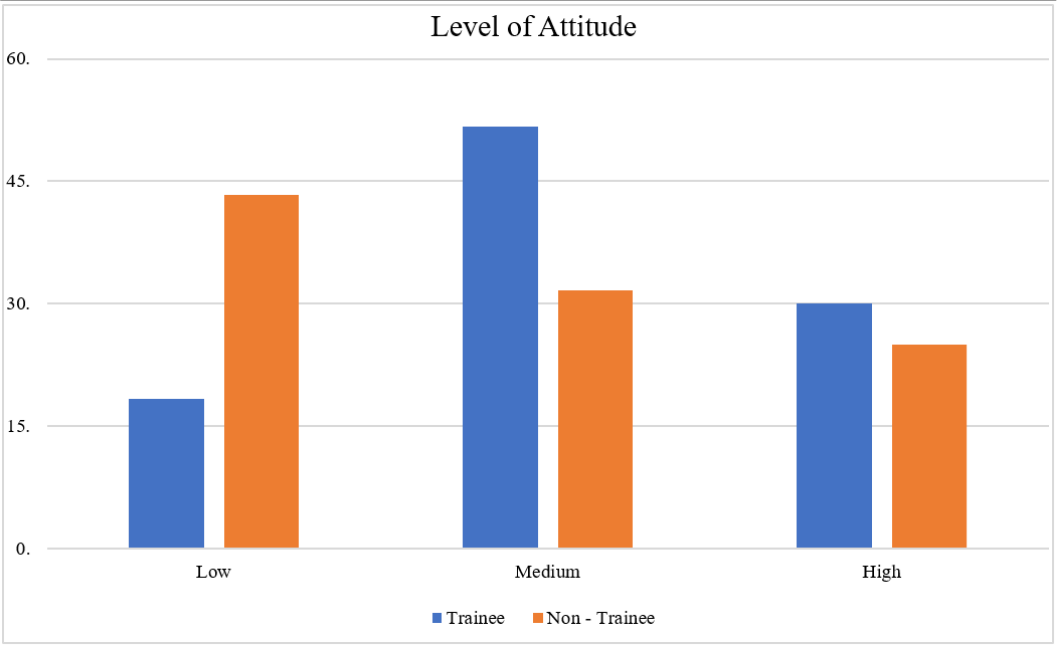 Figure 1
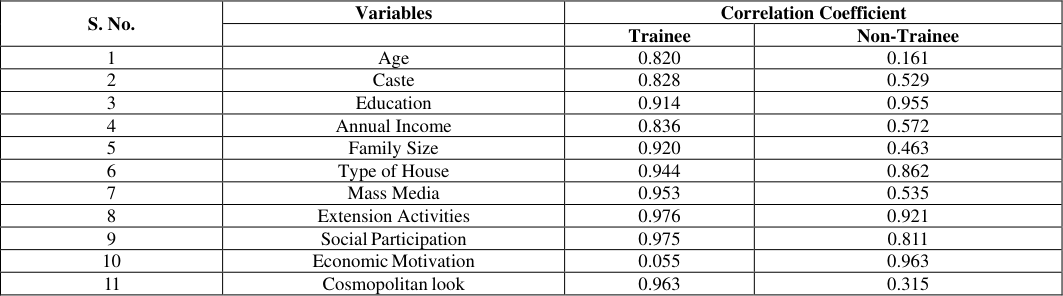 Table 4
Introduction
In India, over 58% of the rural households depend on agriculture as their principal means of livelihood. As per Ministry of Statistics and Programme Implementation, the share of agriculture and allied sectors was 16.4% of the Gross Value Added during 2017-18 at current prices. Average monthly income of farmer's households is Rs. 6426, of which 47.9% of income comes from cultivation. Till recent past, the focus in agriculture has been on increasing farm productivity. Now a days the main concern has shifted from higher farm production to higher returns on their investments. However, agriculture in India is faced with multiple challenges for accelerating agricultural growth. KVK program is designed to equip farmer with the knowledge and skills needed to increase agricultural productivity, promote sustainable farming practices, and improve the livelihoods of farmers. KVK also examine the latest technological innovations in agriculture, such as precision farming, drone technology, and biotechnology. By the end of this program, you will have a deep understanding of the challenges facing modern agriculture and the tools and strategies needed to overcome them. Trainings provide an opportunity to the farmers to make aware of agricultural technologies as well as the shift in agricultural development approach through farming enterprises. Training of farmers encompass all the roles of a farmer instead of looking at him only as a producer. Hence, KVK conducts several training programmes both on campus and off campus every year to farmers, farm women and rural youth. The training programmes are planned so as to meet the immediate requirements of the farming community. Training programme are scheduled at appropriate time so as to impart knowledge of suitable technology before the start of the season. Because of the diversity in crop, climate and different methods of cultivation, farmers are grouped as "farmer interest groups" so as to provide appropriate training packages to the groups. In KVK, trainings are conducted at various levels for which the programmes are designed based on the clientele problems and their needs and interests. Farmer attitudes toward training programs are crucial for enhancing agricultural practices and improving productivity. Positive attitudes can significantly increase participation rates and the effective adoption of new techniques. Farmers who view training as a valuable opportunity for skill enhancement and problem-solving are more likely to engage with these programs actively. Conversely, skepticism or lack of awareness about the benefits of training can hinder participation and limit the overall impact of such initiatives. Understanding these attitudes helps tailor training programs to better address farmers' needs and concerns, ultimately fostering greater agricultural development.
Objective
To measure the attitude of trainees and non-trainees towards training activities conducted by KVK.
Research Methodology
Ex-Post facto research design was followed for the present study. The term ex-post facto is used to refer to an experiment in which a researcher, examines the effect of a naturally occurring treatment after it has occurred. Here a result has already occurred, and the researcher is trying to find out the causes behind its occurrence by going backwards in history. Mul$ stages sampling was followed for the present study for the selec$on of samples required. East Champaran district is selected purposively for the study because maximum area covered by KVK training. With the help of KVK Officer list of trainees will be prepared. 120 trainees & non-trainees was selected for the present study. The table 3 provides a comparative overview of levels among trainees and non-trainees regarding different activities of the Krishi Vigyan Kendra (Krishi Vigyan Kendra), highlighting distribution and central tendencies within each group.
| Variable | Category | Trainee | — | Non-Trainee | — |
|---|---|---|---|---|---|
| Frequency | Percentage | Frequency | Percentage | ||
| Level of Attitude | Low | 11 | 18.33 | 26 | 43.33 |
| Medium | 31 | 51.67 | 19 | 31.67 | |
| High | 18 | 30.00 | 15 | 25.00 | |
| Total | 60 | 100 | 60 | 100 | |
| Mean = 20 SD = 8.29 | Mean = 20 SD = 4.55 |
Table text extracted from the original PDF; superscript letters are shown inline. The original table image is below.
View original table image
Results and Discussion
Results and Discussion
Attitude Levels
Low Attitude: Among trainees, 18.33% are categorized with a low attitude, compared to 43.33% of non-trainees. This indicates that a significantly smaller proportion of trainees exhibit a low attitude compared to non-trainees, suggesting that trainees generally have a more positive attitude.
Medium Attitude: A substantial majority in both groups fall into the medium attitude category, with 35.00% of trainees and 31.67% of non-trainees. This similarity highlights that most individuals in both groups display a moderate attitude. High Attitude 30.00% of trainees show a high attitude level, while 25.00% of non-trainees do so. This indicates that a greater percentage of trainees exhibit a high level of attitude compared to non-trainees, pointing to a more favorable disposition among trainees.
Descriptive Statistics Trainees
The mean attitude score for trainees is 20 with a standard deviation of 8.29. This mean score reflects a generally balanced attitude among trainees, with a moderate level of variation in individual scores.
Non-Trainees:
For non-trainees, the mean attitude score is also 20 but with a lower standard deviation of 4.55. This lower standard deviation suggests less variability in attitude among non-trainees compared to trainees, indicating a more uniform attitude level in this group. www.extensionjournal.com
Correlation coefficients between selected independent variables and attitude for trainees and non-trainees
The correlation coefficient table provides insights into the relationship between various variables and two groups: Trainees and Non-Trainees. For each variable, the table lists the correlation coefficients separately for Trainees and Non-Trainees, indicating the strength and direction of the linear relationship between the variables and the groups. High correlation coefficients (close to 1 or -1) suggest a strong relationship, while coefficients close to 0 imply a weak or no relationship. For instance, "Education" has a very high correlation with both Trainees (0.914) and Non-Trainees (0.955), indicating that education strongly correlates with being in either group. Conversely, "Economic Motivation" shows a very low correlation with Trainees (0.055) but a high correlation with Non-Trainees (0.963), suggesting that economic motivation is highly relevant for Non-Trainees but not for Trainees. This table helps in understanding how different variables impact or relate to each group differently.
Conclusion
It was concluded that majority of the respondents were living in medium level of socio economic status. The study clearly brought out that the majority of Trainees 35 percent have medium attitude level followed by 30 percent of those having high and 18.33 percent of those having low attitude level and majority of Non-Trainees 43.33 percent have low attitude level followed by 31.67 percent of those having medium and 25 percent of those having low attitude level about training activities. It was also found that attitude levels were positively and significantly correlated with age, education, occupation, type of house, annual income, family size, social participation, extension activities, mass media exposure, and cosmopolitan outlook.
Figures and tables from the paper
| Category | Trainee | Non - Trainee |
|---|---|---|
| Age in years | ||
| Young (18-35) | 17 | 17 |
| Middle (36-55) | 31 | 34 |
| Old (Above 56) | 12 | 9 |
| Education | ||
| Illiterate | 12 | 31 |
| Primary School | 15 | 9 |
| High School | 5 | 5 |
| Secondary School | 18 | 8 |
| Graduation | 10 | 7 |
| Occupation | ||
| Agriculture | 31 | 39 |
| Agriculture + Business | 5 | 7 |
| Agriculture + Labour | 14 | 9 |
| Agriculture + Service | 09 | 5 |
| Family Type | ||
| Nuclear | 24 | 18 |
| Joint | 36 | 42 |
| Type of house | ||
| Hut | 9 | 6 |
| Semi- cemented | 23 | 30 |
| Cemented | 18 | 24 |
| Mass media exposure | ||
| Low (6-8) | 13 | 27 |
| Medium (9-11) | 33 | 12 |
| High (12-14) | 14 | 21 |
| Extension contact | ||
| Low (6-7) | 7 | 26 |
| Medium (8-9) | 41 | 22 |
| High (10-11) | 12 | 12 |
| Social Participation | ||
| Low (9-10) | 12 | 31 |
| Medium (11-12) | 33 | 12 |
| High (13-14) | 15 | 17 |
| Economic Motivation | ||
| Low (14-15) | 13 | 44 |
| Medium (16-17) | 17 | 10 |
| High (18-19) | 30 | 6 |
| Cosmopolitan Outlook | ||
| Low (12-13) | 16 | 19 |
| Medium (14-15) | 27 | 39 |
| High (16-17) | 17 | 2 |
Table text extracted from the original PDF; superscript letters are shown inline. The original table image is below.
View original table image
| S. No. | Statement | Agree | Undecided | Disagree |
|---|---|---|---|---|
| 1 | Krishi Vigyan Kendra İs providing technical agricultural support to the farmer | 1 | 64 | 55 |
| 2 | Krishi Vigyan Kendra training is must to learn recent agricultural knowledge and Skill | 1 | 55 | 64 |
| 3 | Krishi Vigyan Kendra is meeting the needs of farmers for self-employment | 2 | 72 | 46 |
| 4 | Krishi Vigyan Kendra helps only strong and influential farmers | 13 | 66 | 41 |
| 5 | Krishi Vigyan Kendra is not providing practical training and skill to the farmer | 8 | 73 | 39 |
| 6 | The Scientists of the Krishi Vigyan Kendra are doing their job well | 11 | 75 | 34 |
| 7 | Extension aids and methods used by the Krishi Vigyan Kendra are not effective | 2 | 101 | 17 |
| 8 | Krishi Vigyan Kendra is doing a good work in catering to farmer's need | 7 | 71 | 42 |
| 9 | Krishi Vigyan Kendra is helping farmer to raise their standard of living | 3 | 69 | 48 |
| 10 | The knowledge, training and skill of Krishi Vigyan Kendra are only useful for resources available farmers | 18 | 72 | 30 |
| 11 | There is no adequate follow up for the training | 7 | 83 | 30 |
| 12 | The knowledge, training and the skill of Krishi Vigyan Kendra is wastage of time and money | 1 | 62 | 57 |
| 13 | The knowledge, training and skill of Krishi Vigyan Kendra are unrealistic and hence not useful | 0 | 74 | 46 |
| 14 | Sufficient number and type of extension programme are being organised by Krishi Vigyan Kendra | 9 | 86 | 25 |
| 15 | Concept of self- employment is being followed up by Krishi Vigyan Kendra for organising training program | 3 | 70 | 47 |
| 16 | Krishi Vigyan Kendra is conducting demonstration at farmer's field | 7 | 97 | 16 |
Table text extracted from the original PDF; superscript letters are shown inline. The original table image is below.
View original table image
| S. No. | Variables | Correlation Coefficient | — |
|---|---|---|---|
| Trainee | Non-Trainee | ||
| 1 | Age | 0.820 | 0.161 |
| 2 | Caste | 0.828 | 0.529 |
| 3 | Education | 0.914 | 0.955 |
| 4 | Annual Income | 0.836 | 0.572 |
| 5 | Family Size | 0.920 | 0.463 |
| 6 | Type of House | 0.944 | 0.862 |
| 7 | Mass Media | 0.953 | 0.535 |
| 8 | Extension Activities | 0.976 | 0.921 |
| 9 | Social Participation | 0.975 | 0.811 |
| 10 | Economic Motivation | 0.055 | 0.963 |
| 11 | Cosmopolitan look | 0.963 | 0.315 |
Table text extracted from the original PDF; superscript letters are shown inline. The original table image is below.
View original table image
References
10 in the original paper- Mishra R, Patel S, Kumar A, Sharma V. Assessing the long-term impact of KVK training on rural youth in Bihar. J Rural Dev Stud. 2023;45(2):123-37.
- Pandey R, Das A. Socio-economic impact of KVK training on sustainable livelihoods among tribal communities in East Champaran. Indian J Agric Econ. 2022;77(4):452-66.
- Das B, Sinha R. Socio-economic impact of KVK interventions on women farmers in Bihar. Agric Empower Rev. 2021;39(3):198-211.
- Sharma P, Singh R. Role of KVK training in improving access to market information and agricultural marketing strategies. J Agric Mark Econ. 2021;68(1):87-101.
- Yadav R, Kumar S, Singh A. Socio-economic impact of KVK training on agricultural diversification and income generation. J Agric Ext Rural Dev. 2020;12(4):215-25.
- Verma P, Kumar A. Effectiveness of KVK training in promoting sustainable agricultural practices among smallholder farmers. Int J Sustain Agric. 2019;11(2):130-42.
- Jha B, Pandey R. Effectiveness of KVK training programs in East Champaran district. J Rural Dev. 2019;38(3):45-59.
- Mishra S, Patel V, Sharma S. Socio-economic impact of KVK training on marginalized farming communities in East Champaran. Asian J Agric Econ. 2018;21(1):6779.
- Das S, Sinha R. Long-term effects of KVK training on youth engagement in agriculture and rural development. Youth Agric J. 2017;8(1):21-34.
- Singh R, Sharma V. Socio-economic impact of KVK training on rural farmers in Bihar. J Rural Community Dev. 2017;29(2):87-100.