
Research article · 2024 · Full text
International Journal of Agriculture and Food ScienceEstimation of the stochastic frontier production function of maize crop in Salah Al-Din governorate / Al-Dur district for the agricultural season (2020-2021)
Volume 6(2) · Pages 01–04 · DOI: 10.33545/2664844x.2024.v6.i2a.193 ↗
Research areasAgricultural Economics and Practices
Abstract
Author-writtenIn order to create a model for the agricultural season (2020-2021), the study sought to estimate the random border production function of the maize crop under supplemental irrigation systems in Salah El-Din Governorate and Al-Dour district. All of the farmers that grow yellow corn in Salah Al-Din Governorate's Al-Dour district make up the research sample, which was gathered using a questionnaire form designed specifically for this purpose and provides the information needed for this investigation. A random sample of the agricultural community was taken. For the production season 2021, there were 352 farms in the Al-Dur district, and the total cultivated area was 3,750 dunums for fixed and pivotal irrigation. There were 70 farmers using pivotal irrigation, covering an area of 1000 dunams, and 42 farmers using permanent irrigation, covering an area of 700 dunams. The logarithmic transcendental production function was used in the study to describe the stochastic frontier analysis model, or SFA. Regarding the two systems, the first issue involved using the Frontier 4.1 software and the Maximum Likelihood approach to estimate the stochastic border production function in accordance with the transcendent logarithmic production function TL. As it turned out, some of the production-related factors under study were morally and positively charged, while others-like seeds-violated economic logic, as did the quantity of water provided and the number of hours worked. That technological advancements have a negative impact on agricultural output, the random variable, and, eventually, technical efficiency. Technical efficiency averaged 0.65%; this suggests that farmers can achieve a 34% improvement in production.
Summary
Source-checkedPlain-language reading of the full paper, prepared with AI and checked against the text. Each point links to the authors' own words.
Why it matters
- The study focuses on estimating the production function of maize crops using supplemental irrigation in the Al-Dur district of Salah Al-Din governorate for the 2020-2021 season. View evidence ↗
- The use of random bounds production functions is considered an advanced economic method that provides significant outcomes for production objectives. View evidence ↗
The question
- The research aims to measure the technical efficiency (TE) and determine the inefficiency parameter for individual farms using a transcendental production function. View evidence ↗
What they did
- The study sample included farms in the Al-Dur District for the 2021 season, with a total cultivated area of 3,750 dunums, including 70 farmers using pivotal irrigation (1,000 dunams) and 42 using permanent irrigation (700 dunams). View evidence ↗
- The researchers employed Stochastic Frontier Analysis (SFA) using a logarithmic transcendental production function, estimated with Frontier 4.1 software. View evidence ↗
- The model used maize production quantity as the dependent variable, with independent variables including area, seeds, working hours, water, pesticides, and fertilizers, while inefficiency was linked to management variables like education, family size, and irrigation experience. View evidence ↗
What they found
- Increasing the planted area by 1% was found to result in a 0.70010438% increase in maize production. View evidence ↗
- An increase in seed quantity by 1% led to a 0.18814658% decrease in production, suggesting that farmers used seeds in excess of the required level. View evidence ↗
- Increasing irrigation water by 10% resulted in a 0.31% decrease in production, which the authors attribute to water waste from traditional irrigation methods. View evidence ↗
- The relationship between human working hours and production was found to be inverse, which contradicts standard economic logic. View evidence ↗
- The average technical efficiency of the sample was 66%, meaning farmers could potentially increase output by 34% without additional financial resources. View evidence ↗
- Individual farm technical efficiency varied significantly, ranging from a high of 93% (Farm 41) to a low of 21% (Farm 83). View evidence ↗
- The largest group of farmers (32.43%, or 36 farms) achieved the highest technical efficiency level of 81% or more. View evidence ↗
What it means
- The authors conclude that there is a significant opportunity to enhance production by optimizing resource use, as the 66% average efficiency suggests a 34% potential for improvement. View evidence ↗
- The authors recommend further research to diagnose the specific determinants of technical efficiency and explore ways to improve it by considering social and economic factors. View evidence ↗
Visual summary
2 visualsIllustrations explain the paper; charts are replotted from the paper's own table values.
Resource Impact on Maize Production
AI-generated conceptual illustration (maize plants in a field). It explains the idea and does not show study data.
View source evidence ↗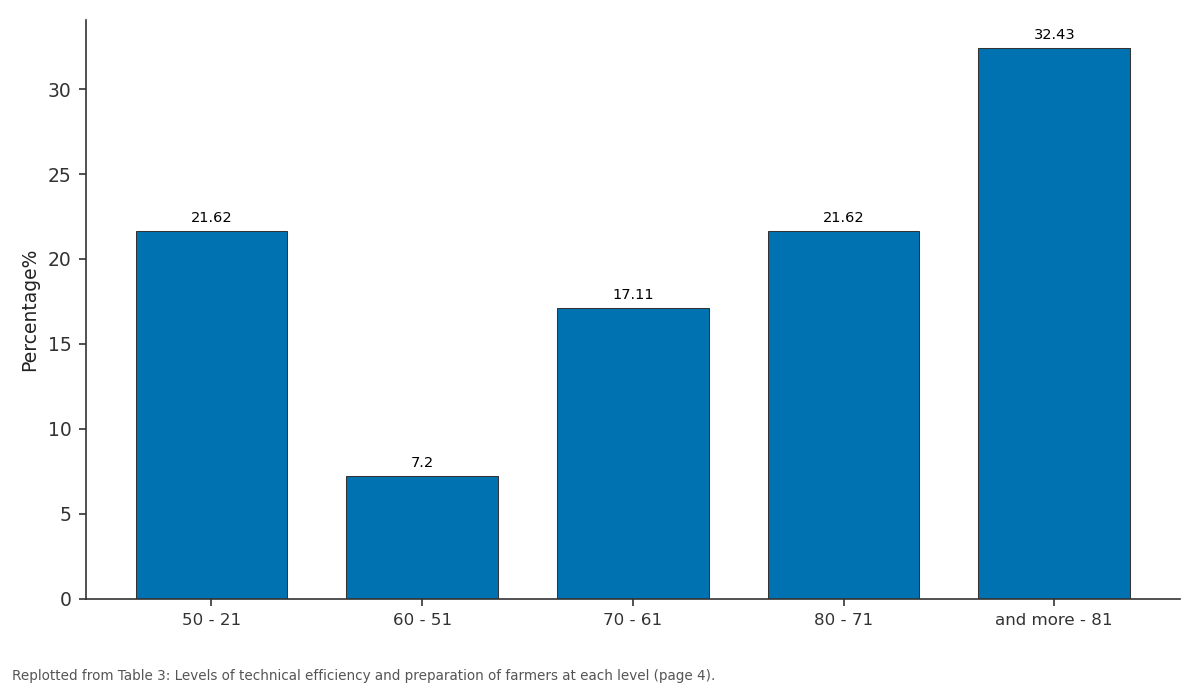
Percentage%: 50 - 21 vs 60 - 51 vs 70 - 61 vs 80 - 71 vs and more - 81
Replotted from Table 3 (page 4) of the original paper. Every bar is the paper's own table value.
View source evidence ↗Figures & tables
From the original paper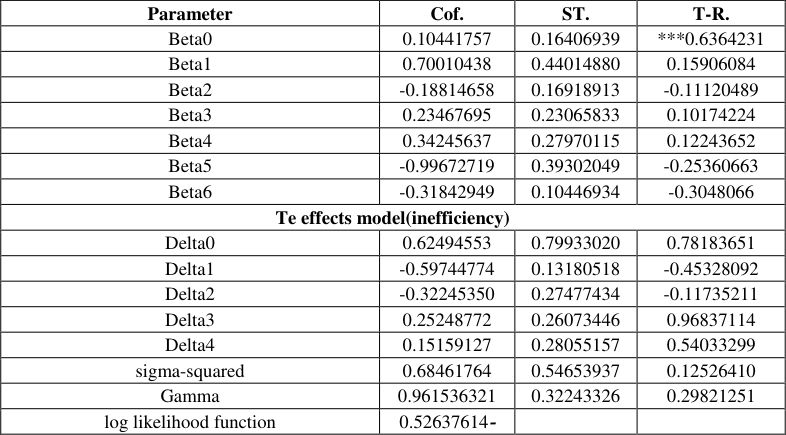 Table 1
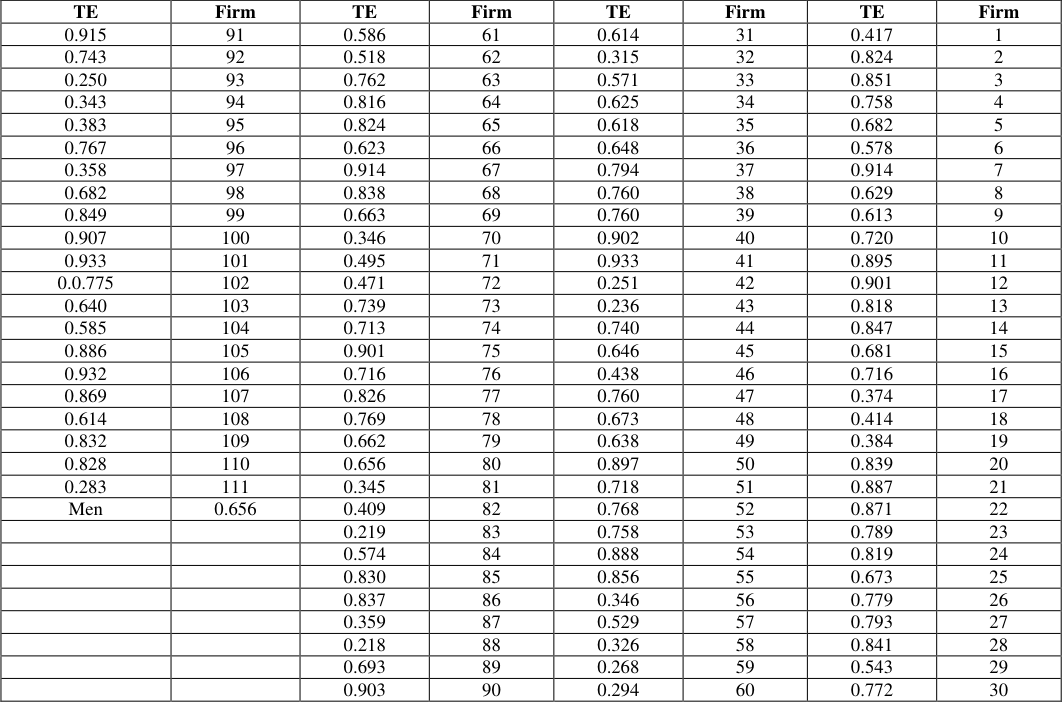 Table 2
 Table 3
Introduction
One of the parametric approaches put out by researchers Aigner and others in 1977 is the stochastic border production function. This method was created by researcher Farrell, who also devised the system for assessing and estimating efficiency in 1957.In general, it assumes the determination of the dependent variable and the independent variables, and the residuals are the result of measurement errors or inefficiency and differ This model is based on the production boundary function model, Whereas the stochastic frontier production function is the basis for deriving the stochastic frontier cost function [1] . The Cobb-Douglas function differs in the presence of the random error Fi added to the non-negative random variable Ui. This property is characterized by separating the residual Ei into two parts with a common variance equal to zero. The first part represents the random error term Vi, which in turn reflects measurement errors and may be positive or negative. The second part is the limit of inefficiency Ui, and it comes in the fact that the inefficiency is caused by the negative deviation from the boundary efficiency curve [2] . What distinguishes this part is that it gives estimates for the limit of efficiency shortfall, and thus separates it from the limit of random error, which provides the opportunity for an accurate interpretation of the difference in efficiency [3] . It was found through the basic rules of the theory of efficiency that this method represents the most efficient points and that the distance between each point and the curve represents the degree of inefficiency [4] .
2. The random bounds production function is the basis for deriving the stochastic bounds cost function [1] . This function is characterized by the presence of the random error Fi added to the non-negative random variable Ui, and in this way it differs from the Cobb-Douglas function, as this property distinguishes it by separating the residual Ei into two parts. They have a covariance equal to zero.
Research problem
The reason for choosing the SFA method using (transcendental logarithmic production function) is because it is suitable for imposing the study of efficiency for farms that suffer from problems and large differences in the data, in addition to the ability to explain the variance in terms of independent variables.
Research aims
Determine the amount of the inefficiency parameter for each farm represented by the random variable (ui) by estimating the stochastic boundary production function measuring the Technical Efficiency (TE) using the Transcendental Production Function.
Search method
The research relied on two methods, namely the descriptive and quantitative method. The descriptive method deals with the general description of the governorate under study and its importance and the importance of the yellow corn crop and its occurrence in terms of area and productivity, in addition to the social and economic characteristics of the sample. As for the quantitative side, it is economic and standard that studies the assessment of important functions.
Data sources First -preliminary data
The research was dependent on information obtained from its sources in the field, and this information was gathered via individual interviews with farmers in order to acquire the necessary data using a questionnaire that was specifically created for this task.
Second -secondary data
Secondary data were obtained through the Ministry of Agriculture, the Ministry of Water Resources, and the Ministry of Planning and Development Cooperation, publications related to the subject of the research.
Results and discussion
The results of estimating the transcendental logarithmic production function TL according to the random parametric analysis (SFA)
The description of the model is according to the random border analysis, as the dependent variable was the quantity of maize production and the independent variables are (area, the amount of seeds, working hours, the amount of added water, the amount of pesticides, the amount of fertilizers), and the inefficiency variables represented by the management variables (educational level, family size). Supplementary irrigation experience) and Frontier 4.1 program was used to estimate the model because the (OLS) method, although it gives the best linear and unbiased estimate of the coefficients and is used as a step in estimation, it cannot be relied upon in application to nonlinear regression models. The COLS method was adopted in the second step, where the model was estimated using the ML method in order to obtain maximum likelihood estimates of the production function parameters. The results of the (superior) logarithmic production function were TL according to the (ML) method and the inefficiency model according to the random parametric analysis as shown in Table 1. The results of the function are interpreted as follows 1. Area X1 He value of flexibility demonstrates the positive and moral relationship between the area and the yield of yellow corn at 5%. This indicates that increasing the area planted with the crop by 1% results in a 0.70010438 percent increase in production, which is in line with the ideas of economic theory. The area is one of the most influential variables in the quantity of the product (2015), due to its importance in increasing production, and it is also important in supplementary irrigation, especially pivot irrigation, as it requires large areas.
| Parameter | Cof. | ST. | T-R. |
|---|---|---|---|
| Beta0 | 0.10441757 | 0.16406939 | ***0.6364231 |
| Beta1 | 0.70010438 | 0.44014880 | 0.15906084 |
| Beta2 | -0.18814658 | 0.16918913 | -0.11120489 |
| Beta3 | 0.23467695 | 0.23065833 | 0.10174224 |
| Beta4 | 0.34245637 | 0.27970115 | 0.12243652 |
| Beta5 | -0.99672719 | 0.39302049 | -0.25360663 |
| Beta6 | -0.31842949 | 0.10446934 | -0.3048066 |
| Te effects model(inefficiency) | |||
| Delta0 | 0.62494553 | 0.79933020 | 0.78183651 |
| Delta1 | -0.59744774 | 0.13180518 | -0.45328092 |
| Delta2 | -0.32245350 | 0.27477434 | -0.11735211 |
| Delta3 | 0.25248772 | 0.26073446 | 0.96837114 |
| Delta4 | 0.15159127 | 0.28055157 | 0.54033299 |
| sigma-squared | 0.68461764 | 0.54653937 | 0.12526410 |
| Gamma | 0.961536321 | 0.32243326 | 0.29821251 |
| log likelihood function | 0.52637614- |
Table text extracted from the original PDF; superscript letters are shown inline. The original table image is below.
View original table image
Quantity of seeds x2
The value of flexibility shows the negative and insignificant relationship between the amount of seeds and production, meaning that an increase in seeds by 1% will lead to a decrease in production by 0.18814658%, and this means that the amount of seeds used by farmers exceeds the required level, which means that there is a waste in the use of the resource, in addition to the dependence of most farmers on Varieties from previous seasons as a result of poor funding, Al-Naimi [5] . It also indicates that most farmers do not rely on the recommended quantities of seeds, and this affects the growth and density of the plant, and thus is reflected in the decrease in production.
Amount of pesticides x3
The sign of the variable is positive and it is consistent with the economic logic and it reached 0.23467695. In general, we note the absence of agricultural guidance and counseling, which in turn negatively affected the use of this resource, in addition to the in its prices in the markets.
Quantity of fertilizer x4
The sign of the fertilizer variable of 0.34245637 matches the economic logic, showing the positive relationship between the fertilizer and the amount of output, meaning that an increase in fertilizer use by 1% will lead to an increase in the output by 0.342%.
Number of working hours X5
The indication of the number of human working hours, amounting to 190.996727, did not match the economic logic, indicating the inverse relationship between work and production.
Amount of added water x6
The variable has a negative and insignificant relationship with the yield of maize through the negative sign of its elasticity value, which means that increasing the amount of irrigation water given to the maize crop of water by 10% will lead to a decrease in maize production by 0.31%, and this reflects the effect of the amount of water use of water and dependence on traditional irrigation methods that lead to waste of water and a decrease in the output [6] . As for the significance of the variables, despite the fact that the statistical significance is not important in the functions estimated by the ML method, this is due to the fact that the parameters estimated in this way are efficient and coherent to the limits of the error Ui and small in size relative to the community estimates taken from it [2] .
Then, the production function (TL) was used to estimate technical efficiency, and the results of the estimate were fixed in Table 2
From Table 2 it can be seen that the highest value of technical efficiency was achieved in the farm (41), which reached 93%, which means that the farm approached the level of full efficiency, being among the sample farms with a certain value the highest performance achieved number of inputs, which means that the farm produces this amount of output with only 93% of the inputs or less, while the lowest efficiency achieved in the farm (83) was 21%.This means that the farm that achieves this value must use 21% of the inputs or less in order to reach the stage of efficiency and produce a certain amount of output. Farmers can raise their output by 34% without utilizing financial resources in the production process, as evidenced by the sample level's average technical efficiency of 66% [7] . This shows that the establishments produce the same previous product using fewer resources-roughly 34% of the resources used-and that the sample loses some economic resources, resulting in additional costs of 34% of the resource costs. Thus, it is evident that not all of the sample farms produced on the production possibilities curve and instead deviated from it in varying degrees. Neither farm was able reach 100% economic efficiency. This suggests that these establishments have the potential to produce at the level required while utilizing fewer financial resources to accomplish higher levels of production [8] . When dividing the levels of technical efficiency, it was found that 21.62% of the farmers were limited to their technical efficiency between 21-50 and this is due to the good use of resources such as seeds and the amount of fertilizer compared to other farms, while 8 farms achieved efficiency that was limited to between 51-60 and constituted 7.20% of the sample farmers and that 17.11% of the total sample achieved technical efficiency levels that ranged between 70-61, while 21.62% of the sample farmers achieved technical efficiency limited to between 80-71, and that the highest technical efficiency was achieved for the yellow maize farmers category, more than 81 and for 36 farms, at a rate of 32.43%. In general, it can be said that the sample farmers generally achieve a technical efficiency of more than 32%, and we conclude, through the TL function, a positive effect of some studied variables on production, with the exception of the variables seed, working time, etc. amount of added of water, which goes against economic logic and is due to non-compliance with the recommended quantities of seeds and the amount of water added. We recommend conducting further studies that diagnose the determinants of the level of technical efficiency, ways to improve it, taking into account the economic and social factors surrounding production conditions, and studying the (optimal) efficiency in some farms and the reasons that have led to their achievement and their application as applied models that inefficient farms can follow. To achieve full efficiency [9] .
| TE | Firm | TE | Firm | TE | Firm | TE | Firm |
|---|---|---|---|---|---|---|---|
| 0.915 | 91 | 0.586 | 61 | 0.614 | 31 | 0.417 | 1 |
| 0.743 | 92 | 0.518 | 62 | 0.315 | 32 | 0.824 | 2 |
| 0.250 | 93 | 0.762 | 63 | 0.571 | 33 | 0.851 | 3 |
| 0.343 | 94 | 0.816 | 64 | 0.625 | 34 | 0.758 | 4 |
| 0.383 | 95 | 0.824 | 65 | 0.618 | 35 | 0.682 | 5 |
| 0.767 | 96 | 0.623 | 66 | 0.648 | 36 | 0.578 | 6 |
| 0.358 | 97 | 0.914 | 67 | 0.794 | 37 | 0.914 | 7 |
| 0.682 | 98 | 0.838 | 68 | 0.760 | 38 | 0.629 | 8 |
| 0.849 | 99 | 0.663 | 69 | 0.760 | 39 | 0.613 | 9 |
| 0.907 | 100 | 0.346 | 70 | 0.902 | 40 | 0.720 | 10 |
| 0.933 | 101 | 0.495 | 71 | 0.933 | 41 | 0.895 | 11 |
| 0.0.775 | 102 | 0.471 | 72 | 0.251 | 42 | 0.901 | 12 |
| 0.640 | 103 | 0.739 | 73 | 0.236 | 43 | 0.818 | 13 |
| 0.585 | 104 | 0.713 | 74 | 0.740 | 44 | 0.847 | 14 |
| 0.886 | 105 | 0.901 | 75 | 0.646 | 45 | 0.681 | 15 |
| 0.932 | 106 | 0.716 | 76 | 0.438 | 46 | 0.716 | 16 |
| 0.869 | 107 | 0.826 | 77 | 0.760 | 47 | 0.374 | 17 |
| 0.614 | 108 | 0.769 | 78 | 0.673 | 48 | 0.414 | 18 |
| 0.832 | 109 | 0.662 | 79 | 0.638 | 49 | 0.384 | 19 |
| 0.828 | 110 | 0.656 | 80 | 0.897 | 50 | 0.839 | 20 |
| 0.283 | 111 | 0.345 | 81 | 0.718 | 51 | 0.887 | 21 |
| Men | 0.656 | 0.409 | 82 | 0.768 | 52 | 0.871 | 22 |
| 0.219 | 83 | 0.758 | 53 | 0.789 | 23 | ||
| 0.574 | 84 | 0.888 | 54 | 0.819 | 24 | ||
| 0.830 | 85 | 0.856 | 55 | 0.673 | 25 | ||
| 0.837 | 86 | 0.346 | 56 | 0.779 | 26 | ||
| 0.359 | 87 | 0.529 | 57 | 0.793 | 27 | ||
| 0.218 | 88 | 0.326 | 58 | 0.841 | 28 | ||
| 0.693 | 89 | 0.268 | 59 | 0.543 | 29 | ||
| 0.903 | 90 | 0.294 | 60 | 0.772 | 30 |
Table text extracted from the original PDF; superscript letters are shown inline. The original table image is below.
View original table image
Conclusion
The Stochastic Frontier Analysis (SFA) of maize production under supplemental irrigation in Salah El-Din Governorate's Al-Dour district reveals several insights. The logarithmic transcendental production function highlighted that while the area cultivated and the amount of fertilizer positively impact production, the quantity of seeds and added water negatively affect yields, reflecting inefficiencies and potential resource mismanagement. Technical efficiency averaged 66%, indicating that farmers could potentially improve production by up to 34% without additional resource investment. This underlines a significant opportunity for enhancing production efficiency by optimizing resource use and addressing inefficiencies. The analysis emphasizes the need for further research into factors affecting technical efficiency and practical strategies to improve it, particularly through better adherence to recommended practices and improved irrigation methods.
Figures and tables from the paper
| Percentage% | the number | Technical Proficiency Level |
|---|---|---|
| 21.62 | 24 | 50 - 21 |
| 7.20 | 8 | 60 - 51 |
| 17.11 | 19 | 70 - 61 |
| 21.62 | 24 | 80 - 71 |
| 32.43 | 36 | and more - 81 |
Table text extracted from the original PDF; superscript letters are shown inline. The original table image is below.
View original table image
References
8 in the original paper- Bauer PW, Berger AN, Ferrier GD, Humphrey DB. Consistency conditions for regulatory analysis of financial institutions: a comparison of frontier efficiency methods. J Econ Bus. 1998;50(2):85-114.
- Ahmed NM. Estimating the technical efficiency of vegetable farms in Lattakia Governorate using the great border production function. Tishreen Univ J Res Sci. Stud -Biol Sci. Ser., 2018, 40(2).
- Al-Youssef A, Shaaban ASA, Suleiman AH, Mazid A, Khoja S, Naal Y, et al. Assessment and analysis of the technical efficiency of wheat farms in Al-Bab region using stochastic frontier analysis (SFA). Aleppo Univ Res Journal, Agric Sci. Ser. 2015;115:149-172.
- Al-Niamy S, Ahmed Z. Estimating technical efficiency of wheat farms under supplementary irrigation using the stochastic frontier approach (sampling area: Tellkef District). Mesopotamia J Agric. 2012;40:54-62.
- Naji NS. Quantitative estimation of the yellow maize crop production function in Iraq for the period 1986 - 2003. Karbala Univ Sci. J, 2011, 9(3).
- Al-Samarrai HT, Zenzel SGA. The production function of the wheat crop irrigated by spraying in Salah al-Din Governorate for the productive season 2015-2016, the science district, an applied model. Tikrit Univ J Agric Sci. 2017;71(6):82-83.
- Al-Saati A-RA-H, Al-Osaimi MH. Estimating the cost function of Islamic banks and commercial banks, a comparative study. King Abdulaziz Univ Journal, Islam Econ Arab, 1995, 7.
- Abdulla WAQ, Khairi AM, Khaled MM, Hamad MS. Estimating the cost function and economies of scale for the yellow corn crop in Babil Governorate -an applied model. Iraq Agric Sci. J, 2016, 45(7).