
Research article · 2024 · Full text
International Journal of Agriculture Extension and Social DevelopmentDetails of NTFPs collected by members of large-scale Adivasi multi-purpose cooperative societies in Karnataka
Volume 7(7) · Pages 486–489 · DOI: 10.33545/26180723.2024.v7.i7g.845 ↗
Research areasAgricultural Economics and PracticesMicrofinance and Financial InclusionSocial and Economic Development in India
Abstract
Author-writtenIndia one among the few nations having tribal population. Tribes also called Adivasi are vibrant, culturally rich and have different traditions, lifestyles, beliefs, food, languages, rituals and a different approach to their lives. For integrated tribal development in regions with significant tribal populations, the government set up Large-Scale Adivasi Multi-Purpose Societies in 1973, popularly known as LAMPS. The present investigation was conducted in Karnataka during 2022-23 to study NTFPs collected by members of LAMPS. In Karnataka out of 23 LAMPS, 10 LAMPS with the highest membership were selected purposively for the study. Data Envelopment Analysis (DEA) was used to check the technical efficiency of respondents in collecting NTFP. Data were collected by personal interview method by using a structured interview schedule. The results showed that respondents collected different NTFPs among them honey was collected by majority of the respondents. Respondents showed less technical efficiency in collecting NTFPs.
Summary
Source-checkedPlain-language reading of the full paper, prepared with AI and checked against the text. Each point links to the authors' own words.
Why it matters
- Forests are a critical part of Karnataka's economy and environment, covering approximately 22.61% of the state's total geographical area. View evidence ↗
- Non-timber forest products (NTFPs) are vital for tribal livelihoods, contributing between 10% and 40% of household earnings. View evidence ↗
- The government established Large-Scale Adivasi Multi-Purpose Societies (LAMPS) in 1973 to support integrated development for tribal populations. View evidence ↗
The question
- The study aimed to investigate the specific non-timber forest products (NTFPs) collected by members of LAMPS in Karnataka during 2022-23. View evidence ↗
What they did
- Researchers used a structured interview schedule to collect data from 85 LAMPS members involved in NTFP collection. View evidence ↗
- The study purposively selected 10 LAMPS with the highest membership out of a total of 23 available in Karnataka. View evidence ↗
- Data Envelopment Analysis (DEA) was employed to measure the technical efficiency of the respondents in their collection of NTFPs. View evidence ↗
What they found
- Honey was the most common NTFP collected, with 68.24% of respondents harvesting it from April to May and selling it for an average of ₹295.34 per kg. View evidence ↗
- Rampatre had the highest average selling price at ₹757.14 per kg, although it was collected by only 8.24% of respondents. View evidence ↗
- Experience levels varied, with 40.00% of respondents having medium experience and 27.06% having high experience in NTFP collection. View evidence ↗
- In 60.00% of the households, only one family member was involved in collecting NTFPs, often as a secondary occupation. View evidence ↗
- The respondents demonstrated low technical efficiency in NTFP collection, with a mean efficiency score of 0.29. View evidence ↗
- The majority of respondents (44.71%) earned a medium level of income from their NTFP collection activities. View evidence ↗
What it means
- The authors conclude that improved training and better collection practices are necessary to increase the profitability and sustainability of NTFP utilization. View evidence ↗
- The authors state that many collectors operate below optimal levels, resulting in low technical efficiency despite the importance of these products. View evidence ↗
Visual summary
3 visualsIllustrations explain the paper; charts are replotted from the paper's own table values.
Technical Efficiency Distribution
AI-generated conceptual illustration (Non-timber forest products (NTFPs) such as honey, wild berries, and medicinal roots in a forest setting). It explains the idea and does not show study data.
View source evidence ↗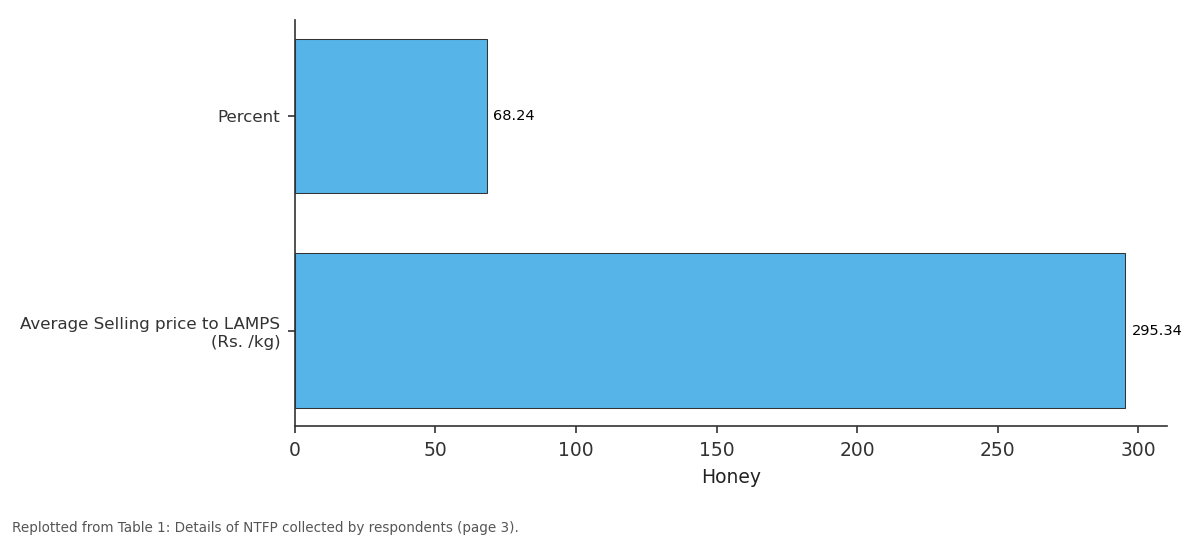
Honey: Percent vs Average Selling price...
Replotted from Table 1 (page 3) of the original paper. Every bar is the paper's own table value.
View source evidence ↗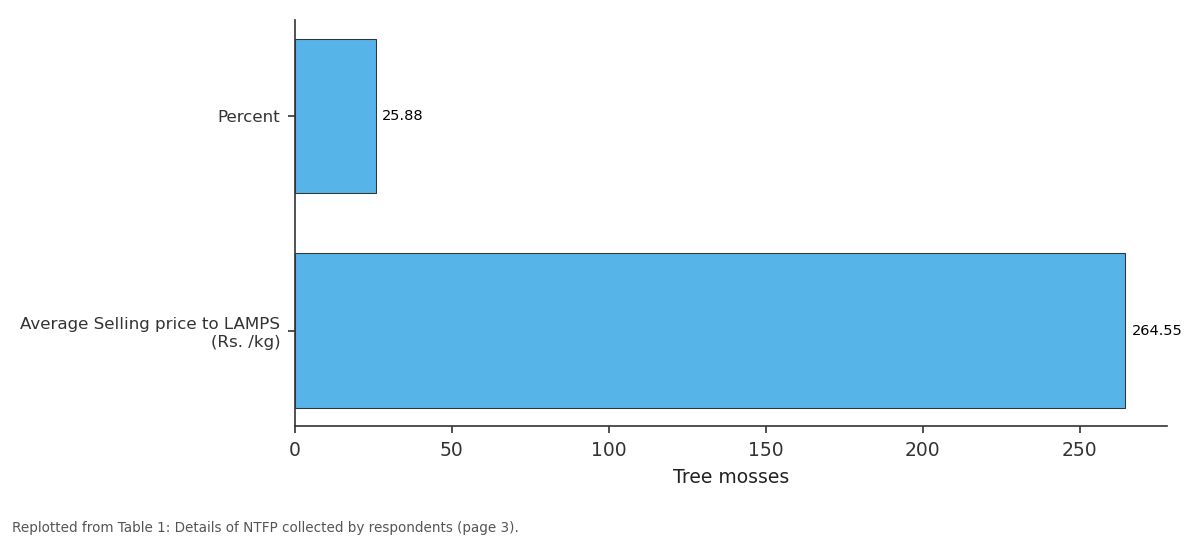
Tree mosses: Percent vs Average Selling price...
Replotted from Table 1 (page 3) of the original paper. Every bar is the paper's own table value.
View source evidence ↗Figures & tables
From the original paper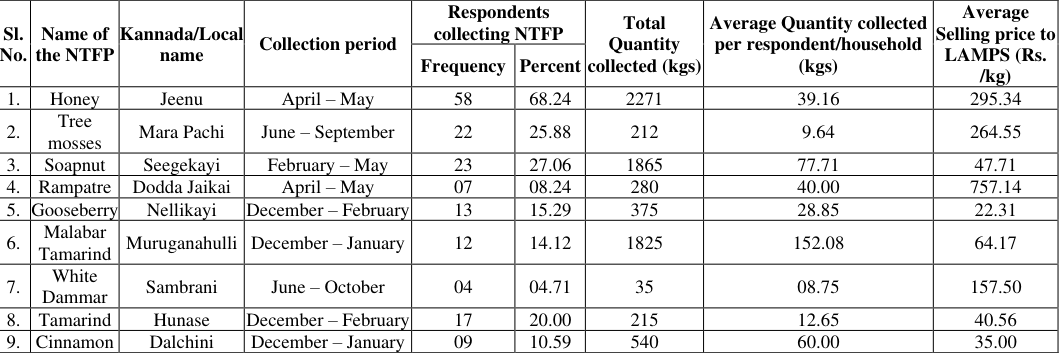 Table 1
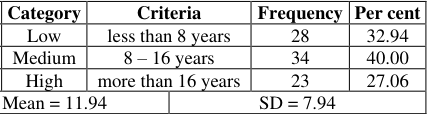 Table 2
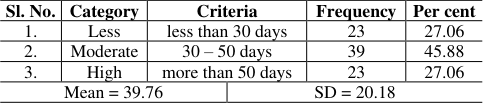 Table 4
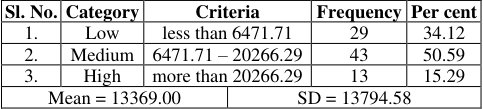 Table 5
 Table 3
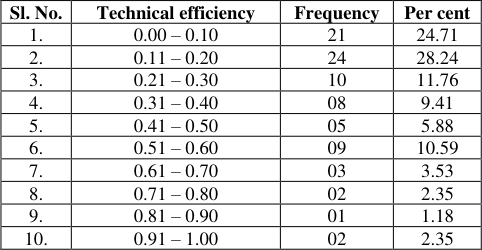 Table 6
Introduction
Forests constitute a significant component of the natural capital of an economy. The word Forest refers to a large area covered with trees. The forests are some of the world's richest natural resources and are essential to maintaining the ecological, biological and environmental balance. Karnataka's forest area is about 22.61 per cent of the state's geographical area. The forest area of Karnataka is 40,649.30 sq.km, Uttara Kannada district has highest forest area (26.50%) and lowest is Vijayapura district (0.10%) (Anon., 2023) [2] . The forest produces are classified into two broad categories namely, timber and non-timber forest products (NTFPs), also called as minor forest produce (MFP). The term NTFPs refers to a broad spectrum of biomass related products, food, fiber, fodder, gums and resins, medicinal plants, structural materials and a range of other items of sustenance and economic value (Campbell, 1994) [3] . The Forest Rights Act of 2006 defines "minor forest produce" as all non-timber forest products of plant origin, such as bamboo, brush wood, stumps, cane, tussar, cocoons, honey, wax, lac, tendu or kendu leaves, medicinal plants and herbs, roots, tubers etc. Though NTFPs have been old friends to human beings in all communities, it was the forest dwellers, mostly tribals, who have been related to them most, as they depend entirely on the forests. About 60 per cent of the production of NTFPs is consumed by about seven crore tribals in the country. NTFPs constitute about 10 to 40 per cent of tribal household earnings (Shiva, 1993) [9] . NTFPs provide 50 per cent of income for 20 to 30 per cent of rural people in India (Sekhar et al, 1996) [8] . In India, over 50 per cent of forest revenues and 70 per cent of export income from forest come from NTFPs (Campbell, 1994) [3] . Ganapathy (2006) [5] in the production and marketing linkages of Non-Timber Forest Products, observed that the households involved maximum number days (89.07 days/year) in the collection of firewood followed by 47.12 days per year for Gooseberry, 45.21 days per year for Date leaves and Korai grass, 36.08 days per year for Broom stick grass (per piece), 31.01 days per year for Dead and Dry Bamboo collection and least for Seegekai collection (16.18 days/year). Satpathy (2017) [7] studied on livelihood dependency of forest fringe community, marketing and economics of forest produces in Sundargarh forest division, Odisha and found that NTFPs like mahua, chara, sal leaves and seeds kendu leaves formed the major chunk of the collection where as other products like harida, bahada, anola, bel, kochila were collected in very small amount. Chara seeds and mahua flowers accounted around 60 per cent of the total annual NTFP income. Akash (2022) [1] in the study on LAMPS found that www.extensionjournal.com respondents collected tree moss of average quantity of 63 kg during June -September and sold at ₹400 per kg to LAMPS, Shikakai was collected during February -May, average quantity collected was 65 kg per person and was sold to LAMPS at ₹30 per kg. Gooseberry was collected 20 kg per person and was sold at ₹15 per kg to LAMPS, which was collected during December -February. Honey was collected during April -May, average quantity of 18 kg, this was sold to LAMPS at ₹350 per kg by the respondents. Klate et al. (2022) [6] conducted study on the contribution of non-timber forest products (NTFPs) to forest dwellers in Kinnaur district of Himachal Pradesh and found that 08.25 per cent of area was under NTFPs use. NTFPs like Chilgoza, Kalajeera and some amounts of Dhoop were found on their farm land, in which Chilgoza on their farm land was found to be maximum (61.66%). Further it was found that 14.02 per cent of income was generated from NTFP, however income generated by the Chilgoza was maximum (59.64%) in the overall category. The minimum share (0.38%) was contributed by Kuth. It was concluded from the foregoing analysis that Chilgoza and Kalajeera were major contributors to NTFPs income in the study area.
Methodology
The study was conducted in Karnataka state, during the year 2022-23. Ex-post-facto research design was used for the study. The data was collected from 85 respondents who were members of LAMPS and involved in NTFP collection, through personal interview method using structured interview schedule. Collected data was tabulated and analyzed using appropriate statistical tools like frequency, percentage, mean and standard deviation. Microsoft Excel and DEA software were used for analysis. Microsoft Excel spread sheet, it was used for preparing master sheet, calculations and for preparation of tables and figures. Further, it was used for the estimation of statistical measures like mean, standard deviation, percentages, frequency for desirable independent variables and dependent variables. DEA is a non-parametric and deterministic measure of efficiency. The analysis was performed using software designed by Coelli which encompasses technical efficiency, allocative efficiency and cost/economic efficiency (Suresh and Chandrakanth, 2016 and Chinnappa et al., 2018) [10,4] . The term technical efficiency indicated the ability of the respondents to collect maximum quantity of NTFPs in a given wages and man-days. The number of days involved in NTFP collection was converted into man-days. To ascertain efficiency of respondents in collection of NTFPs, production frontier was constructed in DEA approach based on linear programming. The term envelopment is derived from production frontier which envelops the set of observations. For each member, total quantity of NTFP collected (output category), days spent in NTFP collection (man-days) and their corresponding wages earned (input category) were considered in the calculation of cost-DEA efficiency score. the most efficient member operates at 100 per cent technical efficiency (efficiency score = 1) and the lower technical efficiency works at a percentage less than 100 (efficiency score < 1). The respondents were categorized to different technical efficiencies using frequency and percentage.
Results and Discussion
The data from the Table 1 shows the NTFPs collected by the respondents. Majority (68.24%) of the respondents extracted honey during April to May, which was sold to LAMPS at average selling price of ₹295.34 per kg. followed by Seegekayi, locally known as Seege, was collected by 27.06 per cent of the respondents, collected during February to May and was sold at average price of ₹47.71 per kg, Tress mosses, locally known as Mara Pachi was collected by 25.88 per cent of respondents during June -September months of the year and was sold to LAMPS at average price of ₹264.55 per kg. Tamarind (Hunase) was collected during December -January by 20.00 per cent of the respondents and sold at average price of ₹40.56 per kg, Gooseberry (Nellikayi) was collected during December -January was sold at average price of ₹22.31 per kg to LAMPS, was collected by 15.29 per cent respondents and Malabar Tamarind (Muruganahulli) was sold at average price of ₹64.17 per kg by 14.12 per cent respondents which was collected during December -January. Dalchini (Cinnamon) was collected by 10.59 per cent during December-January, was sold at average price of ₹35.00 per kg and Rampatre (Dodda jaikai), available during April -May was collected by 08.24 per cent and was sold at average price of ₹757.14 per kg to LAMPS. Only 04.71 per cent of the respondents collected white dammar, locally known as Sambrani during June -October months of the year and was sold to LAMPS at the average selling price of ₹157.50 per kg. In terms of total quantity collected by respondents, honey was collected 2271 kgs with 39.16 kgs of average quantity per respondent, Seegekayi was collected 1865 kgs with 77.71 kgs per respondent, Malabar tamarind was collected 1825 with 152.08 kgs per respondent, Cinnamon was collected 540 kgs with 60 kgs of average quantity per head and Gooseberry was collected total quantity of 375 kgs with 28.85 kgs per respondent. Further 280 kgs with 40 kgs per respondent, 215 kgs with 12.65 kgs per respondent and 212 kgs with average quantity of 9.64 kgs per respondent of Rampatre, Tamarind and Tree mosses were collected. Only 35 kgs of total quantity of White dammar with average quantity of 08.75 kgs per respondent was collected.
| Sl. No. | Name of the NTFP | Kannada/Local name | Collection period | Respondents collecting NTFP | — | Total Quantity collected (kgs) | Average Quantity collected per respondent/household (kgs) | Average Selling price to LAMPS (Rs. /kg) |
|---|---|---|---|---|---|---|---|---|
| Frequency | Percent | |||||||
| 1. | Honey | Jeenu | April – May | 58 | 68.24 | 2271 | 39.16 | 295.34 |
| 2. | Tree mosses | Mara Pachi | June – September | 22 | 25.88 | 212 | 9.64 | 264.55 |
| 3. | Soapnut | Seegekayi | February – May | 23 | 27.06 | 1865 | 77.71 | 47.71 |
| 4. | Rampatre | Dodda Jaikai | April – May | 07 | 08.24 | 280 | 40.00 | 757.14 |
| 5. | Gooseberry | Nellikayi | December – February | 13 | 15.29 | 375 | 28.85 | 22.31 |
| 6. | Malabar Tamarind | Muruganahulli | December – January | 12 | 14.12 | 1825 | 152.08 | 64.17 |
| 7. | White Dammar | Sambrani | June – October | 04 | 04.71 | 35 | 08.75 | 157.50 |
| 8. | Tamarind | Hunase | December – February | 17 | 20.00 | 215 | 12.65 | 40.56 |
| 9. | Cinnamon | Dalchini | December – January | 09 | 10.59 | 540 | 60.00 | 35.00 |
Table text extracted from the original PDF; superscript letters are shown inline. The original table image is below.
View original table image
Experience in NTFP collection
Table 2 indicated that two fifth (40.00%) of the respondents had medium level of experience and 27.06 per cent had high level of experience in collection of NTFP. The probable reasons may be as the majority of the respondents were middle aged (58.33%) and old aged (25.33%) (Table 10), they are collecting NTFPs from their adulthood so they had more experience. The tribal communities have passed down their knowledge of NTFP collection from generation to generation. On the other hand, 32.94 per cent of the respondents had lower experience of less than eight years in NTFP collection. These respondents belong to young age group and started collection of NTFPs recently.
| Category | Criteria | — | Frequency | Per cent |
|---|---|---|---|---|
| Low | less than 8 years | 28 | 32.94 | |
| Medium | 8 – 16 years | 34 | 40.00 | |
| High | more than 16 years | 23 | 27.06 | |
| SD = 7.94 |
Table text extracted from the original PDF; superscript letters are shown inline. The original table image is below.
View original table image
Number of family members involved in NTFP collection
Data furnished in the Table 3 indicated that, only one member (60.00%) from the respondents' household involved in NTFP collection, as the results revealed that majority respondents took NTFP collection as secondary www.extensionjournal.com occupation hence only one individual from the family collects NTFP. However, it is important to note that even if only one member of a household is involved in NTFP collection, it can still be a significant source of income for that household. Whereas, from 29.41 per cent of the respondents' family two individuals and three individuals (10.59%) were involved in NTFP collection. The probable reason may be because some households might feel NTFP collection is a shared responsibility and these respondents are having joint family type where more than one member are available for NTFP collection in their family.
| Sl. No. | Category | Criteria | Frequency | Per cent |
|---|---|---|---|---|
| 1. | Low | One individual | 51 | 60.00 |
| 2. | Medium | Two individuals | 25 | 29.41 |
| 3. | High | Three individuals | 09 | 10.59 |
Table text extracted from the original PDF; superscript letters are shown inline. The original table image is below.
View original table image
Duration of NTFP collection
The results from Table 4 revealed that 45.88 per cent and 27.06 per cent of the respondents belongs to moderate and less category in duration of NTFP collection, these respondents belong to LAMPS present in Udupi, Puttur where numbers of members are more and NTFPs available in these places are low hence duration of NTFP collection is moderate and low. On the contrary, 27.06 per cent of the respondents fall into high duration of NTFP collection, these respondents belongs to Koppa, Yellapura LAMPS where number of members is relatively less and are located where the NTFPs are abundant making them to collect for a greater number of days.
| Sl. No. | Category | Criteria | — | Frequency | Per cent |
|---|---|---|---|---|---|
| 1. | Less | less than 30 days | 23 | 27.06 | |
| 2. | Moderate | 30 – 50 days | 39 | 45.88 | |
| 3. | High | more than 50 days | 23 | 27.06 | |
| Mean = 39.76 | SD = 20.18 |
Table text extracted from the original PDF; superscript letters are shown inline. The original table image is below.
View original table image
Income earned through NTFP collection
It was found from the Table 5 that majority (44.71%) of the respondents earned medium level of income, this is attributed to the fact that NTFPs are often abundant and the collection is often a low-cost activity. While 40.00 per cent earned low income, maybe because of the low prices of NTFPs and some tribal communities live in areas where NTFPs are not abundant, thus, yields low income. 15.29 per cent earned high income from NTFP collection; these per cent of respondents have collected a good quantity of NTFPs and marketed at high prices.
| Sl. No. | Category | Criteria | — | Frequency | Per cent |
|---|---|---|---|---|---|
| 1. | Low | less than 6471.71 | 29 | 34.12 | |
| 2. | Medium | 6471.71 – 20266.29 | 43 | 50.59 | |
| 3. | High | more than 20266.29 | 13 | 15.29 | |
| Mean = 13369.00 | SD = 13794.58 |
Table text extracted from the original PDF; superscript letters are shown inline. The original table image is below.
View original table image
efficiency respondents in NTFP collection
The mean score of technical efficiency of respondents collecting NTFPs was found to be 0.29. Majority (28.24%) of the respondents had technical efficiency between 0.11 to 0.20 followed by 24.71 per cent of respondents had below 0.10 technical efficiency, 11.76 per cent respondents had 0.21 to 0.30 technical efficiency, 10.59 per cent had 0.51 to 0.60 technical efficiency, 9.41 per cent had 0.31 to 0.40 technical efficiency and 5.88 per cent had 0.41 to 0.50 technical efficiency, indicating low technical efficiency. Respondents belonging to the technical efficiency interval 0.61 to 0.70, 0.71 to 0.80, 0.91 to 1.00 and 0.81 to 0.90 were 3.53 per cent, 2.35 per cent, 2.35 per cent and 1.18 per cent, respectively indicated high technical efficiency (Table 6). Majority belonged to technical efficiency less than 0.50 indicating that respondents are less efficient technically, factors for this might be due to majority involved in agriculture and other business rather involving in NTFP collection and involved respondents spent less duration in collection, low to medium knowledge regarding the scientific and sustainable collection of NTFPs and low level of experience in NTFP collection.
| Sl. No. | Technical efficiency | Frequency | Per cent |
|---|---|---|---|
| 1. | 0.00 – 0.10 | 21 | 24.71 |
| 2. | 0.11 – 0.20 | 24 | 28.24 |
| 3. | 0.21 – 0.30 | 10 | 11.76 |
| 4. | 0.31 – 0.40 | 08 | 9.41 |
| 5. | 0.41 – 0.50 | 05 | 5.88 |
| 6. | 0.51 – 0.60 | 09 | 10.59 |
| 7. | 0.61 – 0.70 | 03 | 3.53 |
| 8. | 0.71 – 0.80 | 02 | 2.35 |
| 9. | 0.81 – 0.90 | 01 | 1.18 |
| 10. | 0.91 – 1.00 | 02 | 2.35 |
Table text extracted from the original PDF; superscript letters are shown inline. The original table image is below.
View original table image
References
5 in the original paper- Anonymous. Ann Rep (2022-23). Karnataka Forest Department; c2023. p. 129.
- Campbell JY. Putting people's products first, nontimber forest products and the challenge of managing forests to enhance local income. J Non-Timber for Prod. 1994;1(1/2):102-7.
- Chinnappa B, Patil KKR, Sowmya HS. Economic impact of Custom Hiring Service Centers in Maize cultivation: A case study from Karnataka. Int J Agric Econ. 2018;73(4):478-500.
- Sekhar C, Rai VS, Ramasamy C. Role of minor forest products in tribal economy of India: A case study. J Trop For Sci. 1996;8(3):280-288.
- Suresh K, Chandrakanth MG. Economic efficiency of improved red gram variety (BRG-2) in Karnataka: a DEA analysis. Econ Aff. 2016;61(1):81-88.