
Research article · 2024 · Full text
International Journal of Agriculture Extension and Social DevelopmentLand use land cover change detection analysis in kodjai watershed using remote sensing and GIS
Volume 7(7S) · Pages 182–185 · DOI: 10.33545/26180723.2024.v7.i7sc.841 ↗
Research areasLand Use and Ecosystem ServicesRemote Sensing in AgricultureConservation, Biodiversity, and Resource Management
Abstract
Author-writtenChanges in Land use land cover are a dynamic process taking place on the surface and it becomes a central component in current strategies in managing natural resources and monitoring environmental changes. LULC change detection is the process that helps in determining the changes related with land use and land cover with reference to geo-rectify remote sensing data. This purpose of this study is therefore concerned with identifying the change in land use and land cover detection of the Kodjai watershed in Dapoli, Ratnagiri. To identify land cover changes detection; remote sensing data, satellite imagery and image processing techniques had done within three dates of 2017 and 2024 using Sentinel-2 images having 10m resolution. Arc GIS software had used to identify the changes. The classification had done using seven land cover (dense vegetation, agriculture, settlement, waterbody, fallow, orchards and grassland) class. Pre-processing and classification of the images had analysed carefully and accuracy assessment was tested separately using the kappa coefficient. Tewabe and Fentahun (2020) checked the accuracy of the classification using the kappa coefficient. The result of the study showed that significant change detection had observed during the study period. Settlement and orchards showed an increasing trend of 2.04% and 6.08%, respectively, while dense vegetation, agricultural land and fallow land showed a decreasing trend of 1.22%, 4.64% and 1.36%, respectively. It was also noted that there was no appreciable change in the area under the water bodies and grasslands.
Summary
Source-checkedPlain-language reading of the full paper, prepared with AI and checked against the text. Each point links to the authors' own words.
Why it matters
- Land use and land cover (LULC) changes are dynamic processes that are essential for managing natural resources and monitoring environmental shifts. View evidence ↗
- Growing populations and human activities have increased the demand for land and soil resources for industrial, urban, and agricultural purposes. View evidence ↗
- Remote Sensing (RS) and Geographic Information Systems (GIS) provide cost-effective and powerful means to assess temporal and spatial LULC changes. View evidence ↗
The question
- The study aims to identify and detect changes in land use and land cover within the Kodjai watershed located in Dapoli, Ratnagiri. View evidence ↗
What they did
- The research was conducted in the Kodjai watershed in the Ratnagiri district of Maharashtra, covering an area of approximately 82 km². View evidence ↗
- The study used Sentinel-2 satellite imagery with a 10m resolution from 2017 and 2024 to detect land cover changes. View evidence ↗
- Land cover was classified into seven categories: agriculture, settlement, waterbody, fallow, orchards, grassland, and dense vegetation. View evidence ↗
- The researchers employed supervised classification with the maximum likelihood method to categorize land use patterns. View evidence ↗
- The accuracy of the image classification was assessed using the kappa coefficient. View evidence ↗
What they found
- Agricultural land saw the largest decrease at 4.64%, followed by fallow land at 1.36% and dense vegetation at 1.22%. View evidence ↗
- Water bodies and grasslands experienced minor decreases of 0.05% and 0.81%, respectively. View evidence ↗
- The overall mapping accuracy was 92.5% for the year 2017 and 90% for 2024. View evidence ↗
- The kappa coefficient for accuracy validation was 91.16% in 2017 and 88.29% in 2024. View evidence ↗
What it means
- The authors conclude that the conversion of agricultural land into settlement areas could potentially lead to food scarcity. View evidence ↗
- The authors state that GIS and remote sensing analysis provides critical data for planners and decision-makers to implement sustainable land management. View evidence ↗
Visual summary
1 visualsIllustrations explain the paper; they do not show study data.
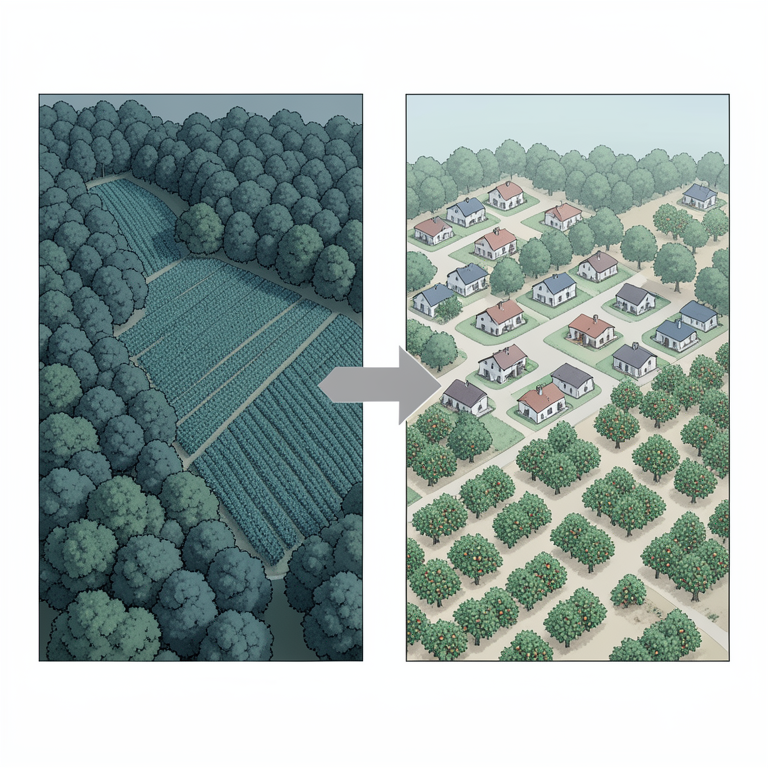
LULC Shift Summary
AI-generated conceptual illustration (Kodjai watershed landscape). It explains the idea and does not show study data.
View source evidence ↗Figures & tables
From the original paper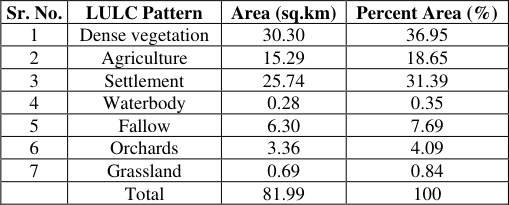 Table 1
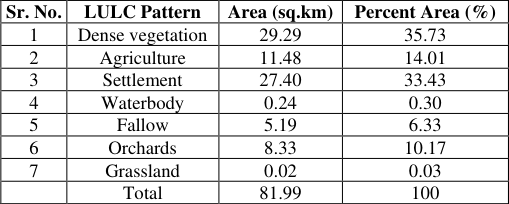 Table 2
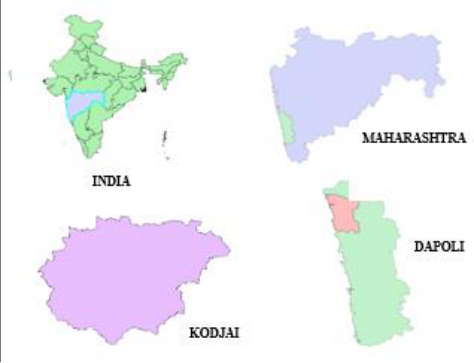 Figure 1
 Table 3
 Table 4
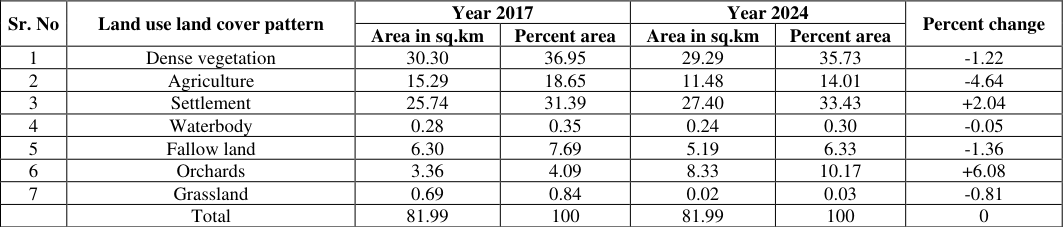 Table 5
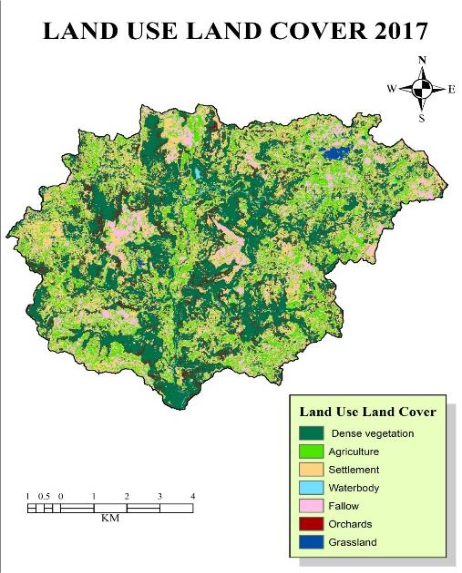 Figure 2
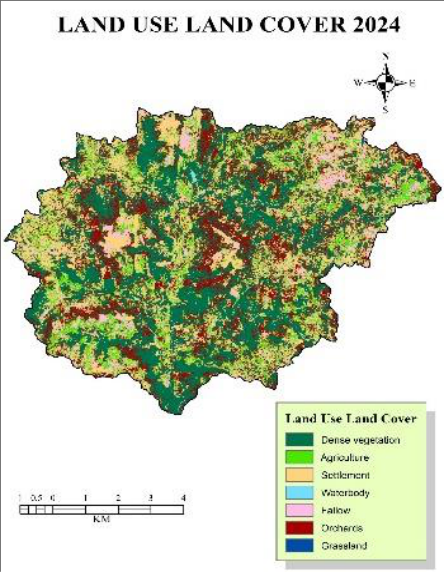 Figure 3
Introduction
Land and water are the very important natural resources on the Earth surface. Despite of it today humans are using it haphazardly. Now, a day the increase in population and human activities are increasing the demand on the land and soil resources for agriculture urban and industrial uses. Seyam et al. (2024) [5] studied rapidly industrializing area in Mymensingh, Bangladesh. Land cover refers to the physical characteristics of the Earth's surface like vegetation, water, soil, forest, hills and others. Land use refers changes done by anthropogenic activities. Land use and land cover change study are very essential for determining the current scenario and for the management of natural resources and environmental problem. The Land Use and Land Cover (LULC) is the type of cover covering the surface of the Earth. The conventional methods of land use mapping are tedious, time consuming and laborious. Hassan et al. (2016) [4] and Gondwe et al. (2021) [3] used satellite imagery and supervised classification algorithms, it is easy to quantify the spatial and temporal dynamics of land use/cover changes effectively. The modern technologies like Geographic Information Systems (GIS) and Remote Sensing (RS) are powerful and cost-effective tools for assessing the spatial and temporal change of LULC. Venukumar and Laxmaiah (2022) [7] emphasized the cost-effectiveness of remote sensing and GIS tools in mapping land use and land cover (LULC) and detecting changes, providing a detailed understanding of land cover change processes and their impacts. Remote sensing data is the most common source for detection, quantification, and mapping of LULC patterns due to its repetitive data acquisition, suitable for processing, and accurate geo-referencing. Amini et al. (2022) [1] tried to introduce an algorithm utilizing Landsat time-series data to analyse land use and land cover (LULC) change. The www.extensionjournal.com objectives of this study is to prepare the maps showing the land use land cover and to compare the land use land cover changes for Kodjai watershed
Materials and Methodology
This study was conducted in Kodjai watershed in Dapoli, located in Ratnagiri district of Maharashtra. The area covers approximately about 82 km². The location of study area is 17°50'30''N Latitude and 73°5'30''E Longitude, Maharashtra. The climate in this area is tropical. During most months of the year, there is significant rainfall. The temperature in Kodjai watershed is 27.4°C to 32.9°C. The study area of the research work is shown in the Fig. 1. [2] analysed Land Cover Mapping and Change Detection in Northern Ethiopia. The study found that the area under cultivation, wood bush, shrub, grass and forest land was 63%, 12%, 8%, 6%, 4% and 2% of the total area respectively. There are various methods to identify different land use patterns using Arc GIS as iso cluster unsupervised Classification, natural neighbour classification, maximum likelihood classification, etc. The accuracy of different classification methods varies with type of data and the number of training samples provided. Among mentioned methods the supervised classification with maximum likelihood classification gives better accuracy. Therefore, this method was used to classify the study area into different land use patterns.
Accuracy assessment by using Kappa coefficient:
The accuracy of land use land cover for Kodjai watershed was calculated using the Kappa coefficient. The different reference points selected from the land use maps of Kodjai watershed were compared with the Google Earth image.
Detection of changes in land use
Detection of changes in land use
Results
The result of the study showed that significant change detection had observed during the study period. Settlement and orchards showed an increasing trend of 2.04% and 6.08%, respectively, while dense vegetation, agricultural land and fallow land showed a decreasing trend of 1.22%, 4.64% and 1.36%, respectively. It was also noted that area under the water bodies and grasslands was decreased by 0.05% and 0.81%. The overall accuracy of land use mapping for Kodjai watershed for the year 2017 and for the year 2024 was 92.5% and 90%, respectively. At the same time, the kappa coefficient was 91.16% and 88.29% for the year 2017 and for the year 2024, respectively.
Conclusion
In this study, Land use land cover change detection over the last 8 years had analysed. The result of the study showed that significant change detection had observed during the study period. Settlement and orchards showed an increasing trend, while dense vegetation, agricultural land and fallow land showed a decreasing trend. It was also noted that there was no appreciable change in the area under the water bodies and grasslands. The validation of land use mapping was done using Kappa coefficient. It was observed that the grade of accuracy was excellent. The result revealed that the change of agriculture to settlement area which may results in scarcity of food. In this study, the change detection analysis using GIS and remote sensing could deliver useful information to understand the patterns of land use dynamics for planners and decision-makers consequently sustainable land management planning is possible.
Figures and tables from the paper
| Sr. No. | LULC Pattern | Area (sq.km) | Percent Area (%) |
|---|---|---|---|
| 1 | Dense vegetation | 30.30 | 36.95 |
| 2 | Agriculture | 15.29 | 18.65 |
| 3 | Settlement | 25.74 | 31.39 |
| 4 | Waterbody | 0.28 | 0.35 |
| 5 | Fallow | 6.30 | 7.69 |
| 6 | Orchards | 3.36 | 4.09 |
| 7 | Grassland | 0.69 | 0.84 |
| Total | 81.99 | 100 |
Table text extracted from the original PDF; superscript letters are shown inline. The original table image is below.
View original table image
| Sr. No. | LULC Pattern | Area (sq.km) | Percent Area (%) |
|---|---|---|---|
| 1 | Dense vegetation | 29.29 | 35.73 |
| 2 | Agriculture | 11.48 | 14.01 |
| 3 | Settlement | 27.40 | 33.43 |
| 4 | Waterbody | 0.24 | 0.30 |
| 5 | Fallow | 5.19 | 6.33 |
| 6 | Orchards | 8.33 | 10.17 |
| 7 | Grassland | 0.02 | 0.03 |
| Total | 81.99 | 100 |
Table text extracted from the original PDF; superscript letters are shown inline. The original table image is below.
View original table image
| Sr. No. | Land use pattern | User accuracy | Grade | Producer accuracy | Grade | Overall accuracy | Grade |
|---|---|---|---|---|---|---|---|
| 1 | Dense vegetation | 100 | Excellent | 77.77 | Very good | 91.16 | Excellent |
| 2 | Agriculture | 85.71 | Excellent | 100 | Excellent | ||
| 3 | Settlement | 100 | Excellent | 100 | Excellent | ||
| 4 | Waterbody | 100 | Excellent | 100 | Excellent | ||
| 5 | Fallow | 100 | Excellent | 85.71 | Excellent | ||
| 6 | Orchards | 66.66 | Very good | 100 | Very good | ||
| 7 | Grassland | 100 | Excellent | 100 | Excellent |
Table text extracted from the original PDF; superscript letters are shown inline. The original table image is below.
View original table image
| Sr. No. | Land use pattern | User accuracy | Grade | Producer accuracy | Grade | Overall accuracy | Grade |
|---|---|---|---|---|---|---|---|
| 1 | Dense vegetation | 100 | Excellent | 60 | Good | 88.29 | Excellent |
| 2 | Agriculture | 100 | Excellent | 100 | Excellent | ||
| 3 | Settlement | 83.33 | Excellent | 100 | Excellent | ||
| 4 | Waterbody | 85.71 | Excellent | 100 | Excellent | ||
| 5 | Fallow | 100 | Excellent | 100 | Excellent | ||
| 6 | Orchards | 66.66 | Very good | 100 | Very good | ||
| 7 | Grassland | 100 | Excellent | 100 | Excellent |
Table text extracted from the original PDF; superscript letters are shown inline. The original table image is below.
View original table image
| Sr. No | Land use land cover pattern | Year 2017 | — | Year 2024 | — | Percent change |
|---|---|---|---|---|---|---|
| Area in sq.km | Percent area | Area in sq.km | Percent area | |||
| 1 | Dense vegetation | 30.30 | 36.95 | 29.29 | 35.73 | -1.22 |
| 2 | Agriculture | 15.29 | 18.65 | 11.48 | 14.01 | -4.64 |
| 3 | Settlement | 25.74 | 31.39 | 27.40 | 33.43 | +2.04 |
| 4 | Waterbody | 0.28 | 0.35 | 0.24 | 0.30 | -0.05 |
| 5 | Fallow land | 6.30 | 7.69 | 5.19 | 6.33 | -1.36 |
| 6 | Orchards | 3.36 | 4.09 | 8.33 | 10.17 | +6.08 |
| 7 | Grassland | 0.69 | 0.84 | 0.02 | 0.03 | -0.81 |
| Total | 81.99 | 100 | 81.99 | 100 | 0 |
Table text extracted from the original PDF; superscript letters are shown inline. The original table image is below.
View original table image
References
7 in the original paper- Amini S, Saber M, Rabiei-Dastjerdi H, Homayouni S. Urban Land Use and Land Cover Change Analysis Using Random Forest classification of Landsat Time Series. Remote Sens. 2022;14(11):2654. DOI: 10.3390/rs14112654.
- Ayele GT, Tebeje AK, Demissie SS. Time series land Cover mapping and Change Detection Analysis Using Geographic Information System and Remote Sensing, Northern Ethiopia. Air Soil Water Res. 2018;11:1-18. DOI: 10.1177/1178622117751603.
- Gondwe JF, Lin S, Munthali RM. Analysis of Land Use and Land Cover Changes in Urban Areas Using Remote Sensing: Case of Blantyre City. Discrete Dyn Nat Soc; c2021. p. 1-17. DOI: 10.1155/2021/8011565.
- Hassan Z, Shabbir R, Ahmad SS, Malik AH, Aziz N, Butt A, et al. Dynamics of Land Use and Land Cover Change (LULCC) Using Geospatial Techniques: A Case Study of Islamabad Pakistan. SpringerPlus. 2016;5(1):812. DOI: 10.1186/s40064-016-2414-z.
- Seyam H, Mahadi M, Saha J, Ria SS, Sultana J, Shima UA, et al. Assessing Seasonal Dynamics of Land Surface Temperature (LST) and Land Use Land Cover (LULC) in Bhairab, Kishoreganj, Bangladesh: A Geospatial Analysis from 2008 to 2023. Case Stud Chem Environ Eng. 2024;9:100560. DOI: 10.1016/j.cscee.2023.100560.
- Tewabe D, Fentahun T. Assessing Land Use and Land Cover Change Detection Using Remote Sensing in the Lake Tana Basin, Northwest Ethiopia. Cogent Environ Sci. 2020;6(1):1778998. DOI: 10.1080/23311843.2020.1778998.
- Venukumar A, Laxmaiah BL. Role of GIS and remote sensing in land use and land cover studies. 2022;10(1):2320-2882.