
Research article · 2024 · Full text
International Journal of Agriculture Extension and Social DevelopmentStudies on procurement, processing and distribution of Parag milk and milk products Palamaner in Chittoor district
Volume 7(7) · Pages 551–555 · DOI: 10.33545/26180723.2024.v7.i7h.856 ↗
Research areasAgricultural Economics and PracticesLivestock Management and Performance Improvement
Abstract
Author-writtenParag Milk Foods Ltd.is a leading dairy brand known for its efficient processing and distribution of high-quality dairy products. The company employs advanced technology in milk processing, ensuring products like milk, butter, cheese, and yogurt meet stringent quality standards. Parag Milk Foods Ltd. emphasizes the importance of maintaining the cold chain during distribution to ensure freshness and extend shelf life. With a robust logistics network, the dairy efficiently distributes products to urban and rural areas. The focus on sustainability is evident through eco-friendly packaging and waste management practices. Parag Dairy's commitment to innovation and customer satisfaction has solidified its reputation in the dairy industry.
Summary
Source-checkedPlain-language reading of the full paper, prepared with AI and checked against the text. Each point links to the authors' own words.
Why it matters
- India has maintained its position as the world's top producer and consumer of dairy products since 1998. View evidence ↗
- Despite a market value of 14,899.8 billion in 2022, the Indian dairy industry remains largely unorganized and is primarily driven by small-scale farmers. View evidence ↗
- India contributes 24% of the total global milk production. View evidence ↗
What they did
- The research focused on Parag Milk Foods Ltd., a private dairy unit in Palamaner, Andhra Pradesh, established in 1992. View evidence ↗
- Economic performance was assessed using the Benefit Cost ratio and the break-even point. View evidence ↗
What they found
- Between 2013-2014 and 2022-2023, milk procurement increased by 299% and milk sales increased by 287.5%. View evidence ↗
- The annual compound growth rates for milk procurement (22.84%) and sale (22.55%) were positively significant at the 10% level. View evidence ↗
- The average purchase price for milk was Rs. 27 per liter during the flush season and Rs. 27.45 per liter during the lean season. View evidence ↗
- The company reported a net revenue of Rs. 28,532,000,000 and an Operating Profit (EBITDA) of Rs. 1,389,550,000. View evidence ↗
- Financial ratios showed a revenue growth of 40.9%, a gross profit margin of 19.1%, an EBITDA margin of 4.9%, and a net margin of 2.4%. View evidence ↗
What it means
- The authors conclude that the Indian dairy industry is restructuring to meet globalization and demand, with a necessary focus on raw milk quality, processing efficiency, and value-added products. View evidence ↗
Visual summary
1 visualsIllustrations explain the paper; charts are replotted from the paper's own table values.
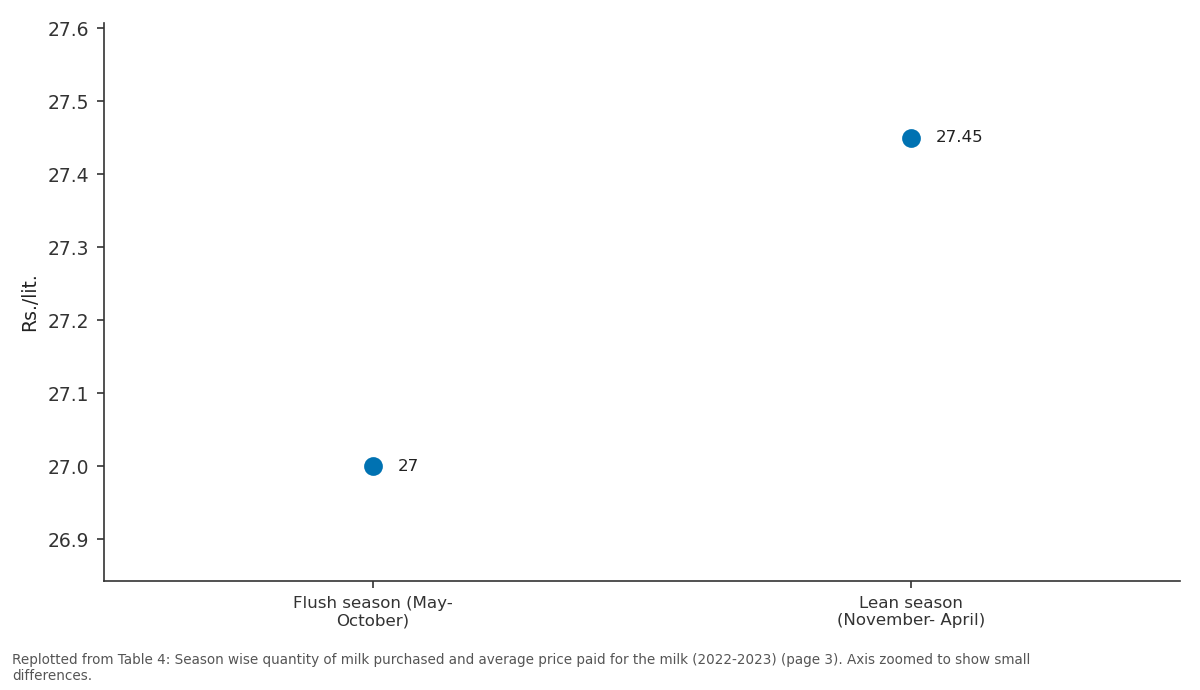
Average purchase price (Rs./lit.): Flush season (May-... vs Lean season (November-...
Replotted from Table 4 (page 3) of the original paper. Every bar is the paper's own table value.
View source evidence ↗Figures & tables
From the original paper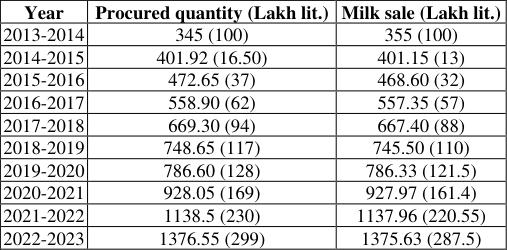 Table 1
 Table 2
 Table 3
 Table 4
Introduction
India has been the leading producer and consumer of dairy products since 1998, with a sustained growth in milk availability and consumption. The dairy market in India reached a value of 14,899.8 billion in 2022, but the industry is still highly unorganized, dominated by small and marginal dairy farmers. The Indian government has introduced various schemes and initiatives to develop the dairy sector, such as the "National Dairy Programme (Phase-I)" to improve cattle productivity and increase milk production. Private companies and investors are entering the Indian dairy sector, focusing on value-added products like cheese, yogurt, and probiotic drinks. The market is expected to reach INR 31185.7 billion by 2028, exhibiting a CAGR of around 13% during 2023-2028. India's milk production is growing at a rate of 2% in the world, with the top milkproducing states being Rajasthan (33.27%), Uttar Pradesh (33.11%), and Madhya Pradesh (19%). India is the highest milk producer in the world, contributing 24% of global milk production. The dairy products market is valued at around 4000 billion, with ice cream industry worth around 25 billion. 70% of milk is produced by marginal farmers, and carton milk or packaged milk is growing at 24% annually. The Indian dairy industry has seen significant growth since the approval of the General Agreement on Tariffs and Trade (GATT) in 1993. India signed the Uruguay Round Agreement on Agriculture (AOA) in 1994, which brought agricultural policies under greater multilateral discipline through the World Trade Organization (WTO). The AoA focuses on market access, domestic support, and export subsidies, but has faced challenges in addressing high tariffs on dairy products. The Milk and Milk Products Order (MMPO) was promulgated in 1992 to regulate milk and milk products production in India. In 2003, the GOI abolished restrictions on setting up milk processing and manufacturing plants, while retaining requirements for food safety and hygiene. Initiatives such as the Anand Pattern, a cooperative movement, and Operation Flood have contributed to the development of Indian dairying. These initiatives have helped to increase milk production and promote the country's dairy industry. www.extensionjournal.com processing, and distribution of milk and milk products, were obtained from the unit's annual report and relevant records for 2022-2023. A pretested schedule was used to gather information about resource, technical, financial, personnel, inventory, procurement, processing, and distribution management. Data collection was primarily based on secondary data from the selected dairy unit, including personal interviews with officers and office bearers. The study aims to provide meaningful results to achieve the objectives under study. The study focuses on various areas of management within a milk processing unit, including resource management, plant and machinery management, financial management, personal management, procurement management, processing management, distribution management, and marketing. The costs of procurement, processing, and distribution are classified as fixed costs, variable costs, and total costs. Fixed costs include land rent, depreciation, building, machinery, equipment, and interest on fixed capital investments. Variable costs include wages, allowances, electricity, commission, transport charges, material and supplies. Total costs include fixed costs plus variable costs. The estimated costs for procurement, processing, distribution, administration, and other charges were calculated on a per-unit basis, with land rent and interest on fixed capital calculated at a rate of ___ percent per annum on the value of land and fixed capital assets. Gross returns included the value of milk processed and milk product produced, interest received, and dividend realized from other institutions. Net profitability was estimated by deducting total costs from gross returns. The Benefit Cost ratio was used to assess the economic performance of the milk processing unit. The break-even point was determined by dividing the total returns by the total costs. The study also examined the impact of the production process on the organization's net profitability.
History and profile of parag milk foods ltd., palamaner (chittoor district)
Parag Milk Foods Ltd., established in 2010, is a popular dairy unit located in Chittoor district, Palamner town on the Andhra Pradesh-Karnataka border. The unit, known as "Gowardhan," has 15 acres of processing space and has established a special relationship with milk producers, distributors, and retailers. With steady growth in popularity, Parag Milk Foods chairman Shri Devendra Shah expects the company to reach Rs. 400 Crore revenue by 2027-2028. The company manufactures various milk products, including ghee, liquid milk, skim milk powder, dairy whitener, whole milk milk powder, cheese, real milk powder, and Gulab jamun mix. Parag Milk Foods Ltd. is an ISO 9000/22000, AGMARK certified company and markets its products under the brand name "Gowardhan." The company's milk procurement process involves cans and tankers, with milk collected from individual farmers, milk co-operative societies, and private contractors. Parag Milk Foods Ltd. Dairy unit has a strong financial position and consists of various departments, including administration, personnel, store, production, quality control, maintenance, and marketing. The top management ensures that responsibilities and authorities are defined and communicated within the organization. The management employees contribute to the achievement of the quality objectives of the dairy unit. The Chairman and Managing Director prepares corporate quality policy and objectives, sets direction with mission and vision, and guides the General Manager in making resource allocation. The General Manager handles all financial and accounts activities, conducts monthly internal audits, plans day-today production, evaluates milk suppliers, and plans production according to market and availability of milk and other raw materials. The Production Manager plans production and ensures products are manufactured and packed according to customer or industry requirements. The Quality Control Manager decides specifications for raw ingredients packaging material and finished products, authorizes release of raw material, ingredients packaging material, and final products, and finalizes artwork for packing material in coordination with the General Manager. The flow chart for milk processing and ghee manufacturing outlines the process of preparing, preheating, setting, filtering, packaging, and storage. The Dahi unit receives milk, undergoes pre heating, clarifications, standardization, and homogenization.
Performance of milk procurement and milk sale of Parag Milk Foods Ltd.
The success of any milk unit is depending on various factors of which adequate procurement of raw milk is one of the important one. After the procurement of milk, the sale of goods quality milk is another factor indicating the business performance of a unit. The information regarding the milk procurement and milk sale of Parag Milk foods unit. is given in table 7.2. It is evident from the table 1 that the procurement of milk and milk sale have increased by 299 percent and 287.5 percent, respectively during the period from 2013 -2014 to 2022-2023. The procurement of milk and milk sale has increased continuously from the base year 2013-2014 to 2022-2023. However, the rate of increase in procurement of milk was more than that of the rate increase in milk sale. www.extensionjournal.com It is revealed from the table 2 that, the annual compound growth rates of milk procurement and sale were 22.84 percent and 22.55 percent, respectively. The same were positively significant at 10 percent level of significance.
| Sr. No. | Particulars | Compound growth Rate (CGR) | Linear Compound Growth Rate (LGR) |
|---|---|---|---|
| 1. | Procurement of milk | 22.84% | 29.89% |
| 2. | Sale of milk | 22.55% | 28.76% |
Table text extracted from the original PDF; superscript letters are shown inline. The original table image is below.
View original table image
| Year | Procured quantity (Lakh lit.) | Milk sale (Lakh lit.) |
|---|---|---|
| 2013-2014 | 345 (100) | 355 (100) |
| 2014-2015 | 401.92 (16.50) | 401.15 (13) |
| 2015-2016 | 472.65 (37) | 468.60 (32) |
| 2016-2017 | 558.90 (62) | 557.35 (57) |
| 2017-2018 | 669.30 (94) | 667.40 (88) |
| 2018-2019 | 748.65 (117) | 745.50 (110) |
| 2019-2020 | 786.60 (128) | 786.33 (121.5) |
| 2020-2021 | 928.05 (169) | 927.97 (161.4) |
| 2021-2022 | 1138.5 (230) | 1137.96 (220.55) |
| 2022-2023 | 1376.55 (299) | 1375.63 (287.5) |
Table text extracted from the original PDF; superscript letters are shown inline. The original table image is below.
View original table image
Size of business
Parag milk foods ltd. Dairy unit is actively involved in the activities of procurement, processing and distribution of milk as well as manufacturing and marketing of its milk products. The size of the business activity could therefore, be measured in terms of magnitude of the volume of milk and milk products processed by the Parag Milk Foods Ltd.unit (Gwordhan). It is revealed from the table 3 that the total quantity of milk procured by the dairy unit was 1376.55 lakh. Litres with an average daily procurement of 3.75 lakh litres. In the total quantity of milk procured in a year the losses were to the extent of 13.76 lakh litres i.e. 1 percent in procurement, handling and transport. Thus, the quantity of milk processed by this dairy unit was 1362.79 lakh litres (99 percent) of the total milk procured by the dairy unit. Out of this 71 percent quantity of milk was distributed as liquid milk and remaining 29 percent was used for manufacturing the different milk products.
| Sr. No. | Particulars | Quantity of milk (lakh lit.) | Percent % |
|---|---|---|---|
| 1. | Total quantity of milk procured during the year | 1376.55 | 100 |
| 2. | Daily average procurement of the milk | 3.75 | |
| 3. | Average quantity of milk lost in procurement, handling and transport during the year | 13.76 | __ 1 |
| 4. | Actual total quantity of milk processed | 1362.79 | 99 |
| 5. | Quantity of milk distributed as liquid milk | 967.59 | 71 |
| 6. | Quantity of milk used for manufacturing milk products | 395.2 | 29 |
Table text extracted from the original PDF; superscript letters are shown inline. The original table image is below.
View original table image
Purchase cost of milk
The purchase cost of milk comprised of mainly the price paid to the milk producers. The raw milk price, paid to the milk producers was the major item of the total cost structure of the business. Table 4 present the information regarding the total quantity of milk procured, per litre price of raw milk in different seasons and average per litre price of milk during the year 2022-2023.
| Sr. No. | Season | Qty. of milk procured (lakh lit.) | Average purchase price (Rs./lit.) |
|---|---|---|---|
| 1. | Flush season (May- October) | 551.55 | 27 |
| 2. | Lean season (November- April) | 825 | 27.45 |
| 3. | Total milk purchased | 1376.55 | 27.29 |
Table text extracted from the original PDF; superscript letters are shown inline. The original table image is below.
View original table image
References
3 in the original paper- Rao KP, Sharma P. Problem of dairy co-operative in URMUL, Bikaner, Rajasthan. Indian Dairyman. 2003;55:41-417.
- Sharma P, Joglekar PV. Marketing of milk: an opinion survey of consumer perceptions. Indian J Mktg. 2002;32(1-12):10-13.
- Vaswani LK. Towards efficient channel management in marketing dairy products. Indian Dairyman. 2002;54(2):108-111.