
Research article · 2024 · Full text
International Journal of Agriculture Extension and Social DevelopmentSocio-economic profile of rural farm women and their decision making pattern in agricultural activities in Mulugu district of Telangana
Volume 7(7) · Pages 420–424 · DOI: 10.33545/26180723.2024.v7.i7f.832 ↗
Research areasLivestock Management and Performance ImprovementAgricultural Economics and Practices
Abstract
Author-writtenWomen in general play a pivotal role in agriculture in Telangana state. They carry out various activities in agriculture like cleaning of fields, preparation of field, sowing, intercultural practices, weeding, harvesting, picking, cleaning of grains, drying of grains and so forth. But, unfortunately, they remain as invisible people. However, their involvement as decision makers regarding these activities is questionable. Hence the study was carried out to analyze the contribution of rural farm women in decision - making in agriculture. For this the primary data was collected through structured questionnaire using a sample size of 120 respondents from eight villages of two mandals i.e Mangapet and Eturnagaram of Mulugu district. From each village 15 respondents were selected and from each mandal 4 villages were selected. The results of the study revealed that the majority 50.84 percent of the farm women were middle-aged between 36 to 50 years and most of the farm women were illiterates (44.17%). Majority of the farm women maintain nuclear family with 4-6 members. Most of the farm women belonged to small- medium landing categories who are involved in agricultural activities. The annual income of the majority of the respondents ranged between Rs. 50,001/- 1,00,000/-. The participation of farm women was recorded as both family labor and paid wage labor as agricultural workers in this study. It was observed that the joint decision-making power of farm women was highest in utilization of farm income and lowest in irrigation management.
Summary
Source-checkedPlain-language reading of the full paper, prepared with AI and checked against the text. Each point links to the authors' own words.
Why it matters
- Agriculture is a critical component of the Indian economy, contributing 17% to the total GDP. View evidence ↗
- Women in Telangana are essential to agriculture, performing tasks from field preparation to grain drying, yet they often remain 'invisible' in the sector. View evidence ↗
- Mulugu district is characterized by a very high rural population (96.10%) and the highest percentage of agricultural laborers (64.8%) in the region. View evidence ↗
The question
- The study aimed to analyze how rural farm women contribute to decision-making processes within agricultural activities. View evidence ↗
What they did
- Primary data was gathered via structured questionnaires from 120 respondents across eight villages in the Mangapet and Eturnagaram mandals of Mulugu district. View evidence ↗
- Participants were selected based on their involvement in farming major crops, including rice, cotton, maize, and chilli. View evidence ↗
What they found
- The majority of the surveyed women were middle-aged (50.84%) and a significant portion (44.17%) were illiterate. View evidence ↗
- Most respondents (35.84%) held small-to-medium landholdings ranging from 2.00 to 4.00 acres. View evidence ↗
- The most common annual income range for the respondents was between Rs. 50,001 and Rs. 1,00,000 (39.17%). View evidence ↗
- For 54.17% of the women, the primary occupation was a combination of agriculture and agricultural labor. View evidence ↗
- Women had the highest decision-making power regarding government schemes like Anganwadi (4.68) and MNERGA (4.47), and the utilization of farm income (4.42). View evidence ↗
- Women had the lowest decision-making power in irrigation management (score of 1.38) and limited influence over crop variety and input purchases. View evidence ↗
- Landholding, family income, and occupation were found to have a positive and significant relationship with the women's decision-making power. View evidence ↗
- Factors such as age, education, family type, and family size did not show a significant relationship with decision-making power. View evidence ↗
What it means
- The authors conclude that there is an urgent need for awareness and training programs to help farm women become more assertive in decision-making for home and farm activities. View evidence ↗
- The authors suggest that future research should include a broader perspective and a larger number of independent variables. View evidence ↗
Visual summary
2 visualsIllustrations explain the paper; charts are replotted from the paper's own table values.
%: Young (15-35) vs Middle(36-50) vs Old (45-59)
Replotted from Table 1 (page 2) of the original paper. Every bar is the paper's own table value.
View source evidence ↗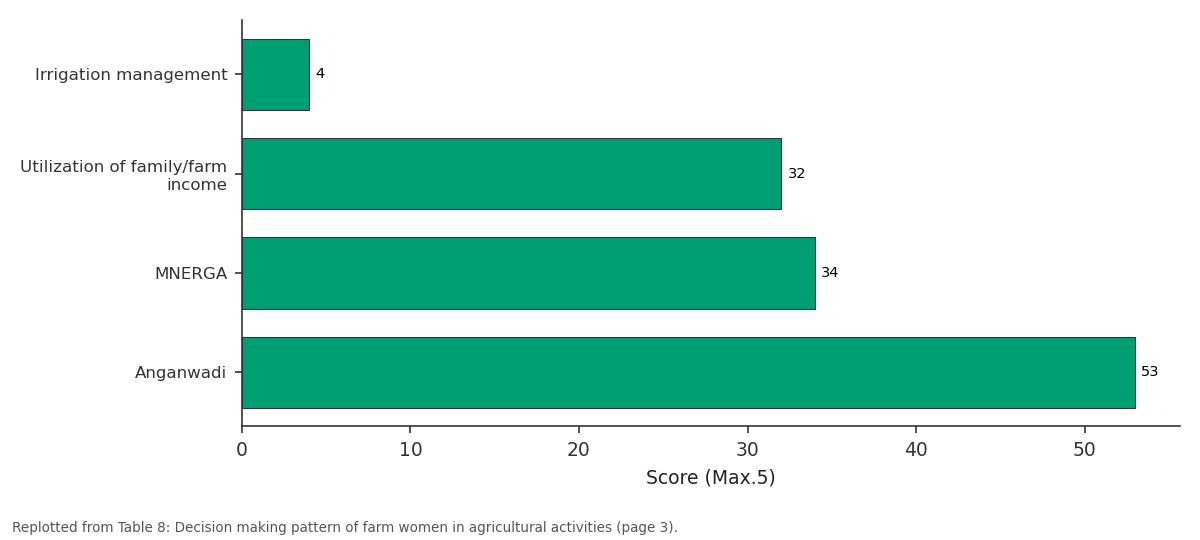
ID (5): Irrigation management vs Utilization of... vs MNERGA vs Anganwadi
Replotted from Table 8 (page 3) of the original paper. Every bar is the paper's own table value.
View source evidence ↗Figures & tables
From the original paper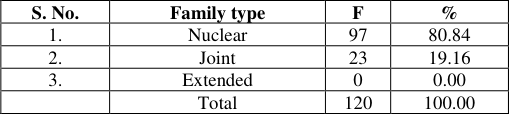 Table 3
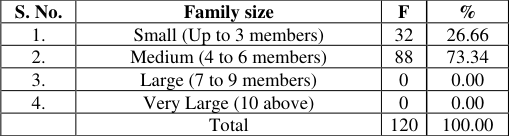 Table 4
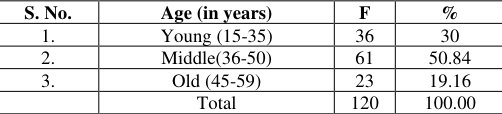 Table 1
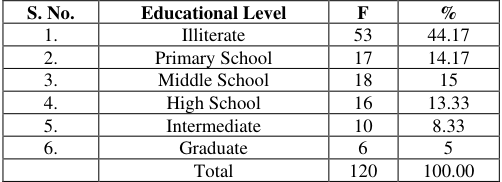 Table 2
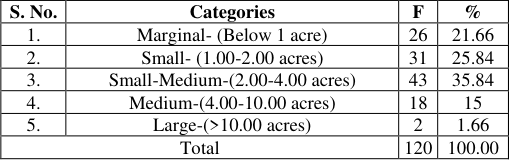 Table 5
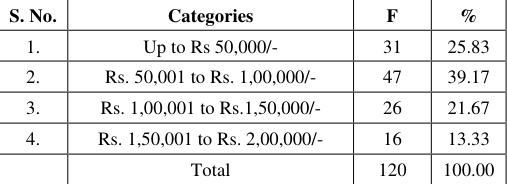 Table 6
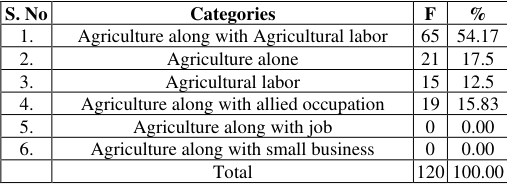 Table 7
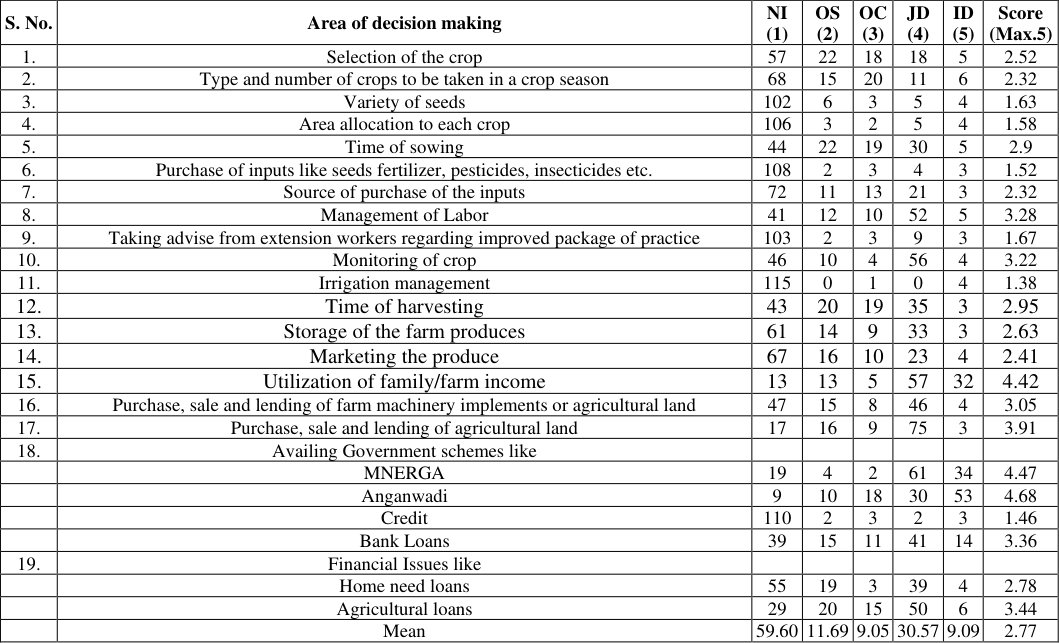 Table 8
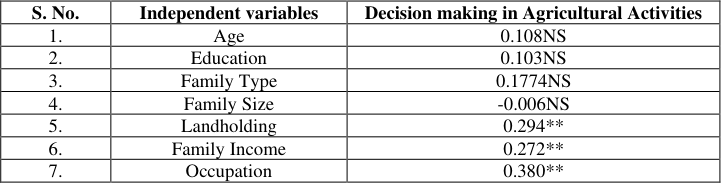 Table 9
Introduction
India is an agricultural country, with an economy that is preliminary agrarian in nature. India ranks second in the world with a population of 139 crores, 64.6 crores of which are females (Census of India, 2021) [3] . In rural India, agriculture and allied industrial sectors employ 89.5 percent of all female labor (Singotiya et al. 2014) [22] . Agriculture plays a vital role in Indian economy and contributes 17 percent to the total GDP (Meshram et al. 2019) [11] . Women make significant contributions to the agricultural and rural economies in all developing countries and contribute one-third of the labor required for farming oactivities. About 70 percent of agricultural work was carried out by women (Ahuja and Narayan, 2016) [1] . At present almost all rural development activities of the government are centered on male and female farmers. However, it is not only the male farmer alone who needs to be changed to attend to the growth and development of rural India but rural women also need to be involved in the developmental activities as they are the backbone of Indian agriculture. More than 60% of the rural population of Telangana is employed in agriculture and its allied activities and it is clear that, in Telangana, the agriculture sector is a major contributor to the GSDP as the Gross State value added (GSVA) of the agriculture and allied sector has seen a growth of 186% from its formation. Mulugu district has the highest share of rural population (96.10%). It also has the highest percentage of agricultural laborers (64.8%) (Telangana Socio Economic Outlook, 2023) [24] . The participation of rural women in co-operation with their husbands in decisions making not only affects family but farm business too. Women usually contribute to the harvesting of crops, weeding, threshing, irrigation, plant protection, use of bio-fertilizers, supervision and postharvest operations etc. Women work with male members and participate in agricultural activities putting much of hours of productive manual family labor, in rural families women always work much more than males.
Materials and Methods
The study was carried out in Mulugu district which was selected purposively from the Telangana State as it has the highest share of rural population (96.10%). It also has the highest share in agricultural labourers (64.8%). Mulugu www.extensionjournal.com district comprises of nine mandals out of which two Mangapet and Eturnagaram were selected. Under each mandal four villages were selected randomly by using simple randon sampling method, the selected villages in Mangapet Mandal were Kamalapuram, Komatipally, Gamponigudem, Narsimhasagar and the selected villages in Eturnagaram Mandal were Gogupally, Chennaboinapally, Shivapuram and Ramannagudem. From the selected eight villages, 15 women respondents from each village were selected purposively. The criterion for selection of rural farm women was their participating in participating in agricultural activities of major crops such as Rice, Cotton, maize, chilli etc. The total sample selected for the study was 120, thus comprising of 60 samples from four villages of Mangapet Mandal and 60 samples from four villages of Eturnagaram mandal of Mulugu district.
Results and Discussion Age
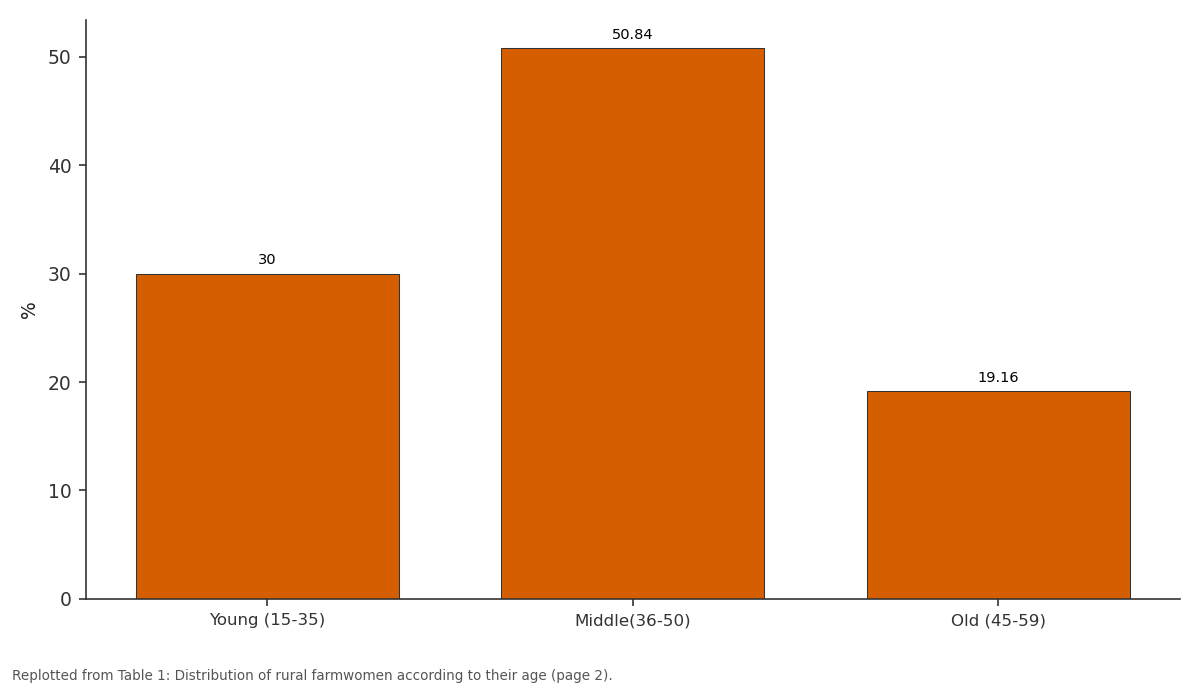
It can be seen from Table 1 that majority (50.84%) of the respondents belonged to middle age followed by young age (30.00%) and old age (19.16%). Majority of the respondents belonged to middle age may be due to the reason that old aged women were unable to perform the tedious agricultural activities due to their physical weakness. The findings are in accordance with the work of Singh (2017) [21] and Kiran et al. (2018) [8] , Waris et al. (2020) [27] , Sneha et al. (2022) [23] and Paradkar et al. (2022) [16] .
| S. No. | Age (in years) | F | % |
|---|---|---|---|
| 1. | Young (15-35) | 36 | 30 |
| 2. | Middle(36-50) | 61 | 50.84 |
| 3. | Old (45-59) | 23 | 19.16 |
| Total | 120 | 100.00 |
Table text extracted from the original PDF; superscript letters are shown inline. The original table image is below.
View original table image
Education
The data presented in table 2 indicated that nearly (44.17%) of the respondents were illiterates followed by primary school education (14.17%), middle school education (15%), high school education (13.33%) followed by intermediate education (8.33%) and graduation (5%). These findings are supported by the work of Verma and Singh (2019) [11] , Waris et al. (2020) [27] , Sneha et al. (2022) [23] .
| S. No. | Educational Level | F | % |
|---|---|---|---|
| 1. | Illiterate | 53 | 44.17 |
| 2. | Primary School | 17 | 14.17 |
| 3. | Middle School | 18 | 15 |
| 4. | High School | 16 | 13.33 |
| 5. | Intermediate | 10 | 8.33 |
| 6. | Graduate | 6 | 5 |
| Total | 120 | 100.00 |
Table text extracted from the original PDF; superscript letters are shown inline. The original table image is below.
View original table image
Family Type
From Table 3 we can see that majority (80.84%) of the respondents belonged to nuclear families followed by joint families (19.16%). This could be due to the reason that there is a cultural shift and the joint family system even in villages is on a decline as reflected from this study too.
| S. No. | Family type | F | % |
|---|---|---|---|
| 1. | Nuclear | 97 | 80.84 |
| 2. | Joint | 23 | 19.16 |
| 3. | Extended | 0 | 0.00 |
| Total | 120 | 100.00 |
Table text extracted from the original PDF; superscript letters are shown inline. The original table image is below.
View original table image
Similar results were quoted by Machhaliya (2014) [10] , Mohanta (2017) [13] , Kiran et al. (2018) [8] and Paradkar et al. (2022) [16] .
Family Size
It can be seen from table 4 that majority (73.34%) of the respondents had medium family size (4-6 members) followed by 26.66 percent of the respondents who had small families (Up to 3 members). This could be because most of the families desire to have medium-sized families in order to improve their quality of life and economic standards by adhering to small family norms. The findings were in support with the work of Landage (2011) [11] , Sneha et al.
| S. No. | Family size | F | % |
|---|---|---|---|
| 1. | Small (Up to 3 members) | 32 | 26.66 |
| 2. | Medium (4 to 6 members) | 88 | 73.34 |
| 3. | Large (7 to 9 members) | 0 | 0.00 |
| 4. | Very Large (10 above) | 0 | 0.00 |
| Total | 120 | 100.00 |
Table text extracted from the original PDF; superscript letters are shown inline. The original table image is below.
View original table image
(2022) [23] and Paradkar et al. (2022) [16] . Large (7 to 9 members) 0 0.00 4.
Very Large (10 above) 0 0.00 Total 120 100.00
Land Holding
The findings in Table 5 indicated that majority (35.84%) of the respondents had small-medium landholding (2.00-4.00 acres) followed by 25.84 percent having small land holding (1.00-2.00 acres), 21.66 percent of the respondents had marginal landholding (below 1 acre), 15.00 percent of the respondents had medium land holding (4.00-10.00 acres) and only 1.66 percent of the respondents had large land holding (>10 acres). This might be due to the fact that the division of inherited landholdings from generation to generation led to most of the large land holdings turning into small, small-medium and marginal. The results were consistent with that of Kaur et al. (2017) [8] .
| S. No. | Categories | F | % |
|---|---|---|---|
| 1. | Marginal- (Below 1 acre) | 26 | 21.66 |
| 2. | Small- (1.00-2.00 acres) | 31 | 25.84 |
| 3. | Small-Medium-(2.00-4.00 acres) | 43 | 35.84 |
| 4. | Medium-(4.00-10.00 acres) | 18 | 15 |
| 5. | Large-(>10.00 acres) | 2 | 1.66 |
| Total | 120 | 100.00 |
Table text extracted from the original PDF; superscript letters are shown inline. The original table image is below.
View original table image
Annual Income
The results in the Table 6 clearly indicated that majority (39.17%) of the respondents belonged to the income range of Rs. 50,001 to Rs. 1,00,000/-followed by (25.8%) belonged to the range of up to Rs. 50,000/-, (21.67%) of the respondents belonged to range of Rs. 1,00,001 to 1,50,000/www.extensionjournal.com and (13.33%) of the respondents belonged to a range of Rs. 1,50,001/-2,00,000/-.The main reason for majority of the respondents having an income range between Rs. 50,001 to Rs. 1,00,000 may be because agriculture was their major occupation along with agricultural labour and they are not earning high income from these occupations. The findings were in line with the findings of Jain (2007), Waris et al.
| S. No. | Categories | F | % |
|---|---|---|---|
| 1. | Up to Rs 50,000/- | 31 | 25.83 |
| 2. | Rs. 50,001 to Rs. 1,00,000/- | 47 | 39.17 |
| 3. | Rs. 1,00,001 to Rs.1,50,000/- | 26 | 21.67 |
| 4. | Rs. 1,50,001 to Rs. 2,00,000/- | 16 | 13.33 |
| Total | 120 | 100.00 |
Table text extracted from the original PDF; superscript letters are shown inline. The original table image is below.
View original table image
(2020) [27] , Prathibha et al. (2020) [18] . Occupation: It can be observed from Table 7 that for majority (54.17%) of the respondents agriculture along with agricultural labor was the primary occupation followed by agriculture alone (17.5%), agriculture along with allied occupation (15.83%), agricultural laborers (12.5%) and none of them belonged to agriculture with job and agriculture with small business categories. Similar findings were quoted by Machhaliya (2014) [10] , Mohanta (2017) [13] and Kiran et al. (2018) [8] , Paradkar et al. (2022) [16] .
| S. No | Categories | F | % |
|---|---|---|---|
| 1. | Agriculture along with Agricultural labor | 65 | 54.17 |
| 2. | Agriculture alone | 21 | 17.5 |
| 3. | Agricultural labor | 15 | 12.5 |
| 4. | Agriculture along with allied occupation | 19 | 15.83 |
| 5. | Agriculture along with job | 0 | 0.00 |
| 6. | Agriculture along with small business | 0 | 0.00 |
| Total | 120 | 100.00 |
Table text extracted from the original PDF; superscript letters are shown inline. The original table image is below.
View original table image
Table 7: Distribution of respondents according to their occupation
Agriculture along with Agricultural labor 65 54.17 2.
Agriculture alone 21 17.5 3.
Agricultural labor 15 12.5 4.
Agriculture along with allied occupation 19 15.83 5.
Agriculture along with job 0 0.00 6.
Agriculture along with small business 0 0.00 Total 120 100.00 With regard to decision making of farm women in agricultural activities, it can observed from findings in table 8 that decision score was highest in availing government schemes like Anganwadi and MNERGA (4.68 and 4.47), followed by utilization of farm income (4.42), purchase, sale and lending of agricultural land (3.91), agricultural loans (3.44), bank loans(3.36), management of labor (3.28), monitoring of crop (3.22), purchase, sale and lending of farm machinery implements or agricultural land (3.05), time of harvesting (2.95), time of sowing (2.9), home need loans (2.78), storage of farm produce (2.63), selection of crop (2.52),marketing the produce. (2.41), type and number of crops to be taken in a crop season (2.32),contact with extension workers regarding improved package of practice (1.67), variety of seeds (1.63), area allocation to each crop (1.58), purchase of inputs seeds, fertilizers, pesticides, insecticides etc, credit loans (1.46) and Irrigation management (1.38). Though farm women perform many crucial activities in farm activities their participation in decision making with respect to type and number of crops to be grown, choice of crop variety and purchase of inputs is not very encouraging, www.extensionjournal.com With the increasing feminization of agriculture it is very important to involve farm women in each of the decisions with respect to agricultural operations. There is an urgent need to create awareness and organize training programs for farm women to be assertive to be involved fully in the decision making for both farm and home activities. Godara et al. (2014) [5] revealed that women's participation in different aspects of decision-making process of agricultural sector have not recorded up to the mark. The decisions related to opting the measures to increase the production, buying activities, expenditure activities were found to be minimum. The relationship between the socio-economic characteristics (table 9) indicate that that the variables like land holding, family income, occupation exhibited positive and significant relationship with the decision making of respondents in agricultural activities. Whereas, variables like age, education family type and family size did not show any relationship with the decision making of farm women in agricultural activities. It may be due to the reason that age alone may not reflect the range of experience and majority of the farm women were illiterates in this study. Even if the farm women were educated their decision was not given importance due to dominance by males. Hence, there is a need for empowerment of farm women through extension education activities for effective and efficient decision making in agricultural activities.
| S. No. | Independent variables | Decision making in Agricultural Activities |
|---|---|---|
| 1. | Age | 0.108NS |
| 2. | Education | 0.103NS |
| 3. | Family Type | 0.1774NS |
| 4. | Family Size | -0.006NS |
| 5. | Landholding | 0.294** |
| 6. | Family Income | 0.272** |
| 7. | Occupation | 0.380** |
Table text extracted from the original PDF; superscript letters are shown inline. The original table image is below.
View original table image
| S. No. | Area of decision making | NI (1) | OS (2) | OC (3) | JD (4) | ID (5) | Score (Max.5) |
|---|---|---|---|---|---|---|---|
| 1. | Selection of the crop | 57 | 22 | 18 | 18 | 5 | 2.52 |
| 2. | Type and number of crops to be taken in a crop season | 68 | 15 | 20 | 11 | 6 | 2.32 |
| 3. | Variety of seeds | 102 | 6 | 3 | 5 | 4 | 1.63 |
| 4. | Area allocation to each crop | 106 | 3 | 2 | 5 | 4 | 1.58 |
| 5. | Time of sowing | 44 | 22 | 19 | 30 | 5 | 2.9 |
| 6. | Purchase of inputs like seeds fertilizer, pesticides, insecticides etc. | 108 | 2 | 3 | 4 | 3 | 1.52 |
| 7. | Source of purchase of the inputs | 72 | 11 | 13 | 21 | 3 | 2.32 |
| 8. | Management of Labor | 41 | 12 | 10 | 52 | 5 | 3.28 |
| 9. | Taking advise from extension workers regarding improved package of practice | 103 | 2 | 3 | 9 | 3 | 1.67 |
| 10. | Monitoring of crop | 46 | 10 | 4 | 56 | 4 | 3.22 |
| 11. | Irrigation management | 115 | 0 | 1 | 0 | 4 | 1.38 |
| 12. | Time of harvesting | 43 | 20 | 19 | 35 | 3 | 2.95 |
| 13. | Storage of the farm produces | 61 | 14 | 9 | 33 | 3 | 2.63 |
| 14. | Marketing the produce | 67 | 16 | 10 | 23 | 4 | 2.41 |
| 15. | Utilization of family/farm income | 13 | 13 | 5 | 57 | 32 | 4.42 |
| 16. | Purchase, sale and lending of farm machinery implements or agricultural land | 47 | 15 | 8 | 46 | 4 | 3.05 |
| 17. | Purchase, sale and lending of agricultural land | 17 | 16 | 9 | 75 | 3 | 3.91 |
| 18. | Availing Government schemes like | ||||||
| MNERGA | 19 | 4 | 2 | 61 | 34 | 4.47 | |
| Anganwadi | 9 | 10 | 18 | 30 | 53 | 4.68 | |
| Credit | 110 | 2 | 3 | 2 | 3 | 1.46 | |
| Bank Loans | 39 | 15 | 11 | 41 | 14 | 3.36 | |
| 19. | Financial Issues like | ||||||
| Home need loans | 55 | 19 | 3 | 39 | 4 | 2.78 | |
| Agricultural loans | 29 | 20 | 15 | 50 | 6 | 3.44 | |
| Mean | 59.60 | 11.69 | 9.05 | 30.57 | 9.09 | 2.77 |
Table text extracted from the original PDF; superscript letters are shown inline. The original table image is below.
View original table image
Co-relation between the socio-economic profile of rural farm women in Decision making towards agricultural activities
Co-relation between the socio-economic profile of rural farm women in Decision making towards agricultural activities
Conclusion
It is concluded from the study that majority of the farm women had low involvement in decision making in agricultural activities like variety of seeds, area allocation to each crop, purchase of inputs like (seeds, fertilizers, insecticides, pesticides), taking advice from extension workers regarding improved package of practice, irrigation management and credit loans. It is revealed from the study that some of the farm women decisions were considered after consultation with the male members of the family in case of purchase, sale and lending of agricultural land, availing schemes like MNERGA, utilization of farm income, monitoring of crop and a very less number of farm women were involved in decisions independently on availing Anganwadi scheme. It is shown from the study that the illiterates were high and that is the reason farm women are not able to take decisions independently in agricultural activities. It is also shown from the study that landholding, family income and occupation had positive significant on decision making. This study would be valuable for future agricultural practice and would serve as a reference for gender-based agricultural policy work. Future research can be conducted with more numbers of independent variables in a broader perspective.
References
13 in the original paper- Ahuja U, Narayan P. Participation of Farm Women in Decision Making A Case Study of Sonipat District of Haryana, India. International Journal of Current Research. 2016;8(3):28766-28771.
- Census 2021. Ministry of Home Affairs. Government of India. Retrieved from https://en.wikipedia.org/wiki/2021_census_of_India#:~:t ext=It%20was%20delayed%20to%202022,take%20plac e%20in%20late%202024.
- Chayal K, Dhaka BL, Poonia MK, Tyagi SVS, Verma SR. Involvement of farm women in decision-making in agriculture. Stud Home Com Sci. 2013;7(1):35-37.
- Godara, A.S., UshaPoonia and Jyani, U. 2014. Role of Women in Decision-Making process in Agriculture Sector: A Case Study of District Fatehabad. International Journal of Scientific and Research Publications. 4(2):1-9.
- Kaur, A and Kataria, P. Dynamics of Agricultural Land Holdings and Production Performance: An Inter-State Analysis. Indian Journal of Economics and Development. 2017; 13(2):257.
- Kiran C. Socio economic profile of farm women and its relationship to words involvement in Agricultural Practices in Chhotaudepur District of Gujrat State. Journal of Krishivigyan. 2018;7:139-143.
- Meshram M, Khare NK, Singh SRK. Assessing Integrated Farming System Models Apropos Employment Generation Potential in Madhya Pradesh. Indian Journal of Extension Education. 2019;55(3):65-68.
- Meshram M, Khare NK, Singh SRK. Socio-economic profile of integrated farming system practicing farmers in Madhya Pradesh state, The Pharma Innovation Journal. 2020;SP-9(4):155-159.
- Mohanta R. Participation of tribal women in Agriculture. International Journal of Science Environment and Technology. 2017;6(1):745-750.
- Paradkar S, Narberia S, Lairenjam G, Meshram MV. Socio-economic profile of tribal farm women in decision making towards agricultural operations in Madhya Pradesh. The Pharma Innovation Journal. 2022; SP-11(9): 2375-2377.
- Pal S, Haldar S. Participation and role of rural women in decision making related to farm activities: A in study Burdwan district of West Bengal, Economic Affairs. 2016;61(1):55-63.
- Singotiya P, Khare NK, Agrawal S. Role of tribal farm women in decision making towards agricultural operations, Adv. Res. J Soc. Sci. 2014;5(2):242-244.
- Sneha K, Kachroo J, Bali D, Bhat A. Socio-economic Status of Farm Women and Constraints Encountered by Them in Agriculture and Allied Systems in Jammu District. Agro Economist -An International Journal. 2022;9(04):337-343.