
Research article · 2024 · Full text
International Journal of Agriculture Extension and Social DevelopmentKnowledge of improved wheat production practices by farmers in Prayagraj district of Uttar Pradesh
Volume 7(7S) · Pages 170–173 · DOI: 10.33545/26180723.2024.v7.i7sc.821 ↗
Research areasAgricultural Economics and PracticesLivestock Management and Performance ImprovementAgricultural Systems and Practices
Abstract
Author-writtenThe present investigation was conducted in Jasra block of Prayagraj district, Uttar Pradesh. One hundred twenty respondents were selected through multistage sampling from 20 villages jasra block of prayagraj district. The primary data were gathered by the researcher itself through pre-structured interview schedule. Appropriate statistical tools were used to interpret the collected data to draw logical conclusion. The finding that majority of respondents were having medium level of knowledge of improved wheat Production Practices. Age, Education, Land Holding, Mass Media Exposure, Extension Contacts and Economic Motivation were observed positive and significant correlation with their knowledge level.
Summary
Source-checkedPlain-language reading of the full paper, prepared with AI and checked against the text. Each point links to the authors' own words.
Why it matters
- India is a globally significant producer and consumer of wheat. View evidence ↗
- While Uttar Pradesh contributes the most to India's national wheat production, its productivity is relatively low at 2.7 tonnes/ha. View evidence ↗
The question
- The study aimed to assess the socio-economic status of farmers and their knowledge of improved wheat production practices in the Prayagraj district of Uttar Pradesh. View evidence ↗
What they did
- Primary data were collected directly by the researcher using a pre-structured interview schedule. View evidence ↗
- The study employed a descriptive research design, utilizing modified scales and procedures from previous research to measure variables. View evidence ↗
What they found
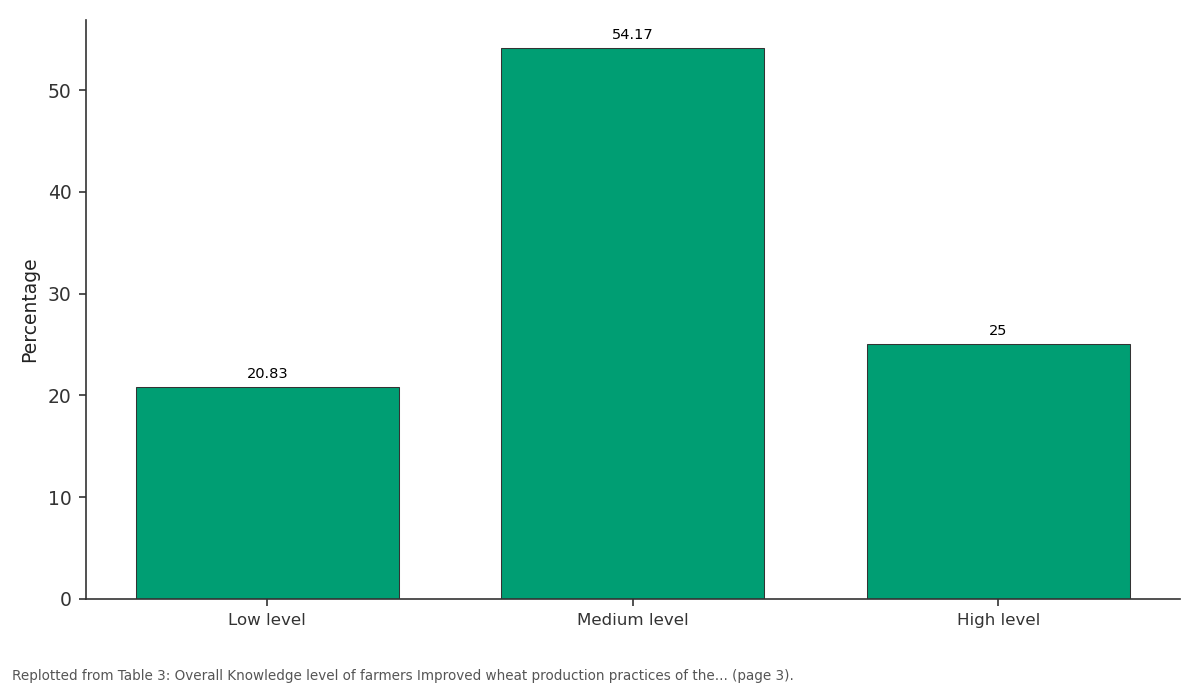
- The majority of farmers (54.17%) possessed a medium level of knowledge regarding improved wheat production, while 25.00% had high knowledge and 20.83% had low knowledge. View evidence ↗
- Approximately 55.00% of the respondents were categorized as having a medium level of education, meaning they were literate up to the intermediate level. View evidence ↗
- A majority of the respondents (55.83%) were in the high-income category, earning above 80,000. View evidence ↗
- Age, education, landholding size, mass media exposure, extension contacts, and economic motivation were all positively and significantly correlated with the farmers' knowledge of improved wheat production. View evidence ↗
- Annual income showed a negative and non-significant correlation with the farmers' knowledge of improved wheat production practices. View evidence ↗
What it means
- The authors recommend that agricultural scientists provide training on seed treatment and that universities or state departments ensure the timely availability of chemicals and cultures. View evidence ↗
- The authors suggest using regular mass media support, such as technical articles in newspapers and magazines, to keep farmers updated on the latest wheat production practices. View evidence ↗
Visual summary
2 visualsIllustrations explain the paper; charts are replotted from the paper's own table values.
Percentage: Low level vs Medium level vs High level
Replotted from Table 3 (page 3) of the original paper. Every bar is the paper's own table value.
View source evidence ↗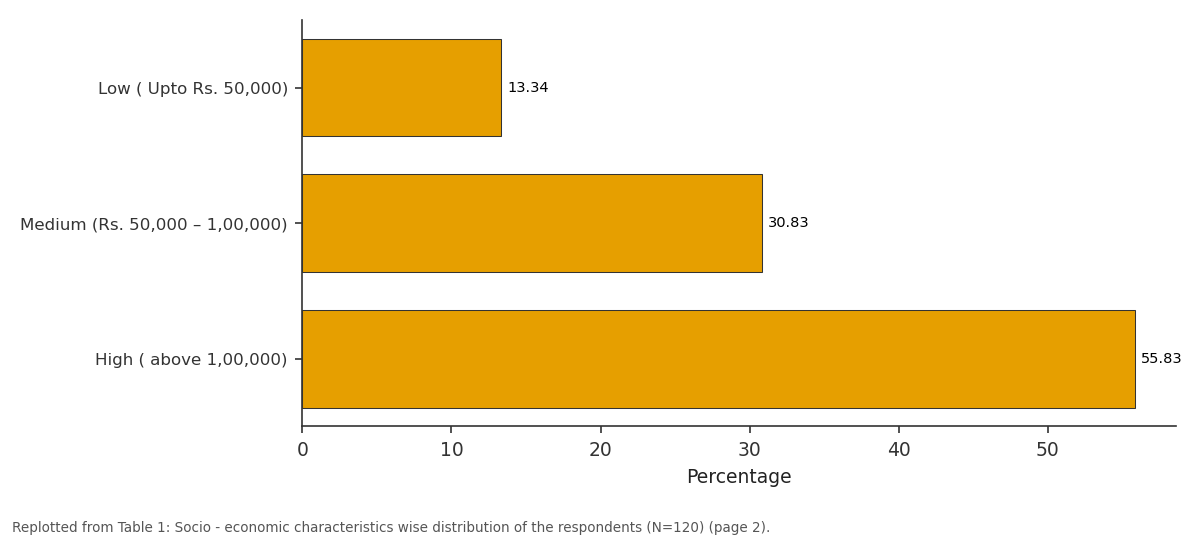
Percentage: Low ( Upto Rs. 50,000) vs Medium (Rs. 50,000 –... vs High ( above 1,00,000)
Replotted from Table 1 (page 2) of the original paper. Every bar is the paper's own table value.
View source evidence ↗Figures & tables
From the original paper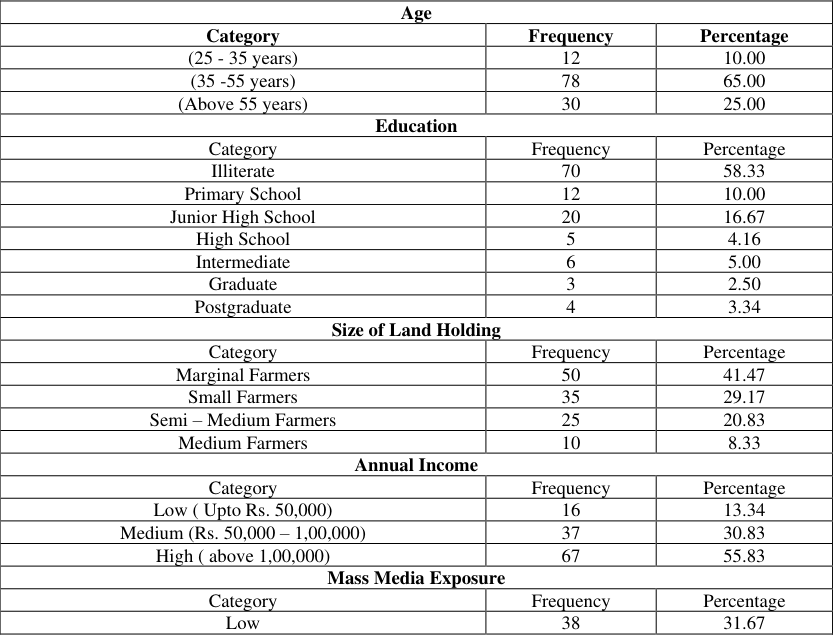 Table 1
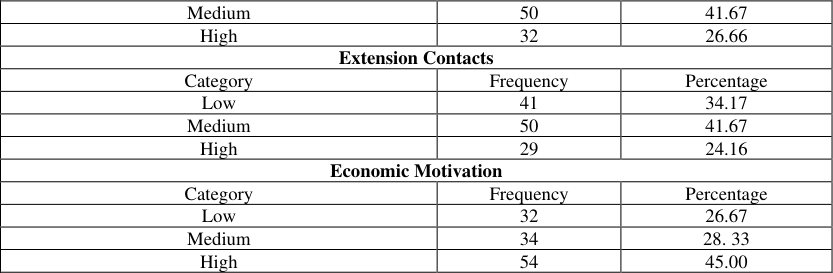 Table 2
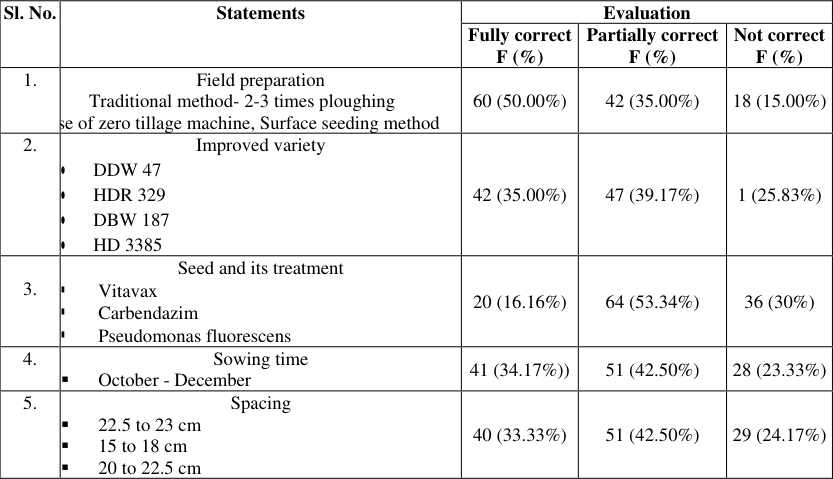 Table 2
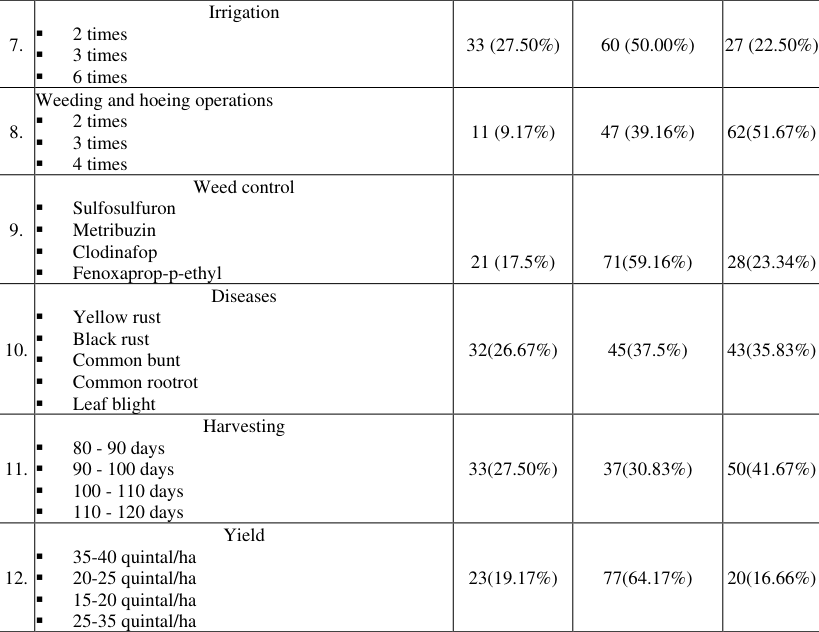 Table 3
 Table 3
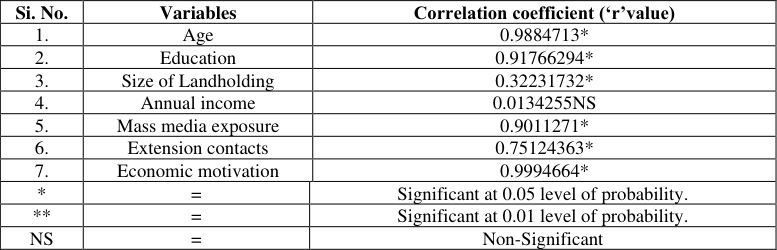 Table 4
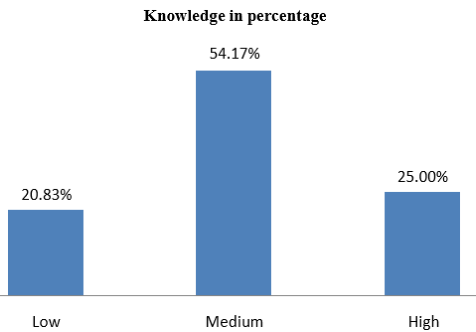 Figure 1
Results And Discussion
Socio - economic characteristics of the respondents The socio-economic characteristics of the respondents were studied and the data are given below. Table-1. Shows that majority (65.00%) of respondents belongs to middle level of age group. It was observed that (55.00%) of the respondents belongs to medium level (literate up to intermediate) category.
It was found that (45.00%) of the respondents belongs to high level land holding (>2 ha), similarly it was observed that (55.83%) of the respondents belongs to high level of income i.e. above 80,000). It was found that (41.67%) of the respondents belongs to medium level of mass media exposure category, (41.67%) of the respondents belongs to medium level extension contacts category, (45.00%) of the respondents belongs to medium level economic motivation category. Similar result is also reported by Kumar and Bose (2013) [3].
Introduction
India is one of the important wheat producing and consuming countries in the world. The important wheat growing states are Punjab, Haryana, Uttar Pradesh, Bihar, Madhya Pradesh, Rajasthan and Gujarat in India. Wheat is the most extensively grown cereal crop in the world, covering about 237 million hectares annually, and accounting for a total of 420 million tones. Wheat (Triticum aestivum) the world’s largest cereal crop belongs to Graminae (Poaceae) family of the genus Triticum.
It has been described as the “King of cereals” because of the acreage it occupies, high productivity andthe prominent position in the international food grain trade. Wheat is consumed in a variety of ways such as bread, chapatti, porridge, flour, suji etc. For Wheat production target has been fixed in India for 2020 is 105.19 million tones against 100 million tones last year. Uttar Pradesh is the largest state with maximum contribution towards national production, but with productivity on a lower side of 2.7 tonnes/ha.
The present study was conducted to access the socio-economic status of the respondents and to find out the knowledge of farmers improved wheat production practices by farmers in Prayagraj district of Uttar Pradesh.
Materials And Methods
The present study was purposively undertaken in jasra block of prayagraj district in Uttar Pradesh. Twenty villages were purposively selected on the basis of majority of farmers practicing wheat cultivation. 170 https://www.extensionjournal.com Table 1: Socio - economic characteristics wise distribution of the respondents (N=120) Age Category Frequency Percentage (25 - 35 years) 12 10.00 (35 -55 years) 78 65.00 (Above 55 years) 30 25.00 Education Category Frequency Percentage Illiterate 70 58.33 Primary School 12 10.00 Junior High School 20 16.67 High School 5 4.16 Intermediate 6 5.00 Graduate 3 2.50 Postgraduate 4 3.34 Size of Land Holding Category Frequency Percentage Marginal Farmers 50 41.47 Small Farmers 35 29.17 Semi – Medium Farmers 25 20.83 Medium Farmers 10 8.33 Annual Income Category Frequency Percentage Low ( Upto Rs. 50,000) 16 13.34 Medium (Rs. 50,000 – 1,00,000) 37 30.83 High ( above 1,00,000) 67 55.83 Mass Media Exposure Category Frequency Percentage Low 38 31.67 Medium 50 41.67 High 32 26.66 Extension Contacts Category Frequency Percentage Low 41 34.17 Medium 50 41.67 High 29 24.16 Economic Motivation Category Frequency Percentage Low 32 26.67 Medium 34 28. 33 High 54 45.00 Table 2: Knowledge level of farmers Improved wheat production practices Sl. No. Statements Evaluation Fully correct Partially correct Not correct F (%) F (%) 60 (50.00%) 42 (35.00%) 18 (15.00%) F (%) 1.
| Medium | 50 | 41.67 |
|---|---|---|
| High | 32 | 26.66 |
| Extension Contacts | ||
| Category | Frequency | Percentage |
| Low | 41 | 34.17 |
| Medium | 50 | 41.67 |
| High | 29 | 24.16 |
| Economic Motivation | ||
| Category | Frequency | Percentage |
| Low | 32 | 26.67 |
| Medium | 34 | 28. 33 |
| High | 54 | 45.00 |
Table text extracted from the original PDF; superscript letters are shown inline. The original table image is below.
View original table image
| Age | — | — |
|---|---|---|
| Category | Frequency | Percentage |
| (25 - 35 years) | 12 | 10.00 |
| (35 -55 years) | 78 | 65.00 |
| (Above 55 years) | 30 | 25.00 |
| Education | ||
| Category | Frequency | Percentage |
| Illiterate | 70 | 58.33 |
| Primary School | 12 | 10.00 |
| Junior High School | 20 | 16.67 |
| High School | 5 | 4.16 |
| Intermediate | 6 | 5.00 |
| Graduate | 3 | 2.50 |
| Postgraduate | 4 | 3.34 |
| Size of Land Holding | ||
| Category | Frequency | Percentage |
| Marginal Farmers | 50 | 41.47 |
| Small Farmers | 35 | 29.17 |
| Semi – Medium Farmers | 25 | 20.83 |
| Medium Farmers | 10 | 8.33 |
| Annual Income | ||
| Category | Frequency | Percentage |
| Low ( Upto Rs. 50,000) | 16 | 13.34 |
| Medium (Rs. 50,000 – 1,00,000) | 37 | 30.83 |
| High ( above 1,00,000) | 67 | 55.83 |
| Mass Media Exposure | ||
| Category | Frequency | Percentage |
| Low | 38 | 31.67 |
Table text extracted from the original PDF; superscript letters are shown inline. The original table image is below.
View original table image
Field preparation Traditional method- 2-3 times ploughing se of zero tillage machine, Surface seeding method 2. Improved variety • DDW 47 42 (35.00%) 47 (39.17%) 1 (25.83%) • HDR 329 • DBW 187 • HD 3385 Seed and its treatment 3. ▪ Vitavax 20 (16.16%) 64 (53.34%) 36 (30%) ▪ Carbendazim ▪ Pseudomonas fluorescens 4. Sowing time ▪ October - December 41 (34.17%)) 51 (42.50%) 28 (23.33%) 40 (33.33%) 51 (42.50%) 29 (24.17%) 5. Spacing ▪ 22.5 to 23 cm ▪ 15 to 18 cm ▪ 20 to 22.5 cm 171 https://www.extensionjournal.com 24 (20.00%) 74 (61.66%) 22 (18.34%) 6.
Fertilizers ▪ 120:60:40 KgNPK/ha ▪ 90:60:40 kgNPK/ha 7. 33 (27.50%) 60 (50.00%) 27 (22.50%) Irrigation ▪ 2 times ▪ 3 times ▪ 6 times 8. 11 (9.17%) 47 (39.16%) 62(51.67%) Weeding and hoeing operations ▪ 2 times ▪ 3 times ▪ 4 times 9. 21 (17.5%) 71(59.16%) 28(23.34%) Weed control ▪ Sulfosulfuron ▪ Metribuzin ▪ Clodinafop ▪ Fenoxaprop-p-ethyl 10. 32(26.67%) 45(37.5%) 43(35.83%) Diseases ▪ Yellow rust ▪ Black rust ▪ Common bunt ▪ Common rootrot ▪ Leaf blight 11. 33(27.50%) 37(30.83%) 50(41.67%) Harvesting ▪ 80 - 90 days ▪ 90 - 100 days ▪ 100 - 110 days ▪ 110 - 120 days 12. 23(19.17%) 77(64.17%) 20(16.66%) Yield ▪ 35-40 quintal/ha ▪ 20-25 quintal/ha ▪ 15-20 quintal/ha ▪ 25-35 quintal/ha Table 3: Overall Knowledge level of farmers Improved wheat production practices of the respondents. (N=120) Knowledge Level Category Knowledge Score Frequency Percentage Low level (13-20) 25 20.83 Medium level (21-27) 65 54.17 High level (28-34) 30 25.00 Total 120 100.00 Table 4: Relationship between the selected independent variables with knowledge of farmers Improved wheat production practices. (N=120). six variables are i.e. age, education, size of landholding, mass media exposure, extension contacts, economic motivation positively and significantly correlated with knowledge of farmers improved wheat production practices whereas the independent variable annual income of the respondents was availed negatively and non- significantly correlated with knowledge of farmers improved wheat production practices. Si. No. Variables Correlation coefficient (‘r’value) 1.
| Si. No. | Variables | Correlation coefficient (‘r’value) |
|---|---|---|
| 1. | Age | 0.9884713* |
| 2. | Education | 0.91766294* |
| 3. | Size of Landholding | 0.32231732* |
| 4. | Annual income | 0.0134255NS |
| 5. | Mass media exposure | 0.9011271* |
| 6. | Extension contacts | 0.75124363* |
| 7. | Economic motivation | 0.9994664* |
| * | = | Significant at 0.05 level of probability. |
| ** | = | Significant at 0.01 level of probability. |
| NS | = | Non-Significant |
Table text extracted from the original PDF; superscript letters are shown inline. The original table image is below.
View original table image
| Knowledge Level | — | — | — |
|---|---|---|---|
| Category | Knowledge Score | Frequency | Percentage |
| Low level | (13-20) | 25 | 20.83 |
| Medium level | (21-27) | 65 | 54.17 |
| High level | (28-34) | 30 | 25.00 |
| Total | 120 | 100.00 |
Table text extracted from the original PDF; superscript letters are shown inline. The original table image is below.
View original table image
| 7. | Irrigation ▪ 2 times ▪ 3 times ▪ 6 times | 33 (27.50%) | 60 (50.00%) | 27 (22.50%) |
|---|---|---|---|---|
| 8. | Weeding and hoeing operations ▪ 2 times ▪ 3 times ▪ 4 times | 11 (9.17%) | 47 (39.16%) | 62(51.67%) |
| 9. | Weed control ▪ Sulfosulfuron ▪ Metribuzin ▪ Clodinafop ▪ Fenoxaprop-p-ethyl | 21 (17.5%) | 71(59.16%) | 28(23.34%) |
| 10. | Diseases ▪ Yellow rust ▪ Black rust ▪ Common bunt ▪ Common rootrot ▪ Leaf blight | 32(26.67%) | 45(37.5%) | 43(35.83%) |
| 11. | Harvesting ▪ 80 - 90 days ▪ 90 - 100 days ▪ 100 - 110 days ▪ 110 - 120 days | 33(27.50%) | 37(30.83%) | 50(41.67%) |
| 12. | Yield ▪ 35-40 quintal/ha ▪ 20-25 quintal/ha ▪ 15-20 quintal/ha ▪ 25-35 quintal/ha | 23(19.17%) | 77(64.17%) | 20(16.66%) |
Table text extracted from the original PDF; superscript letters are shown inline. The original table image is below.
View original table image
Age 0.9884713* 2. Education 0.91766294* 3. Size of Landholding 0.32231732* 4. Annual income 0.0134255NS 5.
Mass media exposure 0.9011271* 6. Extension contacts 0.75124363* 7. Economic motivation 0.9994664* * = Significant at 0.05 level of probability. ** = Significant at 0.01 level of probability. NS = Non-Significant Table-3 reveals that majority of the respondents (54.17%) fell in the medium knowledge level group, whereas (25.00%) per cent respondents were observed in the high knowledge level group and remaining (20.83%) percent respondents formed low knowledge level group.
It is concluded that majority of farmers were having medium knowledge level followed by high and low knowledge level respectively. Table 4 Indicated that out of seven independent variables, 172 https://www.extensionjournal.com Fig 1: Table3 Knowledge in percentage of respondents
Conclusion
It was concluded that the socio-economic profile of the sample group were medium level. It was evident that the knowledge of farmers improved wheat production practices were found medium level. The factors influencing in knowledge of farmers improved wheat production practices are age, education, size of land holdings, mass media exposure, extension contacts, and economic motivation. Farmers should be trained by the Agriculture Scientists for seed treatment and timely availability of chemical specially culture should be ensured either by the Agriculture University or State Department of Agriculture.
A regular mass media support at the appropriate technical articles in the newspaper, magazines etc. should be ensured for equipping the farmers with latest wheat production practices.
References
6 in the original paper- Singh A, Kumar S, Tiwari KG, Lama D, Bauble. A statistical study of trends of wheat production in districts of Eastern Uttar Pradesh. International Journal of Current Microbiology and Applied Sciences. 2020;9(4):158-166.
- Bose DK, Maurya OP, Rai AK. Adoption behavior of farmers about recommended wheat production practices in Prayagraj district of Uttar Pradesh. International Journal of Innovation Science and Research Technology. 2019;4(9):2456-2165.
- Kumar J, Bose DK. Adoption behaviour of pigeonpea growers in Allahabad district of Uttar Pradesh. Journal of Extension Education. Indian Agricultural Research Institute, New Delhi. 2013;49:110-111.
- Ram R. Response of wheat (Triticum aestivum) genotypes to different tillage practices for improving productivity and seed quality in eastern Indo-Gangetic plains of India. Indian Journal of Agricultural Sciences. 2017;87(10):1324-1328.
- Reddy SDN. A study on influencing factors and constraints in drip irrigation by horticulture farmers of Bijapur district of Karnataka [M.Sc. thesis]. Dharwad: University of Agricultural Sciences; c2007.
- Singh P, Naruka, Singh S. A study on knowledge level of soybean growers about improved soybean production technology. Maharashtra Journal of Extension Education. 2003;22:1-4. 173