
Research article · 2024 · Full text
International Journal of Research in AgronomyEffect of planting geometries and integrated nutrient management practices on growth, yield, quality and economics of sugarcane (Saccharum officinarum) of Konkan region
Volume 7(7) · Pages 575–579 · DOI: 10.33545/2618060x.2024.v7.i7g.1095 ↗
Research areasSugarcane Cultivation and Processing
Abstract
Author-writtenThe research experiment was conducted during 2018 (plant cane) and 2019 (ratoon cane) at Instructional Farm, Department of Agronomy, College of Agriculture, Dapoli, Dist. Ratnagiri (M. S.) to investigate the, effect of various integrated nutrient management practices and planting geometries on growth, yield, quality and economics of sugarcane (Saccharum officinarum) in lateritic soil of Konkan region. The field experiment was laid out in strip plot design with two factors consisted of six planting geometries viz., 75 cm SRP, 90 cm SRP, 60 - 90 cm PRP, 60 - 120 cm PRP, 60 - 150 cm PRP , 75 - 150 cm PRP and five integrated nutrient management treatments, viz., 100% RDF inorganic, 75% RDF N inorganic + 25% N organics, 50% RDF N inorganic + 50% N organics, 25% RDF N inorganic + 75% N organics and 100% N organics. Among the various planting geometries, planting of cane at 60-120 cm paired row recorded significantly higher number of millable cane, tillering ratio, dry matter accumulation, number of tillers, height of plant, number of internodes along with single cane weight, cane yield, commercial cane sugar yield, net profit and B:C ratio as compared to that of other planting geometries followed by 60-150 cm and 75-150 cm. Similarly, application of 75% RDF N inorganic + 25% N organics also recorded significantly superior all the growth parameters along with single cane weight, cane yield, commercial cane sugar yield, net income and B.C. ratio as compared to that of other nutrient management combinations except 100% RDF inorganic, where both these treatments were found par with each other.
Summary
Source-checkedPlain-language reading of the full paper, prepared with AI and checked against the text. Each point links to the authors' own words.
Why it matters
- Sugarcane is a critical industrial energy crop that holds a central position in India's agricultural economy. View evidence ↗
- The dense canopy of perennial sugarcane can restrict aeration and solar radiation, leading to resource competition. View evidence ↗
- Intensive cultivation has led to a decline in national sugarcane productivity due to soil health deterioration and nutrient loss. View evidence ↗
The question
- The study aimed to investigate how different planting geometries and integrated nutrient management practices affect the growth, yield, quality, and economics of sugarcane in the lateritic soil of the Konkan region. View evidence ↗
What they did
- The experiment took place at the Instructional Farm in Dapoli, Maharashtra, during 2018 for plant cane and 2019 for ratoon cane. View evidence ↗
- The study used a strip plot design testing six planting geometries (including single row and paired row patterns) and five integrated nutrient management treatments varying the ratio of inorganic to organic nitrogen. View evidence ↗
- Organic nutrient sources were composed of 40% farmyard manure (FYM), 40% poultry manure, and 20% vermicompost. View evidence ↗
What they found
- The 60-120 cm paired row planting geometry significantly outperformed other geometries in growth parameters, yield, commercial sugar yield, net profit, and the benefit-cost (B:C) ratio. View evidence ↗
- The percentage of sucrose in the sugarcane juice was not significantly affected by the different planting geometries used. View evidence ↗
- A nutrient mix of 75% inorganic and 25% organic nitrogen was significantly superior to most other combinations for growth and yield, performing similarly to 100% inorganic fertilizer. View evidence ↗
- Increasing the proportion of organic nitrogen in place of inorganic nitrogen led to a steady decline in growth and yield, with 100% organic nitrogen producing the lowest results. View evidence ↗
What it means
- Although 100% chemical fertilizer is economical, the authors recommend the 75% inorganic and 25% organic mix for long-term sustainability. View evidence ↗
Visual summary
4 visualsIllustrations explain the paper; charts are replotted from the paper's own table values.
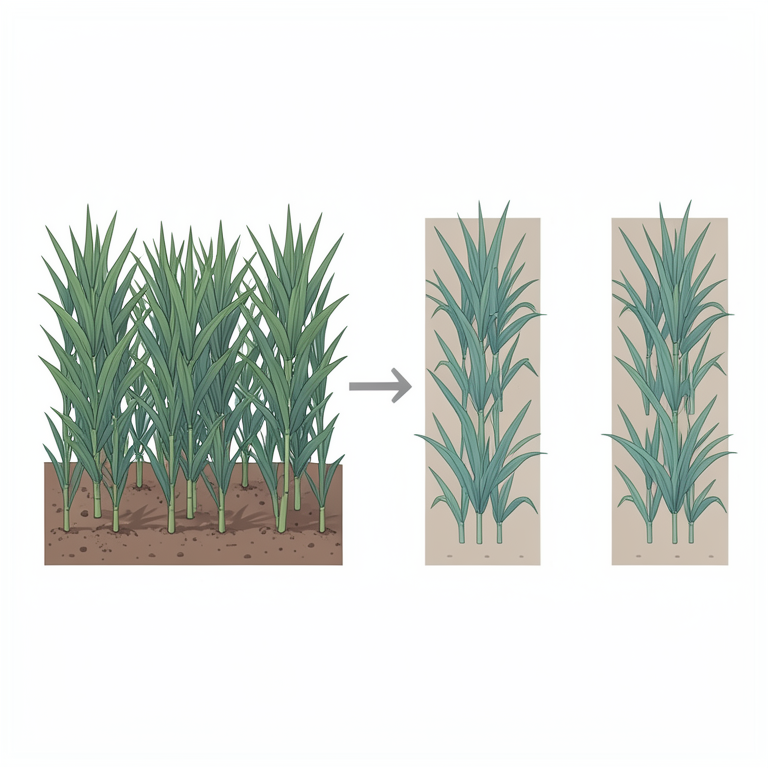
Planting Geometry Comparison
AI-generated conceptual illustration (sugarcane (Saccharum officinarum) plants). It explains the idea and does not show study data.
View source evidence ↗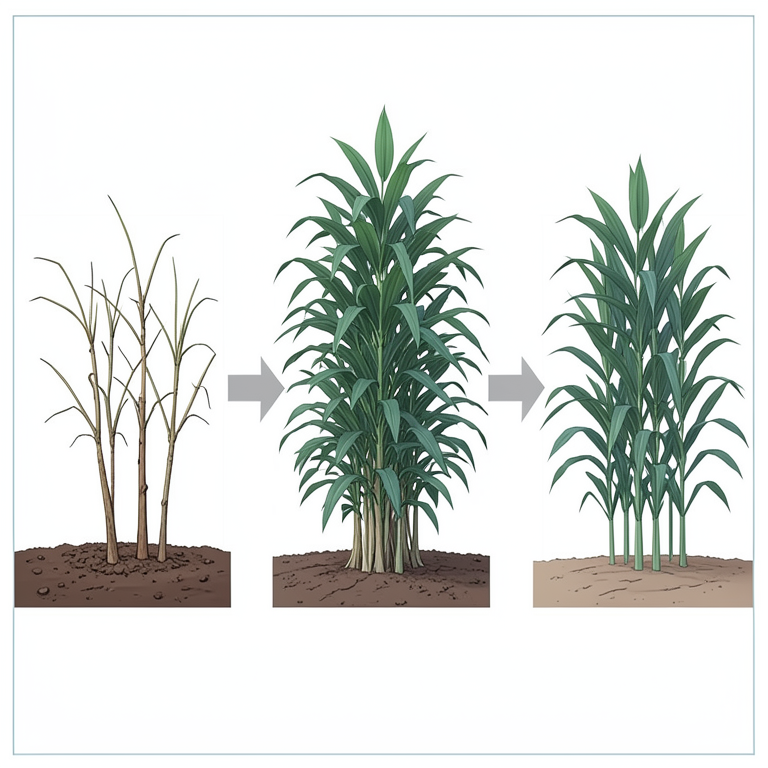
Nutrient Management Impact
AI-generated conceptual illustration (sugarcane (Saccharum officinarum) plants). It explains the idea and does not show study data.
View source evidence ↗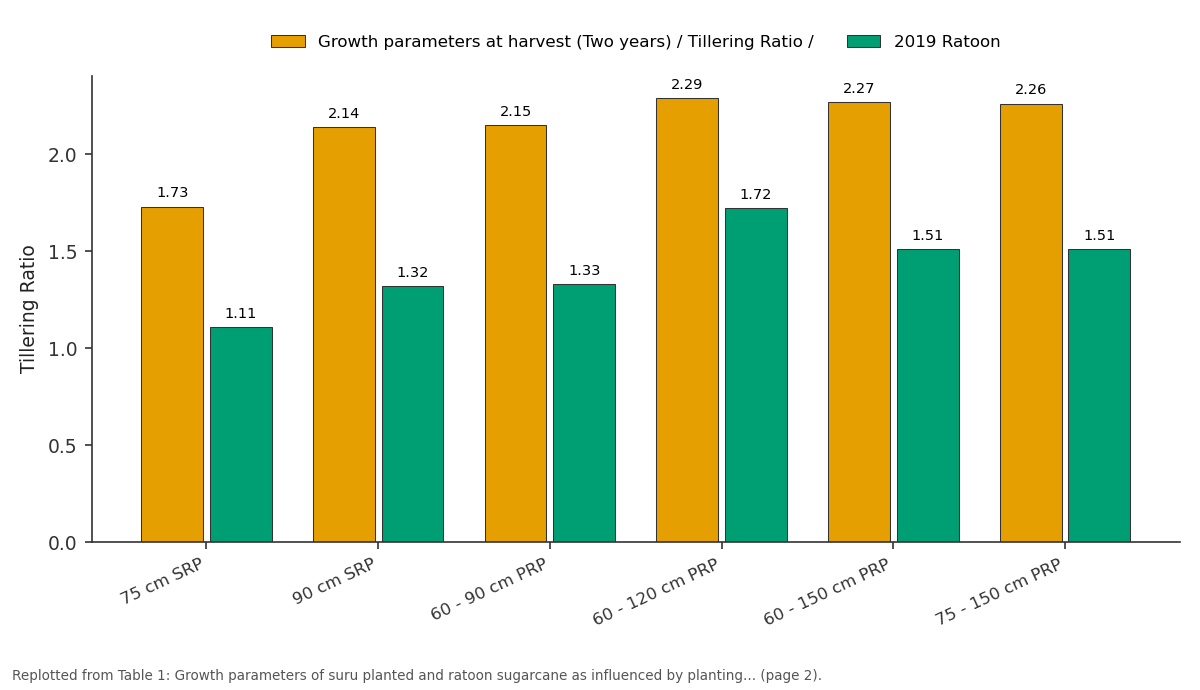
Growth parameters at harvest (Two years) /... and 2019 Ratoon: 75 cm SRP vs 90 cm SRP vs 60 - 90 cm PRP vs 60 - 120 cm PRP vs 60 - 150 cm PRP
Replotted from Table 1 (page 2) of the original paper. Every bar is the paper's own table value.
View source evidence ↗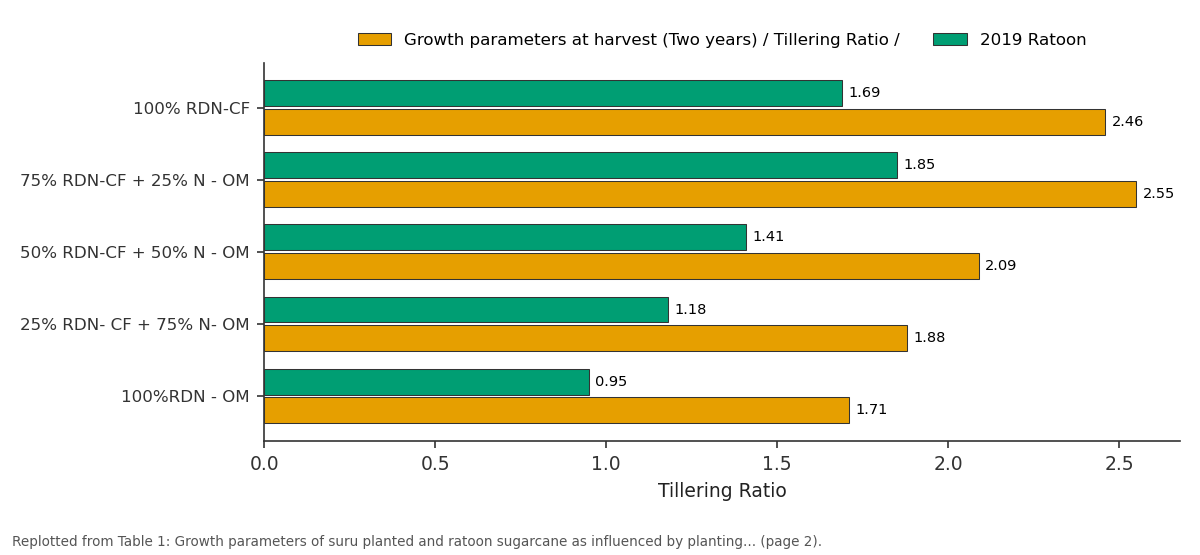
Growth parameters at harvest (Two years) /... and 2019 Ratoon: 100% RDN-CF vs 75% RDN-CF + 25% N - OM vs 50% RDN-CF + 50% N - OM vs 25% RDN- CF + 75% N- OM vs 100%RDN - OM
Replotted from Table 1 (page 2) of the original paper. Every bar is the paper's own table value.
View source evidence ↗Figures & tables
From the original paper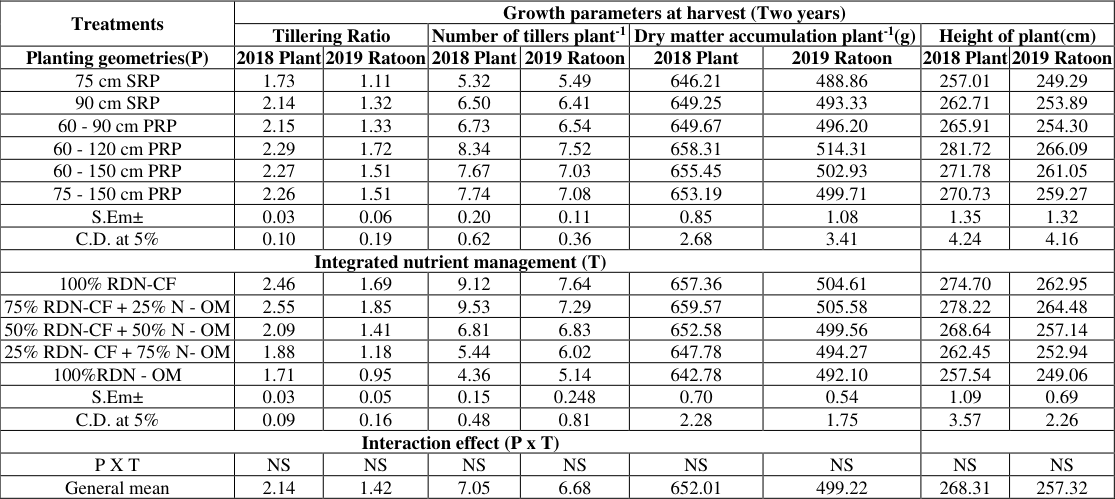 Table 1
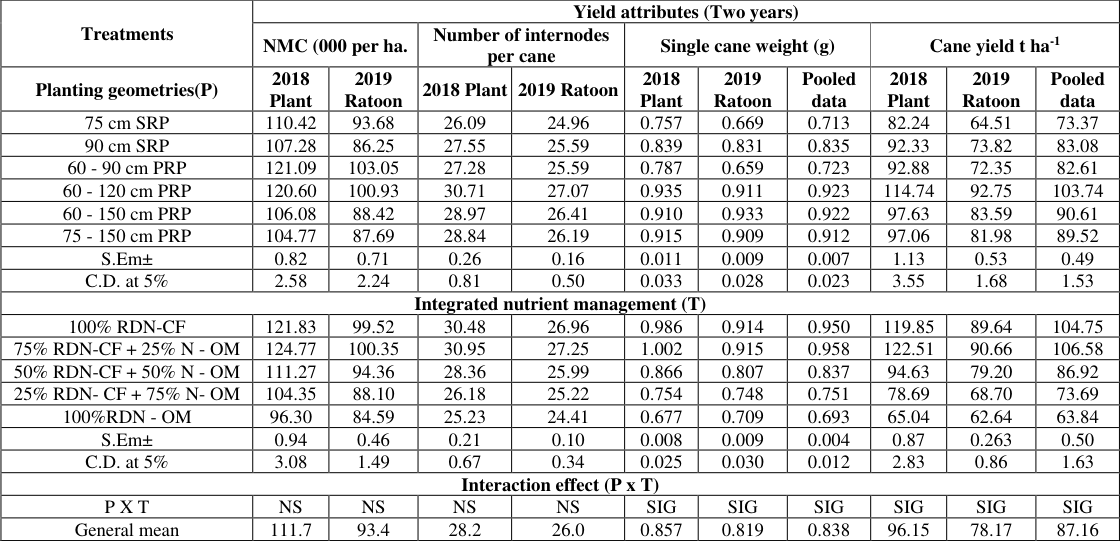 Table 2
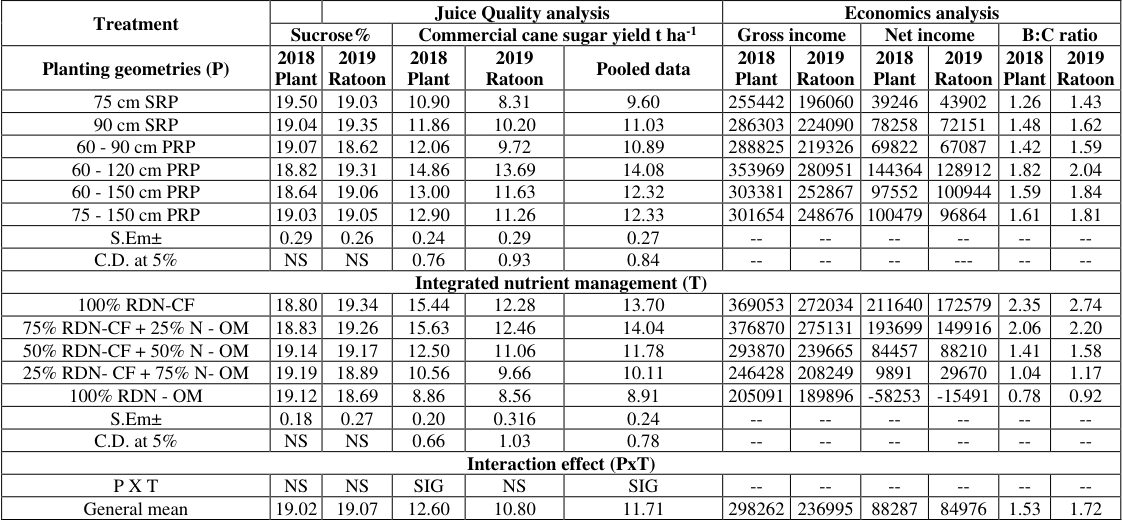 Table 3
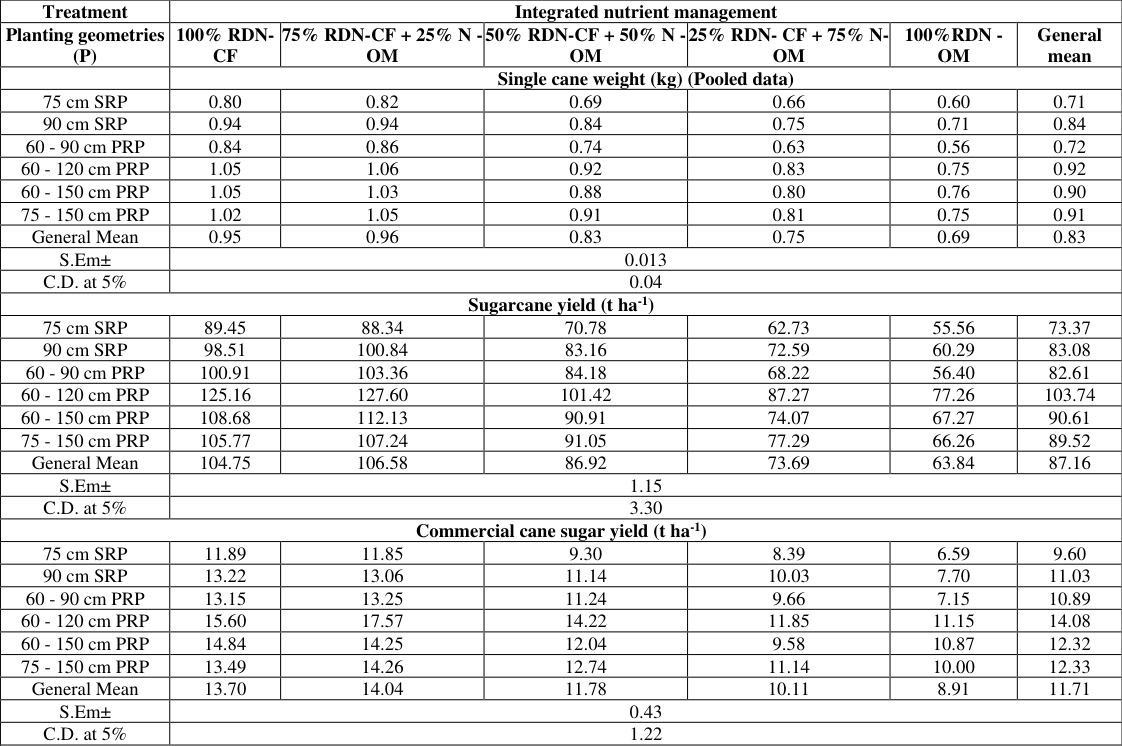 Table 4
Introduction
Sugarcane (Saccharum officinarum L.) is an old energy source crop of industrial importance next to cotton and occupies pivotal position in the agricultural economy of India. Being labour intensive crop provides livelihood to millions through an organized industry, in the rural India. Sugarcane accounts for 60-70% of the cost of sugar production and thus plays a vital role to make sugar industry a commercially viable venture (Kumar et al. 2018) [5] . Total area under sugarcane crop during 2018-19 was 5114 thousand hectare with sugar cane production of about 400.15 million tonnes with average productivity of 78.3 t ha -1 , whereas in Maharashtra, the area was 1163 thousand hectare with total sugarcane production of 92443 thousand tonnes with average productivity of 79.50 t ha -1 (Anon., 2020) [1] . At maximum photosynthetic efficiency of leaves, under ideal condition of growth the sugarcane crop can yield about 364 tha -1 of green stalk and yield of these were obtained under Hawaii islands (Bhunia et al., 2014) [3] . Sugarcane being a perennial crop and put forth dense canopy cover throughout the life period, creates the problems in aeration and impedes direct solar radiation there by creating competition for the resources. It also hinders the intercultural operations, requires higher seed rate increases cost and ultimately results in reduction in the yield. Thus the technique of spaced planting and above that paired row planting with various row spacing have brought out promising results in this respect with very low additional cost in preparation of layouts. This technique facilitates, aeration, inter culturing operation with special reference to use of power tiller for earthing up, mulching and irrigation application to a considerable extent. Sugarcane yield can be enhanced by providing sufficient space, aeration and uniform light distribution through re-adjustment in row to row distance. The analysis of sugarcane productivity trends, during the recent decades revealed the decline in productivity throughout the country due to intensive cultivation causing nutrient loss and deterioration of soil health. Sugarcane being long duration and huge biomass accumulating crop removes substantial amount of plant nutrients from the soil. To sustain biological productivity, maintain environmental quality and promote ecological balance, use of organic sources of nutrients is now becoming necessary as continuous use of chemical fertilizers with heavy doses causes adverse effects on the soil health. Consequently, crop nutrition partially through organic and inorganic is a viable proposition for improving soil fertility, crop yield and sustainability of the system. So by combining the appropriate planting spacing with judicious combination of various sources of organic manures and chemical fertilizers not only helps in breaking yield barrier and maintain soil health but also improves the economy of the sugarcane growers.
Materials and Methods
The field experiment was conducted at Instructional Farm, Department of Agronomy, College of Agriculture, Dapoli. Geographically Dapoli (Dist. Ratnagiri) is located at the 17°45'57" N and 73°10'29" E in the subtropical zone. Standing at an altitude of 157.8 meters, slightly above mean sea level. The climate during course of investigation is sub-tropical which is characterized by warm and humid atmosphere. Over all the variations in weather parameters during both the years of investigation were not observed to considerable extent. The soil was also analysed for physical, chemical and biological properties. The soil analysis indicated that the soil of experimental plot was sandy clay loam in texture, moderately acidic in reaction with moderately high in organic carbon content. Soil was medium in available nitrogen, low in available phosphorus and fairly high in available potassium. The field experiment was laid out in strip plot design with two factors forming 30 treatment combinations replicated thrice. Horizontal strip consisted of six planting geometries viz., 75 cm SRP, 90 cm SRP, 60 -90 cm PRP, 60 -120 cm PRP, 60 -150 cm PRP, 75 -150 cm PRP and along vertical strips five integrated nutrient management treatments, viz., 100% RDF inorganic, 75% RDF N inorganic + 25% N organic, 50% RDF N inorganic + 50% N organic, 25% RDF N inorganic + 75% N organic and 100% N organic. The cultivar used was Co-92005 planted during February 2018 suru season. Planting of sugarcane was done to by using two budded sets after preparation of planting layout as per the treatments. After harvesting, same was continued in ratoon with appropriate ratoon management practices by repeating the same set of the treatments during 2019. Integrated nutrient management was done as per treatments by using straight fertilizers and various sources of organic manures to replace the chemical fertilizer N. Sources mainly consists of FYM 40%, poultry manure 40% and vermicompost 20%. All the crop management practices were carried out as per recommendation. Necessary plant protection measures were taken to keep the crop pest and disease free. Randomly five plants were selected for periodical growth, yield attributes and juice quality parameters study. Cane juice was extracted by using sugarcane crusher and juice quality was estimated as per method given by Spencer and Meade (1964) [10] . Millable cane yield was estimated after cutting, removing trash and topping of canes, from each plot and weight was recorded and converted on per hectare basis (t ha -1 ). Commercial cane sugar yield was also estimated by using the formula: CCS yield tha -1 X CCS (%)
Economics of the treatments was calculated on the basis of prevailing prices of inputs and market rate of sugarcane.
Results and Discussion
Planting geometries Conspicuous improvement in the tillering ratio, number of tillers plant -1 , dry matter accumulation plant -1 (g), height of plant(cm) and dry matter accumulation due to the planting of cane at 60-120 cm PRP during both the years. This was followed by 60-150 cm paired row, and 75-150 cm paired row which was found in turn superior over close planting patterns i.e. 60-90 cm (PRP), 90 cm SRP and 75 cm SRP. Positive impact on growth of sugarcane due to these planting patterns was also reflected in the yield attributes, yield and economics of the sugar cane crop. The yield attributes like number of millable cane at harvest, number of internodes per cane single cane weight and cane yield t ha -1 was improved significantly due planting at 60-120 cm (PRP) as compared to 60-150 cm (PRP) and 75-150 cm PRP which showed its superiority over 60-90 cm (PRP), 90 cm SRP and 75 cm SRP. Qualitative analysis of sugarcane juice was done and it was recorded that sucrose per cent did not get influenced due to various planting geometries, however the commercial cane sugar yield tha -1 follows the similar trend as that of sugarcane yield. Enhanced growth, yield attributes and the yield of cane due to the wider row with paired planting was also reported by Benda et al., 1987 [2] and Patel et al., (2014) [8] . This might be attributed due to provision of optimum environment in terms of space, aeration and uniform light distribution which resulted in maximum height, number of tillers dry matter accumulation and number of millable cane. This ultimately results in significant increase in single cane weight there by getting higher cane yield. Over all the impact of optimum spacing at 60-120 cm who also showed an improved gross return, net return and BC ratio as compared to the conventional planting. Similar findings were also reported by Jain 2019 [4] . Wider spacing reduces the seed maternal cost, facilitates the cultural operations with economy in labour use and higher yields boosting the B:C ratio.
Integrated nutrient Management
Application of 75% N inorganic + 25% N organic recorded significantly higher tillering ratio, number of tillers per plant, dry matter accumulation, height of cane as well as the yield attributes viz., number of millable cane per hectare, single cane weight and ultimately the sugar cane yield tha -1 as compared rest of the other integrated nutrient management combinations except 100% N inorganic where both the treatments were found to be at par with each other. Further for each successive replacement of 25% N by organic source showed decline trend in growth yield attributes and yield there by recording of lowest values due to application of 100% N through organic source. The superiority of the 75% N inorganic + 25% N organic treatments might be due to the fact that 75% N applied through inorganic source, release the nutrients essential for the growth quickly and made available to the crop plant during grand growth phase and rest of the 25% N applied through organic source released the nutrients slowly and made available during the post tillering stage thereby ensuring the long term availability of the nutrients. Similar findings were also given by Rao and Veeranna (1998) [9] . Navneet Kumar (2012) [7] also reported that, due to the integrated use of nutrients helped in production due to better nutritional environment for plant growth at active vegetative stage, as a result there was improvement in root growth, cell multiplication and elongation in plant body; which ultimately produced an effective source component. Further sucrose% recorded to study the quality parameter was also not get significantly influenced due to various integrated nutrient management treatments; however, the commercial cane sugar yield tha -1 was recorded significantly higher values due to application of 75% N inorganic + 25% N organic followed closely by 100% N inorganic. The gross income obtained due to application of 75% N inorganic + 25% N organic was higher but the net income and B:C ratio was lower as compared to 100% N in organic which might be due to the higher market cost of FYM, Poultry manure and vermicompost.
Interaction effect
Among the various interactions, the treatment combination 75% inorganic + 25% N organic along with planting of cane at 60-120 cm PRP (P 4 T 2 ) recorded significantly higher single cane weight (kg), cane yield tha -1 and commercial cane sugar yield tha -1 as compared to the rest of the treatment combinations followed by P 4 T 1 similar findings were also reported by Manimaran et al., 2009 [6] . Thus from two years investigation it is concluded that planting of cane at 60-120xm paired row found to be promising as compared to rest of planning spacing and replacement of 25% in organic N by organic source not only improves the yield of cane but also found to be better proposition of long term basis. fertilization of sugarcane with 100% RDF through chemical source is economical but on long term basis, application of 75% N inorganic + 25% N organic along as the planting of cane at 60-120 cm spacing is a viable option in sustainable cane cultivation.
Conclusion
The planting geometry of cane at 60-120 cm paired row spacing demonstrated significant improvements in tillering ratio, number of tillers per plant, dry matter accumulation, plant height, and yield attributes such as number of millable cane per hectare and single cane weight. This spacing outperformed narrower planting patterns like 60-90 cm and different single row spacings (SRP). Qualitative analysis of sugarcane juice indicated consistent sucrose percentage across planting geometries, while commercial cane sugar yield followed trends similar to overall cane yield. Integrated nutrient management, particularly with 75% N from inorganic and 25% N from organic sources, showed superior growth parameters and yield attributes compared to other combinations, except 100% N from inorganic sources. This approach supports sustainable sugarcane cultivation by enhancing nutrient availability across growth stages. Overall, planting at 60-120 cm paired row with the specified nutrient management strategy emerges as a promising approach for sustainable and economically viable sugarcane production.
Figures and tables from the paper
| Treatments | Growth parameters at harvest (Two years) | — | — | — | — | — | — | — |
|---|---|---|---|---|---|---|---|---|
| Tillering Ratio | Number of tillers plant-1 | Dry matter accumulation plant-1(g) | Height of plant(cm) | |||||
| Planting geometries(P) | 2018 Plant | 2019 Ratoon | 2018 Plant | 2019 Ratoon | 2018 Plant | 2019 Ratoon | 2018 Plant | 2019 Ratoon |
| 75 cm SRP | 1.73 | 1.11 | 5.32 | 5.49 | 646.21 | 488.86 | 257.01 | 249.29 |
| 90 cm SRP | 2.14 | 1.32 | 6.50 | 6.41 | 649.25 | 493.33 | 262.71 | 253.89 |
| 60 - 90 cm PRP | 2.15 | 1.33 | 6.73 | 6.54 | 649.67 | 496.20 | 265.91 | 254.30 |
| 60 - 120 cm PRP | 2.29 | 1.72 | 8.34 | 7.52 | 658.31 | 514.31 | 281.72 | 266.09 |
| 60 - 150 cm PRP | 2.27 | 1.51 | 7.67 | 7.03 | 655.45 | 502.93 | 271.78 | 261.05 |
| 75 - 150 cm PRP | 2.26 | 1.51 | 7.74 | 7.08 | 653.19 | 499.71 | 270.73 | 259.27 |
| S.Em± | 0.03 | 0.06 | 0.20 | 0.11 | 0.85 | 1.08 | 1.35 | 1.32 |
| C.D. at 5% | 0.10 | 0.19 | 0.62 | 0.36 | 2.68 | 3.41 | 4.24 | 4.16 |
| Integrated nutrient management (T) | ||||||||
| 100% RDN-CF | 2.46 | 1.69 | 9.12 | 7.64 | 657.36 | 504.61 | 274.70 | 262.95 |
| 75% RDN-CF + 25% N - OM | 2.55 | 1.85 | 9.53 | 7.29 | 659.57 | 505.58 | 278.22 | 264.48 |
| 50% RDN-CF + 50% N - OM | 2.09 | 1.41 | 6.81 | 6.83 | 652.58 | 499.56 | 268.64 | 257.14 |
| 25% RDN- CF + 75% N- OM | 1.88 | 1.18 | 5.44 | 6.02 | 647.78 | 494.27 | 262.45 | 252.94 |
| 100%RDN - OM | 1.71 | 0.95 | 4.36 | 5.14 | 642.78 | 492.10 | 257.54 | 249.06 |
| S.Em± | 0.03 | 0.05 | 0.15 | 0.248 | 0.70 | 0.54 | 1.09 | 0.69 |
| C.D. at 5% | 0.09 | 0.16 | 0.48 | 0.81 | 2.28 | 1.75 | 3.57 | 2.26 |
| Interaction effect (P x T) | ||||||||
| P X T | NS | NS | NS | NS | NS | NS | NS | NS |
| General mean | 2.14 | 1.42 | 7.05 | 6.68 | 652.01 | 499.22 | 268.31 | 257.32 |
Table text extracted from the original PDF; superscript letters are shown inline. The original table image is below.
View original table image
| Treatments | Yield attributes (Two years) | — | — | — | — | — | — | — | — | — |
|---|---|---|---|---|---|---|---|---|---|---|
| NMC (000 per ha. | Number of internodes per cane | Single cane weight (g) | Cane yield t ha-1 | |||||||
| Planting geometries(P) | 2018 Plant | 2019 Ratoon | 2018 Plant | 2019 Ratoon | 2018 Plant | 2019 Ratoon | Pooled data | 2018 Plant | 2019 Ratoon | Pooled data |
| 75 cm SRP | 110.42 | 93.68 | 26.09 | 24.96 | 0.757 | 0.669 | 0.713 | 82.24 | 64.51 | 73.37 |
| 90 cm SRP | 107.28 | 86.25 | 27.55 | 25.59 | 0.839 | 0.831 | 0.835 | 92.33 | 73.82 | 83.08 |
| 60 - 90 cm PRP | 121.09 | 103.05 | 27.28 | 25.59 | 0.787 | 0.659 | 0.723 | 92.88 | 72.35 | 82.61 |
| 60 - 120 cm PRP | 120.60 | 100.93 | 30.71 | 27.07 | 0.935 | 0.911 | 0.923 | 114.74 | 92.75 | 103.74 |
| 60 - 150 cm PRP | 106.08 | 88.42 | 28.97 | 26.41 | 0.910 | 0.933 | 0.922 | 97.63 | 83.59 | 90.61 |
| 75 - 150 cm PRP | 104.77 | 87.69 | 28.84 | 26.19 | 0.915 | 0.909 | 0.912 | 97.06 | 81.98 | 89.52 |
| S.Em± | 0.82 | 0.71 | 0.26 | 0.16 | 0.011 | 0.009 | 0.007 | 1.13 | 0.53 | 0.49 |
| C.D. at 5% | 2.58 | 2.24 | 0.81 | 0.50 | 0.033 | 0.028 | 0.023 | 3.55 | 1.68 | 1.53 |
| Integrated nutrient management (T) | ||||||||||
| 100% RDN-CF | 121.83 | 99.52 | 30.48 | 26.96 | 0.986 | 0.914 | 0.950 | 119.85 | 89.64 | 104.75 |
| 75% RDN-CF + 25% N - OM | 124.77 | 100.35 | 30.95 | 27.25 | 1.002 | 0.915 | 0.958 | 122.51 | 90.66 | 106.58 |
| 50% RDN-CF + 50% N - OM | 111.27 | 94.36 | 28.36 | 25.99 | 0.866 | 0.807 | 0.837 | 94.63 | 79.20 | 86.92 |
| 25% RDN- CF + 75% N- OM | 104.35 | 88.10 | 26.18 | 25.22 | 0.754 | 0.748 | 0.751 | 78.69 | 68.70 | 73.69 |
| 100%RDN - OM | 96.30 | 84.59 | 25.23 | 24.41 | 0.677 | 0.709 | 0.693 | 65.04 | 62.64 | 63.84 |
| S.Em± | 0.94 | 0.46 | 0.21 | 0.10 | 0.008 | 0.009 | 0.004 | 0.87 | 0.263 | 0.50 |
| C.D. at 5% | 3.08 | 1.49 | 0.67 | 0.34 | 0.025 | 0.030 | 0.012 | 2.83 | 0.86 | 1.63 |
| Interaction effect (P x T) | ||||||||||
| P X T | NS | NS | NS | NS | SIG | SIG | SIG | SIG | SIG | SIG |
| General mean | 111.7 | 93.4 | 28.2 | 26.0 | 0.857 | 0.819 | 0.838 | 96.15 | 78.17 | 87.16 |
Table text extracted from the original PDF; superscript letters are shown inline. The original table image is below.
View original table image
| Treatment | — | Juice Quality analysis | — | — | — | Economics analysis | — | — | — | — | — |
|---|---|---|---|---|---|---|---|---|---|---|---|
| Sucrose% | Commercial cane sugar yield t ha-1 | Gross income | Net income | B:C ratio | |||||||
| Planting geometries (P) | 2018 Plant | 2019 Ratoon | 2018 Plant | 2019 Ratoon | Pooled data | 2018 Plant | 2019 Ratoon | 2018 Plant | 2019 Ratoon | 2018 Plant | 2019 Ratoon |
| 75 cm SRP | 19.50 | 19.03 | 10.90 | 8.31 | 9.60 | 255442 | 196060 | 39246 | 43902 | 1.26 | 1.43 |
| 90 cm SRP | 19.04 | 19.35 | 11.86 | 10.20 | 11.03 | 286303 | 224090 | 78258 | 72151 | 1.48 | 1.62 |
| 60 - 90 cm PRP | 19.07 | 18.62 | 12.06 | 9.72 | 10.89 | 288825 | 219326 | 69822 | 67087 | 1.42 | 1.59 |
| 60 - 120 cm PRP | 18.82 | 19.31 | 14.86 | 13.69 | 14.08 | 353969 | 280951 | 144364 | 128912 | 1.82 | 2.04 |
| 60 - 150 cm PRP | 18.64 | 19.06 | 13.00 | 11.63 | 12.32 | 303381 | 252867 | 97552 | 100944 | 1.59 | 1.84 |
| 75 - 150 cm PRP | 19.03 | 19.05 | 12.90 | 11.26 | 12.33 | 301654 | 248676 | 100479 | 96864 | 1.61 | 1.81 |
| S.Em± | 0.29 | 0.26 | 0.24 | 0.29 | 0.27 | -- | -- | -- | -- | -- | -- |
| C.D. at 5% | NS | NS | 0.76 | 0.93 | 0.84 | -- | -- | -- | --- | -- | -- |
| Integrated nutrient management (T) | |||||||||||
| 100% RDN-CF | 18.80 | 19.34 | 15.44 | 12.28 | 13.70 | 369053 | 272034 | 211640 | 172579 | 2.35 | 2.74 |
| 75% RDN-CF + 25% N - OM | 18.83 | 19.26 | 15.63 | 12.46 | 14.04 | 376870 | 275131 | 193699 | 149916 | 2.06 | 2.20 |
| 50% RDN-CF + 50% N - OM | 19.14 | 19.17 | 12.50 | 11.06 | 11.78 | 293870 | 239665 | 84457 | 88210 | 1.41 | 1.58 |
| 25% RDN- CF + 75% N- OM | 19.19 | 18.89 | 10.56 | 9.66 | 10.11 | 246428 | 208249 | 9891 | 29670 | 1.04 | 1.17 |
| 100% RDN - OM | 19.12 | 18.69 | 8.86 | 8.56 | 8.91 | 205091 | 189896 | -58253 | -15491 | 0.78 | 0.92 |
| S.Em± | 0.18 | 0.27 | 0.20 | 0.316 | 0.24 | -- | -- | -- | -- | -- | -- |
| C.D. at 5% | NS | NS | 0.66 | 1.03 | 0.78 | -- | -- | -- | -- | -- | -- |
| Interaction effect (PxT) | |||||||||||
| P X T | NS | NS | SIG | NS | SIG | -- | -- | -- | -- | -- | -- |
| General mean | 19.02 | 19.07 | 12.60 | 10.80 | 11.71 | 298262 | 236995 | 88287 | 84976 | 1.53 | 1.72 |
Table text extracted from the original PDF; superscript letters are shown inline. The original table image is below.
View original table image
| Treatment | Integrated nutrient management | — | — | — | — | — |
|---|---|---|---|---|---|---|
| Planting geometries (P) | 100% RDN- CF | 75% RDN-CF + 25% N - OM | 50% RDN-CF + 50% N - OM | 25% RDN- CF + 75% N- OM | 100%RDN - OM | General mean |
| Single cane weight (kg) (Pooled data) | ||||||
| 75 cm SRP | 0.80 | 0.82 | 0.69 | 0.66 | 0.60 | 0.71 |
| 90 cm SRP | 0.94 | 0.94 | 0.84 | 0.75 | 0.71 | 0.84 |
| 60 - 90 cm PRP | 0.84 | 0.86 | 0.74 | 0.63 | 0.56 | 0.72 |
| 60 - 120 cm PRP | 1.05 | 1.06 | 0.92 | 0.83 | 0.75 | 0.92 |
| 60 - 150 cm PRP | 1.05 | 1.03 | 0.88 | 0.80 | 0.76 | 0.90 |
| 75 - 150 cm PRP | 1.02 | 1.05 | 0.91 | 0.81 | 0.75 | 0.91 |
| General Mean | 0.95 | 0.96 | 0.83 | 0.75 | 0.69 | 0.83 |
| S.Em± | 0.013 | |||||
| C.D. at 5% | 0.04 | |||||
| Sugarcane yield (t ha-1) | ||||||
| 75 cm SRP | 89.45 | 88.34 | 70.78 | 62.73 | 55.56 | 73.37 |
| 90 cm SRP | 98.51 | 100.84 | 83.16 | 72.59 | 60.29 | 83.08 |
| 60 - 90 cm PRP | 100.91 | 103.36 | 84.18 | 68.22 | 56.40 | 82.61 |
| 60 - 120 cm PRP | 125.16 | 127.60 | 101.42 | 87.27 | 77.26 | 103.74 |
| 60 - 150 cm PRP | 108.68 | 112.13 | 90.91 | 74.07 | 67.27 | 90.61 |
| 75 - 150 cm PRP | 105.77 | 107.24 | 91.05 | 77.29 | 66.26 | 89.52 |
| General Mean | 104.75 | 106.58 | 86.92 | 73.69 | 63.84 | 87.16 |
| S.Em± | 1.15 | |||||
| C.D. at 5% | 3.30 | |||||
| Commercial cane sugar yield (t ha-1) | ||||||
| 75 cm SRP | 11.89 | 11.85 | 9.30 | 8.39 | 6.59 | 9.60 |
| 90 cm SRP | 13.22 | 13.06 | 11.14 | 10.03 | 7.70 | 11.03 |
| 60 - 90 cm PRP | 13.15 | 13.25 | 11.24 | 9.66 | 7.15 | 10.89 |
| 60 - 120 cm PRP | 15.60 | 17.57 | 14.22 | 11.85 | 11.15 | 14.08 |
| 60 - 150 cm PRP | 14.84 | 14.25 | 12.04 | 9.58 | 10.87 | 12.32 |
| 75 - 150 cm PRP | 13.49 | 14.26 | 12.74 | 11.14 | 10.00 | 12.33 |
| General Mean | 13.70 | 14.04 | 11.78 | 10.11 | 8.91 | 11.71 |
| S.Em± | 0.43 | |||||
| C.D. at 5% | 1.22 |
Table text extracted from the original PDF; superscript letters are shown inline. The original table image is below.
View original table image
References
8 in the original paper- Anonymous. Area, Production and Productivity of sugarcane in India. Coop Sug. 2020;51(5).
- Benda GTA, Dunkelman JW, Irvene JE. Narrow row spacing and Sugarcane Productivity. Sugarcane. 1987;4:1519.
- Bhunia SR, Chauhan RPS, Mohd. Arif. Effect of planting geometry and drip irrigation levels on sugarcane (Saccharum officinarum) yield, WUE, and cane quality under transgenic plains of Rajasthan. Agri for sus Dev. 2014;2(2):134-136.
- Jain V. Effect of planting geometry on growth and yield of sugarcane (Special Issue -6) 3 rd National Conference on Promoting and reinvigorating agri-horti, Technological innovations Int J Chem Studies. 2019;SP6:306-308.
- Manimaran S, Kalyansundram D, Ramesh S, Shivkumar K. Maximizing sugarcane yield through efficient planting methods and nutrient management practices. Sug Tech. 2009;11(4):395-397.
- Navneet Kumar. Productivity, quality and nutrient balance in spring sugarcane (Saccharum Spp. Hybrid complex) under organic and inorganic nutrition. Ind J Agron. 2012;57(1):68-73.
- Patel D, Raj VC, Tandel B, Patel B, Patel DU, Surve V. Influence of planting distance and variety on growth of sugarcane and weed population under mechanization. J Int Acad Res for Multidisc. 2014;2(6):34-41.
- Rao S, Veeranna VS. Substitution of Inorganic nitrogen through local organic manures in sugarcane. J Maharashtra agric Univ. 1998;23(2):104-106.