
Research article · 2024 · Full text
International Journal of Agriculture Extension and Social DevelopmentAdoption behaviour of fish farmers towards improved aquaculture practices of rohu Labeo rohita in Bishnupur district of Manipur, India
Volume 7(7) · Pages 325–329 · DOI: 10.33545/26180723.2024.v7.i7e.817 ↗
Research areasFisheries and Aquaculture StudiesAgricultural Economics and PracticesFish Biology and Ecology Studies
Abstract
Author-writtenThe study was on adoption behaviour of fish farmers towards improved aquaculture practices of Rohu “Labeo rohita” in Bishnupur district of Manipur was conducted in the session 2023-2024. A total number of 120 respondents were taken randomly from Khathinungei (Keirenphabi) Village in Moirang subdivision/block of the Bishnupur District as it is the place where maximum area under rohu aquaculture practices. The primary data was collected using pre-structured interview schedule with appropriate statistical analysis to obtain the results. The study’s finding shows that 43.33 percent of the respondents have medium adoption level, 32.5 percent of the respondents have high level of adoption and 24.17 percent of the respondents have low adoption level. It was revealed that all ten independent variables, i.e. Age, Education, Occupation, Housing Pattern, Land, Annual Income, Mass Media Exposure, Sources of fish farming information, Innovativeness and Risk Orientation are positively and significantly correlated with and adoption of farmers towards improved Aquaculture practices of Rohu.
Summary
Source-checkedPlain-language reading of the full paper, prepared with AI and checked against the text. Each point links to the authors' own words.
Why it matters
- Rohu (Labeo rohita) is a fast-growing freshwater fish extensively cultured in South Asia, capable of reaching 700-800 g in weight within one year. View evidence ↗
- In the Bishnupur district of Manipur, fish farming is a vital source of income that supports local livelihoods and the rural economy. View evidence ↗
- Understanding adoption behavior is necessary to create strategies that maximize the use of recommended aquaculture practices and address constraints faced by farmers. View evidence ↗
What they did
- The researchers randomly selected 120 respondents from Keirenphabi Village in the Moirang block of Bishnupur District, an area with significant Rohu aquaculture. View evidence ↗
- Data was collected using a survey method with a pre-tested, structured interview schedule. View evidence ↗
- The study used statistical tools to analyze the data, specifically calculating frequencies, percentages, and correlations. View evidence ↗
What they found
- The overall adoption level of improved practices was medium for 43.33% of farmers, high for 32.5%, and low for 24.17%. View evidence ↗
- The most widely adopted practice was the use of pond bottom and lining, fully adopted by 96.67% of respondents. View evidence ↗
- A large majority of farmers (83.33%) did not adopt the use of separate quarantine ponds or tanks for disease prevention. View evidence ↗
- Checking the health of fingerlings before stocking was highly adopted, with 94.17% of respondents fully implementing this practice. View evidence ↗
- Over half of the respondents (53.33%) failed to adopt the proper size and depth of ponds before stocking. View evidence ↗
- Ten independent variables, including age, education, income, and risk orientation, were all found to be positively and significantly correlated with the adoption of improved aquaculture practices. View evidence ↗
What it means
- The authors recommend increasing adoption through training provided by fisheries department staff and frequent visits from extension representatives. View evidence ↗
Visual summary
2 visualsIllustrations explain the paper; charts are replotted from the paper's own table values.
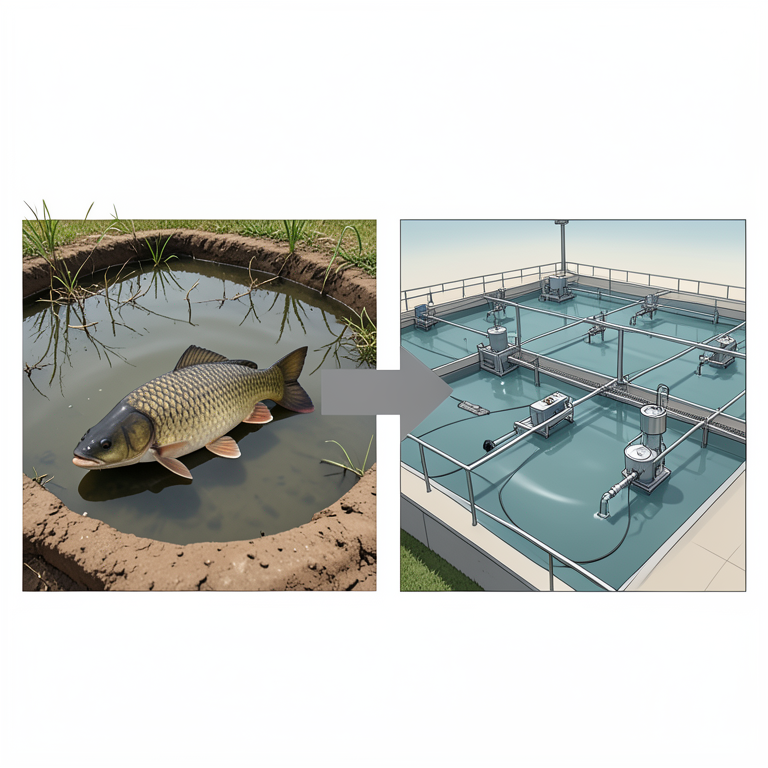
Factors Influencing Adoption
AI-generated conceptual illustration (Rohu fish (Labeo rohita) in aquaculture ponds). It explains the idea and does not show study data.
View source evidence ↗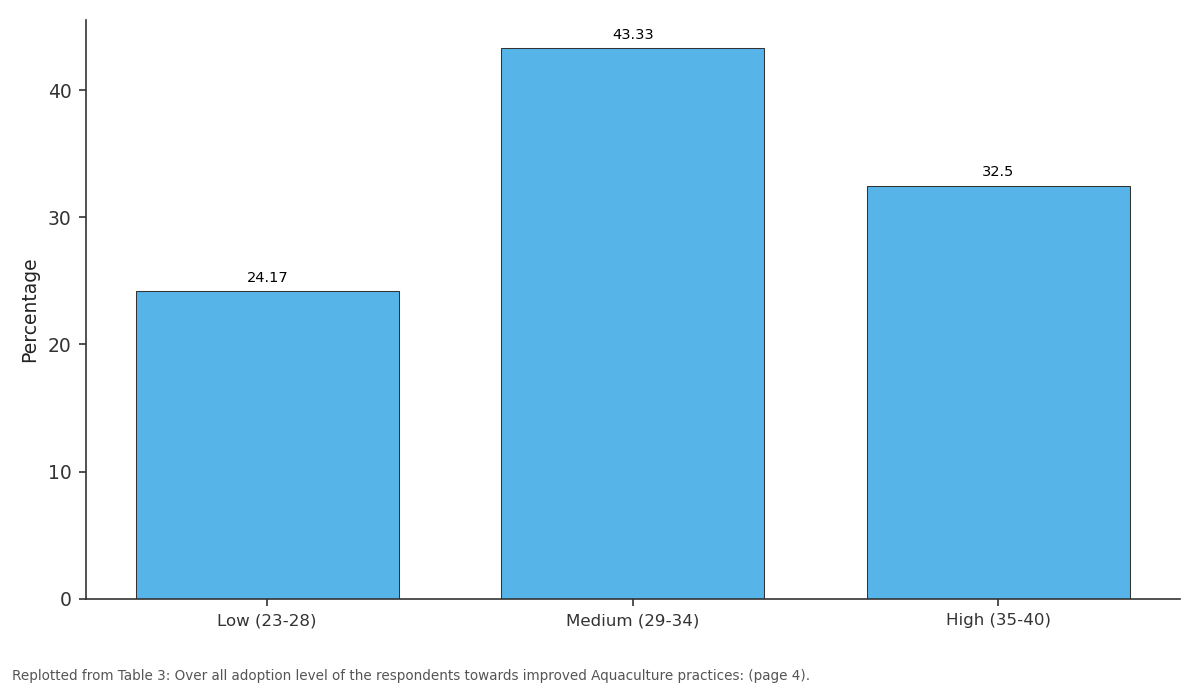
Percentage: Low (23-28) vs Medium (29-34) vs High (35-40)
Replotted from Table 3 (page 4) of the original paper. Every bar is the paper's own table value.
View source evidence ↗Figures & tables
From the original paper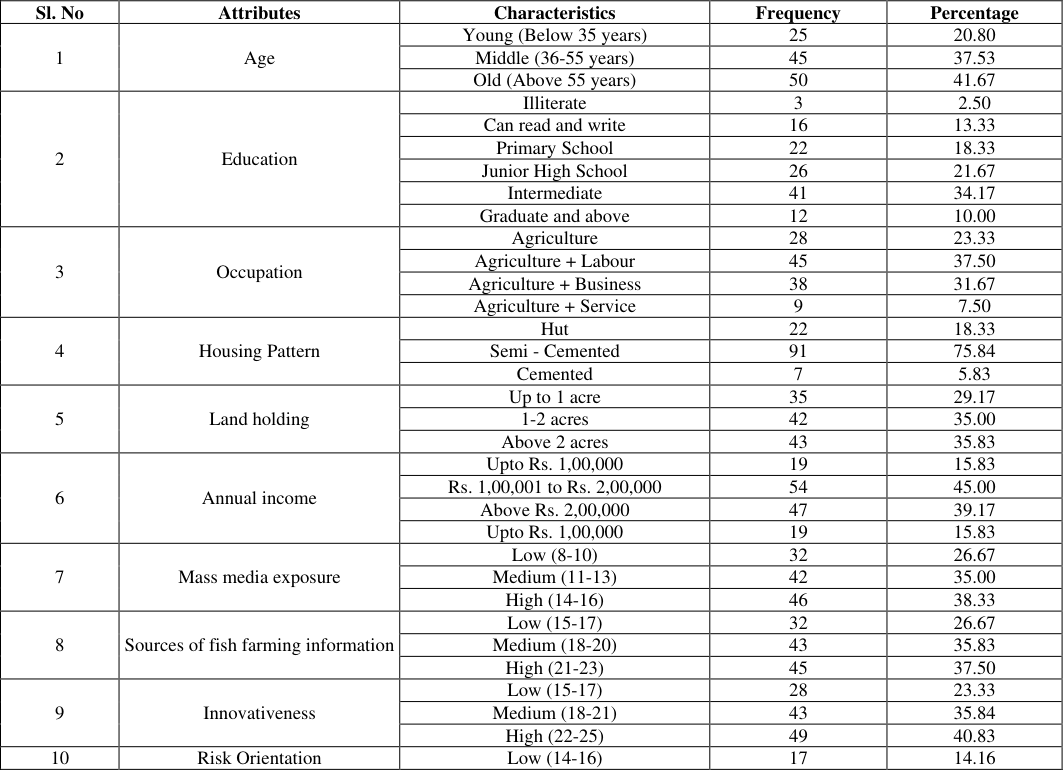 Table 1
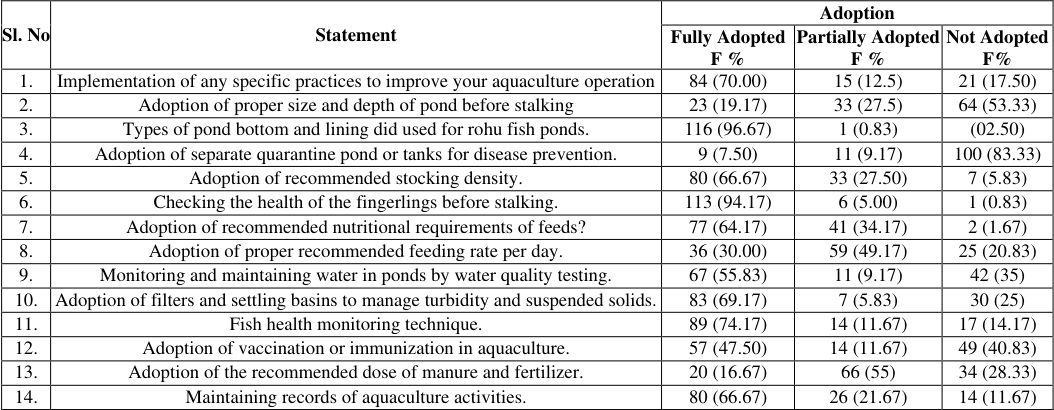 Table 2
 Table 3
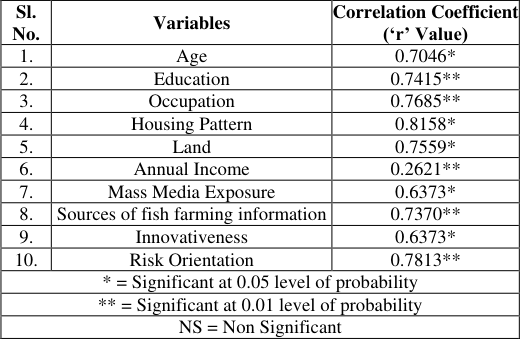 Table 4
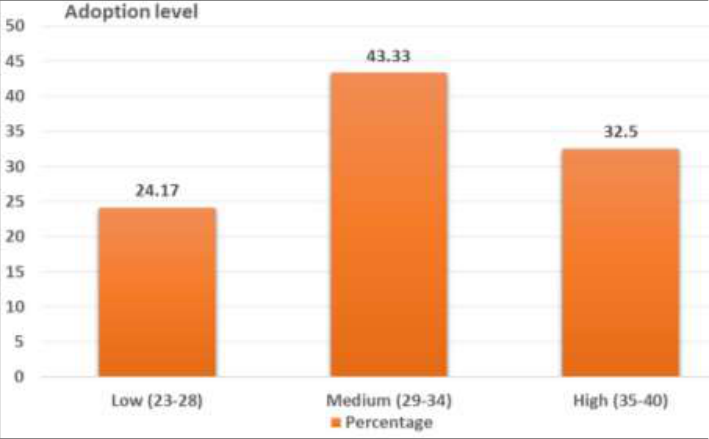 Figure 1
Introduction
The rohu (Labeo rohita) is a carp fish found in South Asia. The Rohu is a freshwater omnivore that exhibits a varied diet throughout its life cycle. During its initial developmental stages, it primarily feeds on zooplankton; however, it progressively increases its consumption of phytoplankton as it grows. As a juvenile or adult, it is a herbivorous column feeder, primarily feeding on phytoplankton and submerged vegetation. The Rohu's feeding mechanism involves utilizing modified, thin hairlike gill rakers, which allow it to filter out food particles from the water. This species is extensively cultured in South Asia and is known for its fast growth, with individuals reaching up to 35-45 cm in total length and 700-800 g in weight within a year, under normal growth conditions. It is the most extensively grown freshwater fish in Bangladesh due to its great growth potential, healthy and exquisite taste, and high market value, as well as its readily available fry and fingerlings for culture and consumer preferences. Due to its favorable compatibility with other carp species like Catla (Catla catla) and Mrigal (Cirrhinus mrigala), the Rohu has become a favored option for carp polyculture systems (Wakkas et al., 2023) [4] . Manipur is a tiny state among the 7 north-eastern states of India bordering with Myanmar. The state has a geographical area of 8,621 square miles (22,327 square km) and a population of 2855794 (2011 census) with a hill and valley land ratio of 90:10. Being isolated from the rest of the country, it has a rich bio-diversity hotspot of flora and fauna and the state is a home of cultures and sports. Next to the rice, it is the Nga (Fishes) or popularly called as the Chak-Nga meaning "rice-fish" is an indispensable part of the majority Meitei community. Way back from their ancestors, cultivation of rice and fishes has been an associated form of farming practices of the Manipuri's. Each event from the birth of a child to the last ritual ceremony of an individual has a menu for the fishes. There were mainly traditional and sustainable forms of rice and fish production; however, such practices and scenario have lost due to various faulty and scientific farming approaches resulting in the lost of many indigenous species of fishes. (Singh et al., 2022) [2] . Rohu fish (Labeo rohita) is a commonly found and consumed freshwater fish in Manipur, including Bishnupur district. The district is known for its agricultural activities, including fish farming and offers a vital source of income for many families in Manipur. It supports livelihoods and contributes to the rural economy. Most of the fish farmers perform polyculture fish farming technique based on three indigenous carp species with complementary feeding habits like the surface feeder catla (Catla catla), the column feeder rohu (Labeo rohita) and bottom feeder mrigal (Cirrhinus cirrhosus). Constraints Faced by the Farmers Adopting Paddy-Fish Farming System in Bishnupur District of Manipur revealed that water shortage was the most importance problem in all four systems followed by lack of sufficient funds. Other problems include flooding, high cost of fingerlings, lack of proper drainage system, lack of good quality seeds and www.extensionjournal.com fingerlings; high price of chemicals and fertilizers were the major problems (Devi, 2023) [1] .
Justification of the study
This is a bright prospect of knowing the adoption behaviour of fish farmers towards improved aquaculture practices of Rohu "Labeo rohita". The findings of this study is expected to help in making suitable strategies in tackling the adoption behaviour of the fish farmers in order to maximize it and also to tackle the constraint faced by the fish farmers while adopting the recommended aquaculture practices for Rohu "Labeo rohita" production.
Objectives of the study
To assess the socio-economic profile of the fish farmers. To determine the adoption behavior of fish farmers towards improved aquaculture practices. To find out the relationship between selected dependent variables with independent variables.
Methodology
The study was conducted in Bishnupur District of Manipur. Descriptive research design was followed for the present study as it describes characteristic of a population or phenomenon being studied. Multi stages sampling was followed for the present study for the selection of samples required. Manipur has 16 districts and out of which Bishnupur District as it is the place where maximum area under rohu aquaculture practices. There are 3 blocks in Bishnupur district of Manipur, out of which Moirang block was selected purposively based on maximum area under rohu aquaculture practices. Khathinungei (Keirenphabi) village of Bishnupur district was selected through purposive sampling method based on maximum area under rohu aquaculture. A total of 120 respondents were selected randomly for the present study from Keirenphabi village.
Methods used for data collection
A pre-tested structured interview schedule directed towards the objectives of the study was developed for data collection. Survey method of data collection with the help of pre-structured interview schedule was used. The collected data from the respondents were scored, tabulated and analyzed to calculate frequency, percentage, and correlation using statistical tools).
Data statistical analysis
The data collected from the respondents was converted to three points score (Likert Scale) and tabulated. The evaluation of the data and the relationship between the independent and dependent variables was done using Mean, Frequency, Percentage and Correlation. The data presented in Table 1, indicates that 41.67 percent of the respondents are of old age (Above 55 years), 37.53 percent middle age (36-55 years) and 20.80 percent of the respondents are of young age (Below 35 years). Therefore the majority of the respondents were middle to old age group. It shows that 34.17 percent of the respondents had Intermediate level of education 21.67 percent of the respondents were educated up-to Junior High School, 13.33 percent of the respondents Can Read and Write without any formal education, followed by 10.00 percent of the respondents had Graduate and Above education and 2.50 percent were illiterate. It was observed that 37.50 percent of the respondents were engaged in agriculture and labour, 31.67 percent of the respondents were engaged in agriculture and business, 23.33 percent of the respondents were engaged agriculture only, followed by 7.50 percent of the respondents were doing service besides agriculture. It shows that majority (75.84%) of the houses are semicemented 18.33 percent of the respondent's houses are hut and 5.83 percent of the houses are cemented. It shows that 35.83 percent of the respondents had more than 2 acres of land, 35.00 percent of the respondent's had 1-2 acres of land and 29.17 percent of the respondents had up to 1 acre of land. It revealed that 45.00 percent of the respondent's income is between 1, 00, 001 to 2lakh rupees, 39.17 percent of the respondent's income is above 2 lakh rupees and 15.83 percent of the respondents have income upto 1,00,000 lakh rupees. It shows that majority 38.33 percent of the respondents have high level media exposure, 35.00 percent of the respondents have high level of mass media exposure followed by 26.67 percent of the respondents have low level of media exposure. It reveals that 37.50 percent of the respondents have high level Sources of fish farming information, 35.83 percent of the respondents have medium level Sources of fish farming information and 26.67 percent of the respondents have low level Sources of fish farming information. It reveals that majority (40.83%) of the respondents have high level of innovativeness, 35.84 percent of the respondents have medium level of innovativeness and 23.33 percent of the respondents have low level of innovativeness. It shows that 44.17 percent of the respondents have high level of risk orientation, 41.67 percent of the respondents have medium level of risk orientation and 14.16 percent of the respondents have low level of risk orientation. The above table 2, reveals that majority (70.00%) of the respondents fully adopts specific practices to improve your aquaculture operation for Rohu fish like new fish feeds, etc. It was observed (53.33%) of the respondents not adopt proper size and depth of pond before stalking for Rohu fish. It shows that majority (96.67%) of the respondents fully adopts the pond bottom and lining for rohu fish pond. It shows that majority (83.33%) of the respondents do not adopt separate quarantine pond or tanks for disease prevention for Rohu fish. It reveals that majority (66.67%) of the respondents fully adopt the recommended stocking density for Rohu fish. It was found that majority (94.17%) of the respondents fully adopt checking the health of the fingerlings before stalking for Rohu fish. It was observed that majority (64.17%) of the respondents fully adopt the recommended nutritional requirements of feeds for Rohu fish. It shows that majority 49.17 percent of the respondents partially adopt proper recommended feeding rate per day for rohu fish. It shows that majority (55.83%) of the respondent fully adopt the monitoring and maintaining water in Rohu fish ponds by water quality testing. It was revealed that majority (69.17%) of the respondents fully adopt filters and settling basins to manage turbidity and suspended solids for Rohu fish ponds. It was found that majority (74.17%) of the respondent fully adopt fish health monitoring technique for Rohu fish. It was revealed that majority 47.50 percent of the www.extensionjournal.com respondents fully adopt vaccination or immunization in aquaculture practice for rohu fish. It shows that majority (55.00%) of the respondents partially adopt the recommended dose of manure and fertilizer for Rohu fish. It was observed that majority (66.67%) of the respondents fully adopts maintaining records of aquaculture activities for Rohu fish. The above table 3, reveals that 43.33 percent of the respondents have medium adoption level, 32.5 percent of the respondents have high level of adoption and 24.17 percent of the respondents have low adoption level. Similar findings was also reported by Uttej et al., (2023) [3] . The above Table 4, stated that all ten independent variables, i.e. age, education, occupation, farming experience, annual income, housing pattern, mass media exposure, Sources of fish farming information, innovativeness and risk orientation are positively and significantly correlated with adoption of farmers towards improved Aquaculture practices.
| Sl. No. | Variables | Correlation Coefficient (‘r’ Value) |
|---|---|---|
| 1. | Age | 0.7046* |
| 2. | Education | 0.7415** |
| 3. | Occupation | 0.7685** |
| 4. | Housing Pattern | 0.8158* |
| 5. | Land | 0.7559* |
| 6. | Annual Income | 0.2621** |
| 7. | Mass Media Exposure | 0.6373* |
| 8. | Sources of fish farming information | 0.7370** |
| 9. | Innovativeness | 0.6373* |
| 10. | Risk Orientation | 0.7813** |
| * = Significant at 0.05 level of probability | ||
| ** = Significant at 0.01 level of probability | ||
| NS = Non Significant |
Table text extracted from the original PDF; superscript letters are shown inline. The original table image is below.
View original table image
| Sl. No | Adoption | Frequency | Percentage |
|---|---|---|---|
| 1 | Low (23-28) | 29 | 24.17 |
| 2 | Medium (29-34) | 52 | 43.33 |
| 3 | High (35-40) | 39 | 32.50 |
| Total | 120 | 100.00 |
Table text extracted from the original PDF; superscript letters are shown inline. The original table image is below.
View original table image
| Sl. No | Statement | Adoption | — | — |
|---|---|---|---|---|
| Fully Adopted F % | Partially Adopted F % | Not Adopted F% | ||
| 1. | Implementation of any specific practices to improve your aquaculture operation | 84 (70.00) | 15 (12.5) | 21 (17.50) |
| 2. | Adoption of proper size and depth of pond before stalking | 23 (19.17) | 33 (27.5) | 64 (53.33) |
| 3. | Types of pond bottom and lining did used for rohu fish ponds. | 116 (96.67) | 1 (0.83) | (02.50) |
| 4. | Adoption of separate quarantine pond or tanks for disease prevention. | 9 (7.50) | 11 (9.17) | 100 (83.33) |
| 5. | Adoption of recommended stocking density. | 80 (66.67) | 33 (27.50) | 7 (5.83) |
| 6. | Checking the health of the fingerlings before stalking. | 113 (94.17) | 6 (5.00) | 1 (0.83) |
| 7. | Adoption of recommended nutritional requirements of feeds? | 77 (64.17) | 41 (34.17) | 2 (1.67) |
| 8. | Adoption of proper recommended feeding rate per day. | 36 (30.00) | 59 (49.17) | 25 (20.83) |
| 9. | Monitoring and maintaining water in ponds by water quality testing. | 67 (55.83) | 11 (9.17) | 42 (35) |
| 10. | Adoption of filters and settling basins to manage turbidity and suspended solids. | 83 (69.17) | 7 (5.83) | 30 (25) |
| 11. | Fish health monitoring technique. | 89 (74.17) | 14 (11.67) | 17 (14.17) |
| 12. | Adoption of vaccination or immunization in aquaculture. | 57 (47.50) | 14 (11.67) | 49 (40.83) |
| 13. | Adoption of the recommended dose of manure and fertilizer. | 20 (16.67) | 66 (55) | 34 (28.33) |
| 14. | Maintaining records of aquaculture activities. | 80 (66.67) | 26 (21.67) | 14 (11.67) |
Table text extracted from the original PDF; superscript letters are shown inline. The original table image is below.
View original table image
| Sl. No | Attributes | Characteristics | Frequency | Percentage |
|---|---|---|---|---|
| 1 | Age | Young (Below 35 years) | 25 | 20.80 |
| Middle (36-55 years) | 45 | 37.53 | ||
| Old (Above 55 years) | 50 | 41.67 | ||
| 2 | Education | Illiterate | 3 | 2.50 |
| Can read and write | 16 | 13.33 | ||
| Primary School | 22 | 18.33 | ||
| Junior High School | 26 | 21.67 | ||
| Intermediate | 41 | 34.17 | ||
| Graduate and above | 12 | 10.00 | ||
| 3 | Occupation | Agriculture | 28 | 23.33 |
| Agriculture + Labour | 45 | 37.50 | ||
| Agriculture + Business | 38 | 31.67 | ||
| Agriculture + Service | 9 | 7.50 | ||
| 4 | Housing Pattern | Hut | 22 | 18.33 |
| Semi - Cemented | 91 | 75.84 | ||
| Cemented | 7 | 5.83 | ||
| 5 | Land holding | Up to 1 acre | 35 | 29.17 |
| 1-2 acres | 42 | 35.00 | ||
| Above 2 acres | 43 | 35.83 | ||
| 6 | Annual income | Upto Rs. 1,00,000 | 19 | 15.83 |
| Rs. 1,00,001 to Rs. 2,00,000 | 54 | 45.00 | ||
| Above Rs. 2,00,000 | 47 | 39.17 | ||
| Upto Rs. 1,00,000 | 19 | 15.83 | ||
| 7 | Mass media exposure | Low (8-10) | 32 | 26.67 |
| Medium (11-13) | 42 | 35.00 | ||
| High (14-16) | 46 | 38.33 | ||
| 8 | Sources of fish farming information | Low (15-17) | 32 | 26.67 |
| Medium (18-20) | 43 | 35.83 | ||
| High (21-23) | 45 | 37.50 | ||
| 9 | Innovativeness | Low (15-17) | 28 | 23.33 |
| Medium (18-21) | 43 | 35.84 | ||
| High (22-25) | 49 | 40.83 | ||
| 10 | Risk Orientation | Low (14-16) | 17 | 14.16 |
Table text extracted from the original PDF; superscript letters are shown inline. The original table image is below.
View original table image
Results and Discussion
Results and Discussion
Socio economic characteristics of the respondents
Socio economic characteristics of the respondents
Adoption of the respondents towards improved aquaculture practices
Adoption of the respondents towards improved aquaculture practices
Correlation between selected dependent variable with independent variables
Correlation between selected dependent variable with independent variables
Conclusion
It can be concluded that the socio-economic profile of the respondents, majority of the respondents are of old age (Above 55 years), most of the respondents has attained intermediate level of education, most of the respondents are engage in agriculture + labour, majority of the respondents have semi cemented housing pattern, most of the respondents have above 2 acres of land, most of respondent's income is between 1,00,001 to 2,00,000, 38.33 percent of the respondents have high level of mass media exposure and most of the respondents have high level of sources of fish farming information. The majority of the respondents had medium level category of overall adoption towards improved aquaculture practices of Rohu "Labeo rohita". The adoption of the farmers should be incorporate through various training with staffs from fisheries departments and frequent visit from extension representatives is also necessary. It was also revealed that all ten independent variables, i.e. Age, Education, Occupation, Housing Pattern, Land, Annual Income, Mass Media Exposure, Sources of fish farming information, Innovativeness and Risk Orientation are positively and significantly correlated with adoption of farmers towards improved aquaculture practices of Rohu "Labeo rohita".
Figures and tables from the paper
References
5 in the original paper- Devi T. Constraints Faced by the Farmers Adopting Paddy-Fish Farming System in Bishnupur District of Manipur. Indian Research Journal of Extension Education. 2023;23(1):75-79.
- Singh TM, Singh SG, Sharma A, et al. Self Sufficiency in Fish Production through Biofloc farming for Doubling the Small Holder Farmers' Income of Manipur-A case Study. Ama, Agricultural Mechanization in Asia, Africa & Latin America. 2022;53(5):7935-7940.
- Uttej D, Aluvala S, Savitha, Sagar G, Meena A, Rajani V, et al. Adoption of Scientific Practices in Fish Farming in Telangana State, India. International Journal of Environment and Climate Change. 2023;13(8):17331740.
- Wakkas SA, Haque MI, Mohammad AUD, Mohammad S, et al. Impacts of food and habitat on blood profile of rohu Labeo rohita (Hamilton, 1822). Asian Journal of Medical and Biological Research. 2023;9(2):23-29.
- Salam MA, Hussain SM, Oinam G, Debnath B. Perceived constraints of fish farmers in adoption of scientific fish farming in Manipur. Journal of Krishi Vigyan. 2020;9:231-235.