
Research article · 2023 · Full text
International Journal of Geography Geology and EnvironmentTrends of employment in Haryana in post reform period
Volume 5(1) · Pages 129–134 · DOI: 10.22271/27067483.2023.v5.i1b.150 ↗
Research areasSocial and Economic Development in IndiaIndian Economic and Social DevelopmentGlobal Health and Epidemiology
Abstract
Author-writtenThis paper provides an account of trends of employment in Haryana in post reforms period (1991) and corresponding changes in the pattern in 2011 with the analysis of census data of both periods. The efforts are made to know the threat and potential areas of development for the employment opportunities for workers. The main focus of the research work is to explore the causes of worker unemployment and the emerging trend of employment in the new sector of the economy. The paper finds out the impact of economic liberalization policies on the employment pattern in India and concludes that total work participation rate is declining due to increase of school going population, economic development and lack of formal employment opportunities in Haryana during 1991 and 2011. In this study, a question arises that a rational and sector specific analysis of worker participation is to be done and the required structural changes to be introduced to increase the overall worker participation ratio in the future in a changing global scenario.
Summary
Source-checkedPlain-language reading of the full paper, prepared with AI and checked against the text. Each point links to the authors' own words.
Why it matters
- India is primarily an agrarian nation with a significant portion of its population working in agriculture. View evidence ↗
- Economic reforms involving privatization, liberalization, and globalization have fundamentally altered India's labor market and industrial structure. View evidence ↗
- Post-reform policies favored the industrial sector over agriculture, leading to a net loss of capital and labor in the agricultural sector. View evidence ↗
The question
- The study aims to analyze employment trends and pattern changes in Haryana between 1991 and 2011 following economic reforms. View evidence ↗
- The research specifically seeks to evaluate how economic reforms impacted the quality of work and the work participation rate (WPR) in Haryana. View evidence ↗
What they did
- The author used Census of India B-Series tables as the primary data source for the years 1991 and 2011. View evidence ↗
- Work participation rate (WPR) is measured as the proportion of the population engaged in paid economic activities. View evidence ↗
- The study defines 'main workers' as individuals who are employed for more than 180 days per year. View evidence ↗
What they found
- Female workforce participation increased from 10.76% in 1991 to 17.79% in 2011, though it remained lower than male participation. View evidence ↗
- Increased work participation among urban children, urban elderly, and rural elderly women suggests rising economic distress in those households. View evidence ↗
- Female work participation was higher in western Haryana than eastern Haryana in 2001, attributed to lower agricultural productivity in the west. View evidence ↗
What it means
- The author concludes that while work participation increased, it was driven by low-paid, unorganized, and subsidiary work, while overall job quality declined. View evidence ↗
- The author attributes the decline in certain participation trends to a lack of formal employment opportunities and an increase in the school-going population. View evidence ↗
Figures & tables
From the original paper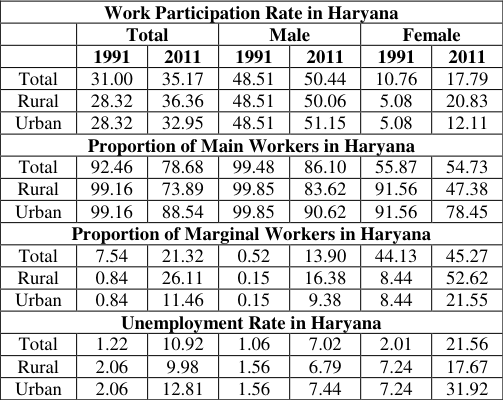 Table 1
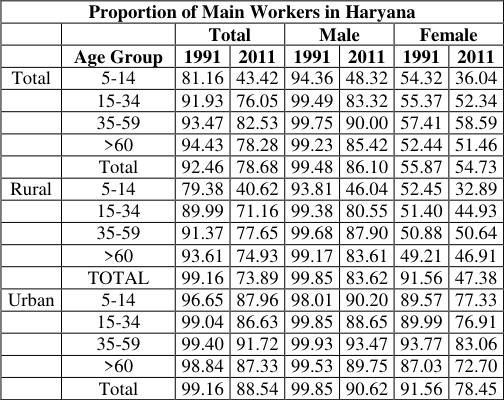 Table 2
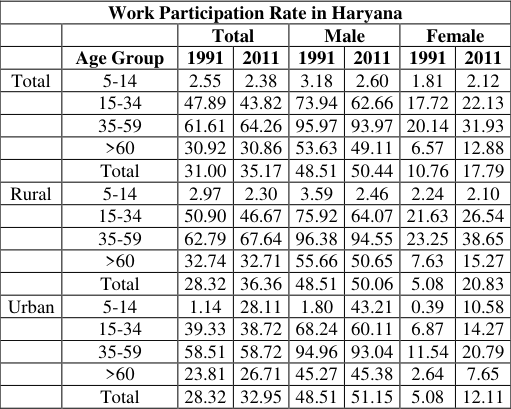 Table 3
Introduction
India is an agrarian country where a large number of people are engaged in agriculture. The Indian economy has experienced many upheavals after independence however the economic reforms are the most significant of them. These reforms brought privatization, liberalization and globalization in India which significantly changed its industrial landscape and labour market. The economic development of a country is primarily dependent upon the work participation in different economic activities comprising primary, secondary or territory sectors. The work participation rate is defined as the proportion of workers which are engaged in the paid economic activities. The proportional share of workers in various economic activities is affected by a number of factors such as literacy, household size, family structure, location and level and diversification of economic activities. The diversification of economic activities and abundant source of employment opportunities opened up in the economy in the post-reforms era (after 1991 liberalization period). The reforms included a large scale disinvestment tendencies, promotion of restriction free trade policies, and institutional development in financial and administrative areas. It was initiated by the government to promote the free flow of goods and services and large scale investment in sick and loss making units. The traditional and old fabric trade practices were dismantled and international standards and policies adopted in order to boost up economic development. The large-scale technological and scientific advancement introduced in the industrial and agriculture sector. The working nature of economic opportunities changed drastically and the shifting of workforce from the traditional sector of economy to emerging one was taken place. The economic activities like trade and commerce, manufacturing, transport and communication, value added trade practices received got more attention in the market. These changes in economic landscape brought significant changes in labour force structure and composition especially in the rural areas. The reforms brought hire and fire policies and compensated industrial sector at the cost of agricultural sector. Therefore, the agriculture sector experienced net outflow of labour and capital. However, the newly created jobs were unorganized, irregular and less paid. In the light of these changes, it is anticipated that the quality of work in the post-reform era may become degraded. Haryana state is one of the most important agricultural state of India where majority of people are engaged in agricultural activities. However, it has two large metropolitan cities in the National Capital Region of Delhi i.e. Gurugram and Faridabad.
These metropolitan cities emerged as the leading centres of economic growth in Haryana. Large industrial and service firms are located in this region demand highly skilled labour from rest of Haryana. The demand of the skilled labour promoted growth of engineering and management institutions in Haryana. These institutes provided education to the youth of Haryana and these youth entered nonagricultural activities. In this context, this paper aims to study the impact of economic reforms on the work participation rate and quality of work in Haryana.
Literature Review
The present research work mainly focuses upon the work participation rate and quality of work in Haryana during the post-reform period. In this context, the study done by Chadha and Sahu (1998) [3] also emphasized the post reforms scenario of work participation pattern and associated factors. The study refers to the structural changes that have occurred in employment opportunities in post reforms period and there has also been a consequential impact upon rural and urban workers throughout India irrespective of age and gender consideration. There was a setback to employment opportunities especially in the unorganized sector and other sectors also remain in fear of dearth of employment. In the same way, the other work related to the work participation rate of females in total work force has been done by Abraham (2013) [2] who deciphered the shifting trend of women from economic labour force to domestic work or their enrolment in education to empower themselves. The factors of withdrawal from the labour market may be due to numerous factors such as stigma associated with women to work done in the unorganized sector and they are looking for respectable and more remunerative job work mainly after attaining education. The different pattern of labour force participation of marginalized and landless workers may be noticed who have least scope of employment therefore they are engaged in low paid job work in order to support their family. The Report published by the Niti Aayog (2022) to show the structural changes occurred in the post-reform period. This report argues that the reforms produced the required employment opportunities in the nonagriculture sector and also enhanced the employment potential in the agricultural and non-agricultural sector.
In the present research paper, the author has discussed the trends of work participation rate in Haryana between 1991 and 2011. The paper also tries to understand the role of different variables associated with the trends of employment and unemployment.
Objectives This paper aims to analyse the trends of employment
and unemployment rate in Haryana between 1991 and 2001. Further this paper explores the causes of such trends. The time period has been specifically selected because the new economic policies were implemented in 1991 which changed the economic landscape of India. These policies impacted the nature of employment and unemployment in India.
Data Source
The Census of India B-Series tables has been used as the data source in the present paper for the periods 1991 and 2011.
State Level Situation of Labour Market in Haryana 5.1 Work Participation Rate
In the present research paper, it has been tried to find out the status of work participation in Haryana between 1991 and 2011 and factors working behind the change in the workforce pattern. The total work participation rate (WPR) in Haryana marginally increased in 2011 (35.17%) and total work participation rate of change was in rural workforce in 2011 (36.36%) and less workforce participation rate of change was in rural area in that period (32.95%). If we compare the male workforce data in the given table, it has been seen that there is no significant change in the workforce pattern in that period. The male participation is higher in the total workforce. Similarly, the total female workforce participation is lower and increased from 10.76% (1991) to 17.79% (2011). The employment rate marginally increased. The highest increase (20.83%) is among the rural female workforce and minimum is among the urban female 12.11%. The workforce scenario is highly skewed in the male and female counterparts and there are more employment opportunities available to male as compared to females in different sectors of the economy.
Quality of Work of Different Age Groups
The Table 5.21 shows us that there is an overall decline in the proportion of main workers in the total workforce in all age groups of male and female in 1991 and 2011. This is true for the rural as well as the urban areas. If we go deep into the data, it shows us that there is more decline in male proportion of main workers as compared to females in the total workforce. The rural proportion of main workers in Haryana, there is more decrease in male as compared to female and higher proportion of main workers seen among children approximately 47% (2011). There is a decreasing trend in the proportion of main workers in urban areas also.
There is a higher decrease in female proportion as compared to male population in urban workforce of main worker in 1991 and 2011.in the whole discussion, it points out that the proportion of main workers in the total workforce participation rate declines. It means that the work participation rate decreases and less working days are available to the workers. The people have scarce employment opportunities to earn their livelihood and economic distress is prevalent. The employment opportunities in different sectors of the economy are not adequate. 2011) which is very much higher. It means that there are very low levels of employment opportunities for female workers. The picture of unemployment rate in male workers is also not good, its rate has also increased approximately 10% (2011). the unemployment rate of workers in the total workforce has marginally increased approximately 7% (2011).it shows us that there are low levels of employment opportunities in urban and rural areas and its impact seems more on employment patterns in the post-reform period. it may be attributed to the factors that the traditional job work cannot create more avenues of employment.
Age Group Wise Work Participation Rate
Age Group Wise Work Participation Rate
District Level Analysis
The map 1 and 2 shows that there is a higher female work participation rate in western Haryana than the eastern Haryana in 2001 because this region is less fertile and has low agricultural productivity. The coarse grain and pulses are major crops of this region. In eastern Haryana, the agriculture is more developed and cash crops and commercial crops such as rice, wheat and sugarcane. The green revolution ushered prosperity here and migrant labour is a major chunk of the agricultural workforce. The eastern part of Haryana is a primarily immediate part of the Yamuna river floodplain. There is good network of canal and tube-well irrigation in this regions due to which agriculture is highly developed here. The local and land owners rarely do the work in the fields and migrant labour is hired for agriculture work. In the western part of Haryana, agriculture is less developed and irrigation coverage and availability is lesser than eastern Haryana therefore higher work participation rate may be seen in this region. In both the regions, one point is very much clear that in the eastern region, the agricultural and allied activities are more prominent as compared to the western part of Haryana.
Conclusion
In the present research, the trend of employment in Haryana in the post-reform period has been discussed. The total work participation rate of male and female workers in urban and rural areas has increased from 1991 to 2011 in contradiction with NSS survey data (2011). However, the increase of work participation can be attributed to proliferation of low paid, unorganized and subsidiary work. On the contrary the unemployment rate has also risen significantly because the quality of jobs available in the labour market is declining. This seems more like voluntary retirement. The evidence shows that the proportion of main workers has declined for male and female workers between 1991 and 2011 in rural as well as the urban area for all age groups. Further, the work participation rate of children and old people has increased significantly. This increase may be attributed to compulsion to take up marginal work due t to economic stress. The eastern and the western Haryana show significant differences in the work participation rate of women due to level of agricultural development. So, it seems that the female work participation rate has a negative relationship with the agricultural development.
Figures and tables from the paper
| Work Participation Rate in Haryana | — | — | — | — | — | — |
|---|---|---|---|---|---|---|
| Total | Male | Female | ||||
| 1991 | 2011 | 1991 | 2011 | 1991 | 2011 | |
| Total | 31.00 | 35.17 | 48.51 | 50.44 | 10.76 | 17.79 |
| Rural | 28.32 | 36.36 | 48.51 | 50.06 | 5.08 | 20.83 |
| Urban | 28.32 | 32.95 | 48.51 | 51.15 | 5.08 | 12.11 |
| Proportion of Main Workers in Haryana | ||||||
| Total | 92.46 | 78.68 | 99.48 | 86.10 | 55.87 | 54.73 |
| Rural | 99.16 | 73.89 | 99.85 | 83.62 | 91.56 | 47.38 |
| Urban | 99.16 | 88.54 | 99.85 | 90.62 | 91.56 | 78.45 |
| Proportion of Marginal Workers in Haryana | ||||||
| Total | 7.54 | 21.32 | 0.52 | 13.90 | 44.13 | 45.27 |
| Rural | 0.84 | 26.11 | 0.15 | 16.38 | 8.44 | 52.62 |
| Urban | 0.84 | 11.46 | 0.15 | 9.38 | 8.44 | 21.55 |
| Unemployment Rate in Haryana | ||||||
| Total | 1.22 | 10.92 | 1.06 | 7.02 | 2.01 | 21.56 |
| Rural | 2.06 | 9.98 | 1.56 | 6.79 | 7.24 | 17.67 |
| Urban | 2.06 | 12.81 | 1.56 | 7.44 | 7.24 | 31.92 |
Table text extracted from the original PDF; superscript letters are shown inline. The original table image is below.
View original table image
| Proportion of Main Workers in Haryana | — | — | — | — | — | — | — |
|---|---|---|---|---|---|---|---|
| Total | Male | Female | |||||
| Age Group | 1991 | 2011 | 1991 | 2011 | 1991 | 2011 | |
| Total | 5-14 | 81.16 | 43.42 | 94.36 | 48.32 | 54.32 | 36.04 |
| 15-34 | 91.93 | 76.05 | 99.49 | 83.32 | 55.37 | 52.34 | |
| 35-59 | 93.47 | 82.53 | 99.75 | 90.00 | 57.41 | 58.59 | |
| >60 | 94.43 | 78.28 | 99.23 | 85.42 | 52.44 | 51.46 | |
| Total | 92.46 | 78.68 | 99.48 | 86.10 | 55.87 | 54.73 | |
| Rural | 5-14 | 79.38 | 40.62 | 93.81 | 46.04 | 52.45 | 32.89 |
| 15-34 | 89.99 | 71.16 | 99.38 | 80.55 | 51.40 | 44.93 | |
| 35-59 | 91.37 | 77.65 | 99.68 | 87.90 | 50.88 | 50.64 | |
| >60 | 93.61 | 74.93 | 99.17 | 83.61 | 49.21 | 46.91 | |
| TOTAL | 99.16 | 73.89 | 99.85 | 83.62 | 91.56 | 47.38 | |
| Urban | 5-14 | 96.65 | 87.96 | 98.01 | 90.20 | 89.57 | 77.33 |
| 15-34 | 99.04 | 86.63 | 99.85 | 88.65 | 89.99 | 76.91 | |
| 35-59 | 99.40 | 91.72 | 99.93 | 93.47 | 93.77 | 83.06 | |
| >60 | 98.84 | 87.33 | 99.53 | 89.75 | 87.03 | 72.70 | |
| Total | 99.16 | 88.54 | 99.85 | 90.62 | 91.56 | 78.45 |
Table text extracted from the original PDF; superscript letters are shown inline. The original table image is below.
View original table image
| Work Participation Rate in Haryana | — | — | — | — | — | — | — |
|---|---|---|---|---|---|---|---|
| Total | Male | Female | |||||
| Age Group | 1991 | 2011 | 1991 | 2011 | 1991 | 2011 | |
| Total | 5-14 | 2.55 | 2.38 | 3.18 | 2.60 | 1.81 | 2.12 |
| 15-34 | 47.89 | 43.82 | 73.94 | 62.66 | 17.72 | 22.13 | |
| 35-59 | 61.61 | 64.26 | 95.97 | 93.97 | 20.14 | 31.93 | |
| >60 | 30.92 | 30.86 | 53.63 | 49.11 | 6.57 | 12.88 | |
| Total | 31.00 | 35.17 | 48.51 | 50.44 | 10.76 | 17.79 | |
| Rural | 5-14 | 2.97 | 2.30 | 3.59 | 2.46 | 2.24 | 2.10 |
| 15-34 | 50.90 | 46.67 | 75.92 | 64.07 | 21.63 | 26.54 | |
| 35-59 | 62.79 | 67.64 | 96.38 | 94.55 | 23.25 | 38.65 | |
| >60 | 32.74 | 32.71 | 55.66 | 50.65 | 7.63 | 15.27 | |
| Total | 28.32 | 36.36 | 48.51 | 50.06 | 5.08 | 20.83 | |
| Urban | 5-14 | 1.14 | 28.11 | 1.80 | 43.21 | 0.39 | 10.58 |
| 15-34 | 39.33 | 38.72 | 68.24 | 60.11 | 6.87 | 14.27 | |
| 35-59 | 58.51 | 58.72 | 94.96 | 93.04 | 11.54 | 20.79 | |
| >60 | 23.81 | 26.71 | 45.27 | 45.38 | 2.64 | 7.65 | |
| Total | 28.32 | 32.95 | 48.51 | 51.15 | 5.08 | 12.11 |
Table text extracted from the original PDF; superscript letters are shown inline. The original table image is below.
View original table image
References
5 in the original paper- Abraham V. Employment Growth in Rural India: Distress-Driven. Economic and Political Weekly. 2009;44(16):97-104.
- Abraham V. Missing Labour or Consistent DeFeminisation? Economic and Political Weekly. 2013;48(31):99-108.
- Chadha GK, Sahu PP. Post-Reform Setbacks in Rural. Economic & Political Weekly; c1998-2026.
- Chowdhury S. Employment in India: What does the latest data show?. Economic and Political Weekly. 2011;46(32):23-26.
- Deshpande S, Deshpande LK. New Economic Policy and Female Employment. Economic and Political Weekly. 1992;27(41):2248-2252.
Cited by 1
From OpenAlex, OpenCitations and reference lists read by Scinovex
- EMPLOYMENT STATUS AS PER PERIODIC LABOUR FORCE SURVEY IN HARYANA, INDIA ↗
Rakesh, Kiran Bala, Jaikishan Bhambhu · ShodhKosh Journal of Visual and Performing Arts · 2024
This study aims to depict numbers that speak for themselves about Haryana’s employment situation, highlighting the issue of the UR (unemployment rate), LFPR (labour force participation rate) and WPR (worker population ratio). This study is based on periodic labour force survey unit-level data from 2017-18 to 2022-23. This paper shows that Haryana's LFPR (for the overall population) is 35.3 percent,…
❝ 0PDF