
Research article · 2023 · Full text
International Journal of Geography Geology and EnvironmentEstimation of ice shelf front changes using MODIS data and statistical approach
Volume 5(1) · Pages 151–161 · DOI: 10.22271/27067483.2023.v5.i1b.156 ↗
Research areasCryospheric studies and observationsArctic and Antarctic ice dynamicsWinter Sports Injuries and Performance
Abstract
Author-writtenThe Ronne ice shelf (RIS) dynamics and mass balance play key role to decipher changes in the global climate scenario. The spatio-temporal changes in ice shelf extent of the RIS were studied by dividing the study area into three sectors (I, II, II) and further into a number of transects at 5 km uniform intervals using multi-dated Moderate Resolution Imaging Spectro-radiometer (MODIS) satellite data (2004–2019) of the austral summer months (January–March). The average of rates (AOR), end point rate (EPR), and linear regression (LR) methods were used to estimate the rate of change in RIS extent. Based on the analysis, Sector II shows prominent changes, hence further detailed study has been carried out in this sector. The study reveals that the RIS extent has been prograded at the rate of 11 km/year to 26 km/year in 2019 with maximum increase of 26 km at TR63. Based on all the three methods, ice shelf extent shows a progradation in almost all transects. The RIS bounded by Lassiter coast (LC) and Berkner Island (BI) recorded advancement in the ice shelf extents which is the feedback of morphological features like ice rise, small inlets along the ice shelf. The present study demonstrates that the combined use of satellite imagery and statistical techniques can be useful in quantifying ice shelf morphological variability.
Summary
Source-checkedPlain-language reading of the full paper, prepared with AI and checked against the text. Each point links to the authors' own words.
Why it matters
- Ice shelves are floating extensions of land ice that are critical for maintaining glacier stability and the overall mass balance of ice sheets. View evidence ↗
- Increased ocean heat flux can cause basal melting of ice shelves, which reduces the mass of the Antarctic ice sheet and contributes to rising sea levels. View evidence ↗
- The dynamics and mass balance of the Ronne Ice Shelf (RIS) are essential for understanding changes in the global climate. View evidence ↗
The question
- The study aimed to analyze the spatial and temporal changes in the extent of the Ronne Ice Shelf from 2004 to 2019. View evidence ↗
What they did
- Researchers used cloud-free MODIS satellite images from the austral summer (mid-February to early March) over a 16-year period (2004–2019). View evidence ↗
- The study area was divided into 150 transects at 5 km intervals, grouped into three sectors: Sector I (TR1-TR25), Sector II (TR26-TR91), and Sector III (TR92-TR150). View evidence ↗
- Three statistical methods, Average of Rates (AOR), End Point Rate (EPR), and Linear Regression (LR), were employed to estimate the rate of change in the ice shelf extent. View evidence ↗
What they found
- By 2019, the Ronne Ice Shelf extent prograded at a rate between 11 km/year and 26 km/year, with the maximum increase of 26 km occurring at transect TR63. View evidence ↗
- Net progradation was primarily observed in Sector II (TR26 to TR91), with rates ranging from 11,441.92 m/year to 18,161.13 m/year. View evidence ↗
- Linear Regression results for the full study period showed progradation rates in Sector II between 11.44 km/year at TR26 and 18.16 km/year at TR91. View evidence ↗
- In the initial period between 2004 and 2005, recession was more prevalent than progradation across the length of the ice shelf. View evidence ↗
What it means
- The authors conclude that there was an approximate 20 km increase in the Ronne Ice Shelf extent between 2004 and 2019. View evidence ↗
- The authors attribute the increase in the ice shelf extent primarily to high freezing rates and the nature of basal melting in the region. View evidence ↗
Visual summary
1 visualsIllustrations explain the paper; they do not show study data.
Study Area Segmentation
AI-generated conceptual illustration (Antarctic ice shelf coastline). It explains the idea and does not show study data.
View source evidence ↗Figures & tables
From the original paper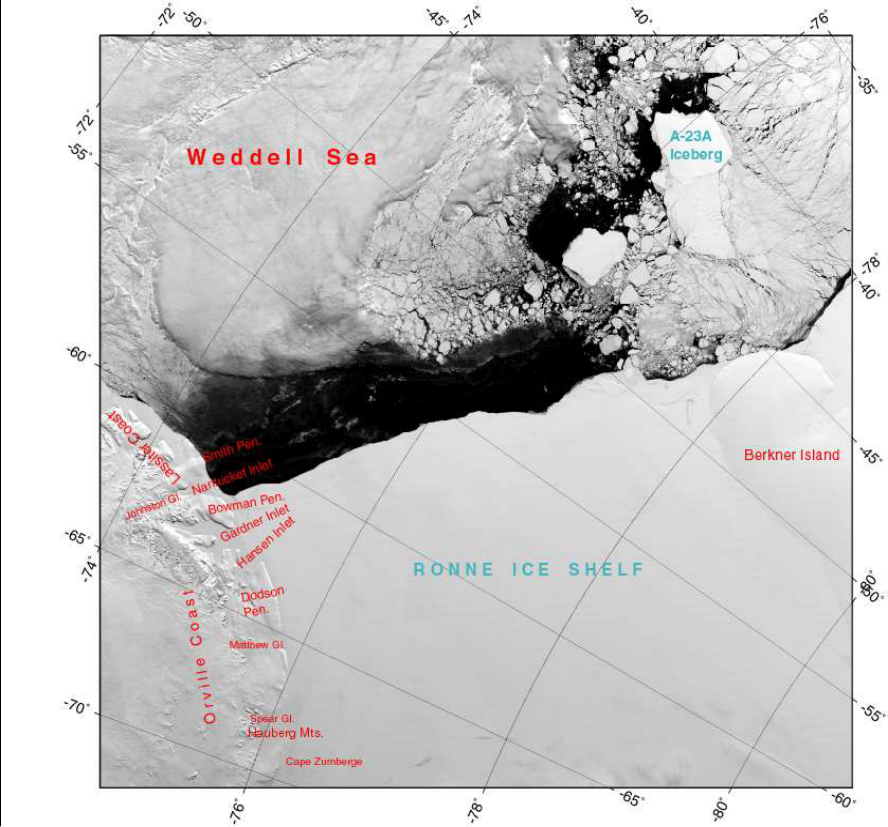 Figure 1
 Table 1
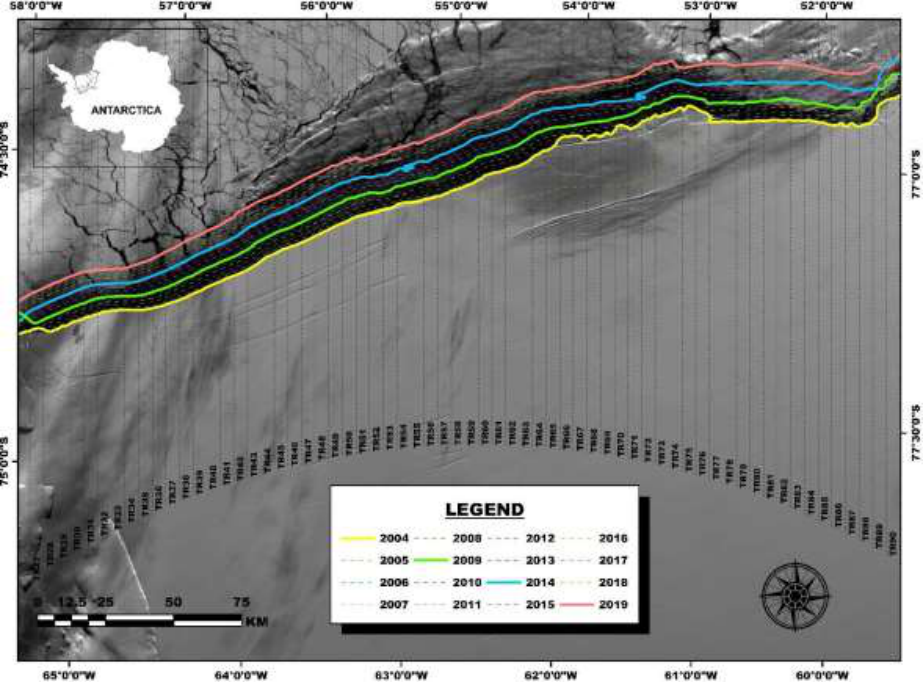 Figure 2
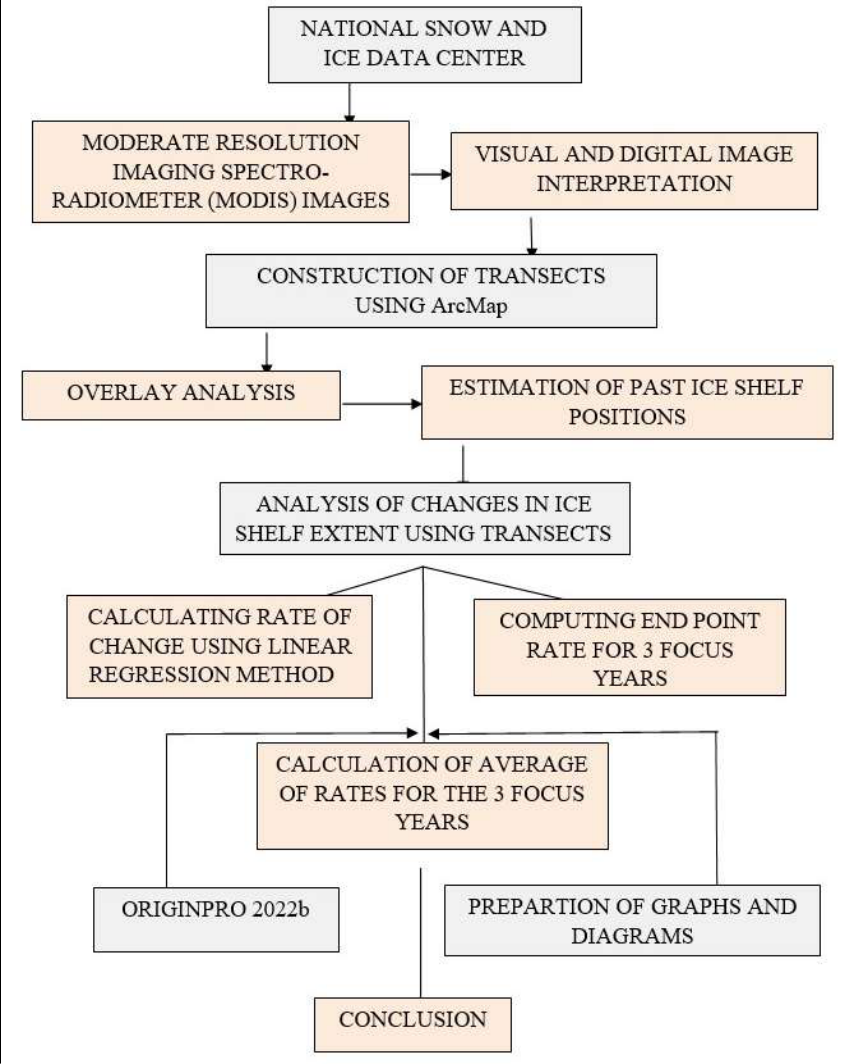 Figure 3
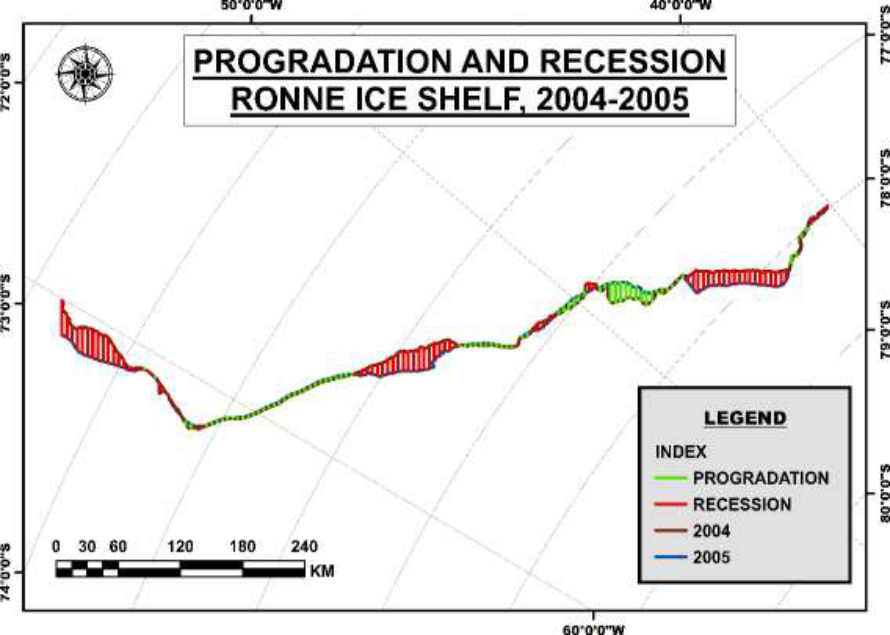 Figure 4
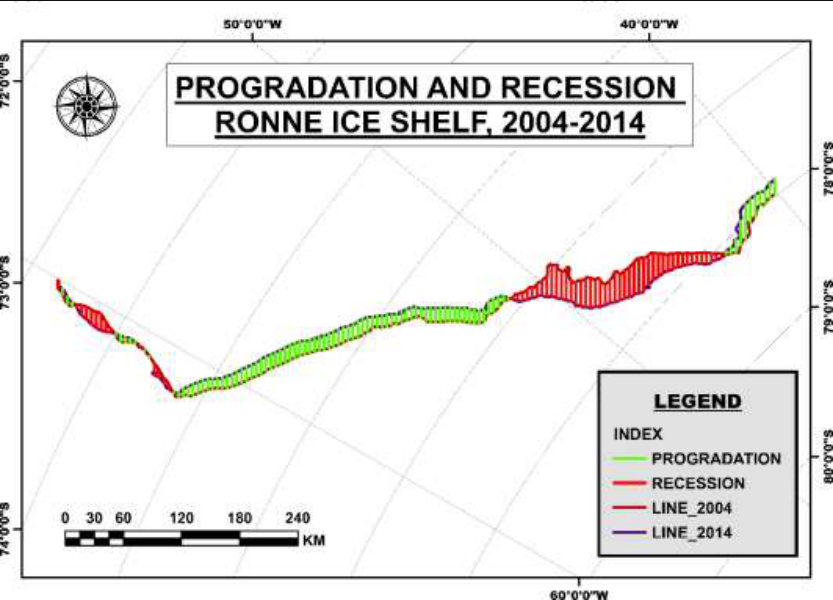 Figure 6
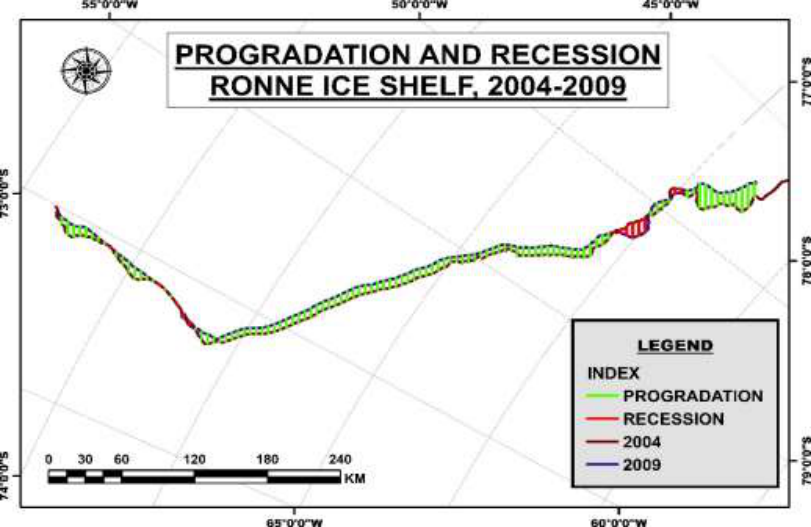 Figure 5
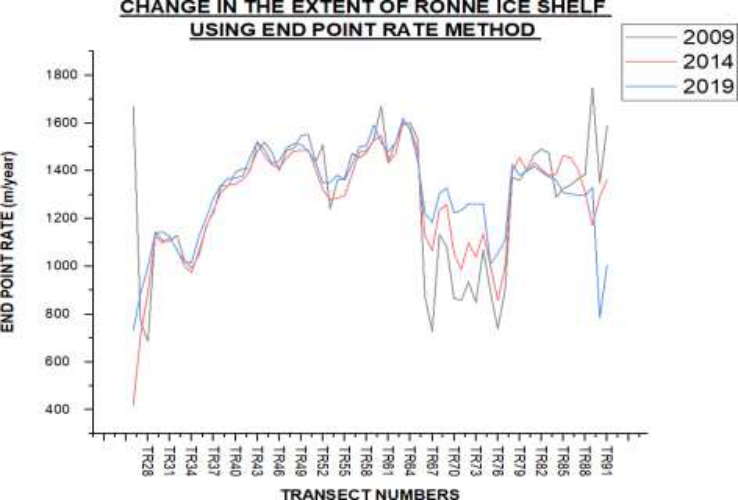 Figure 8
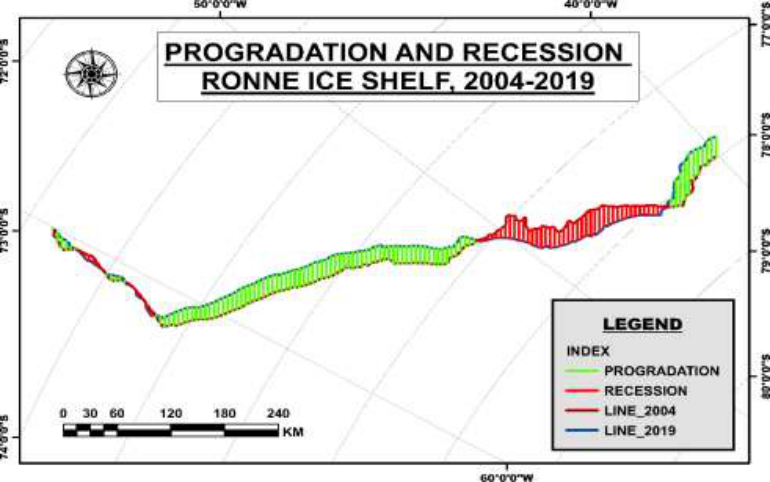 Figure 7
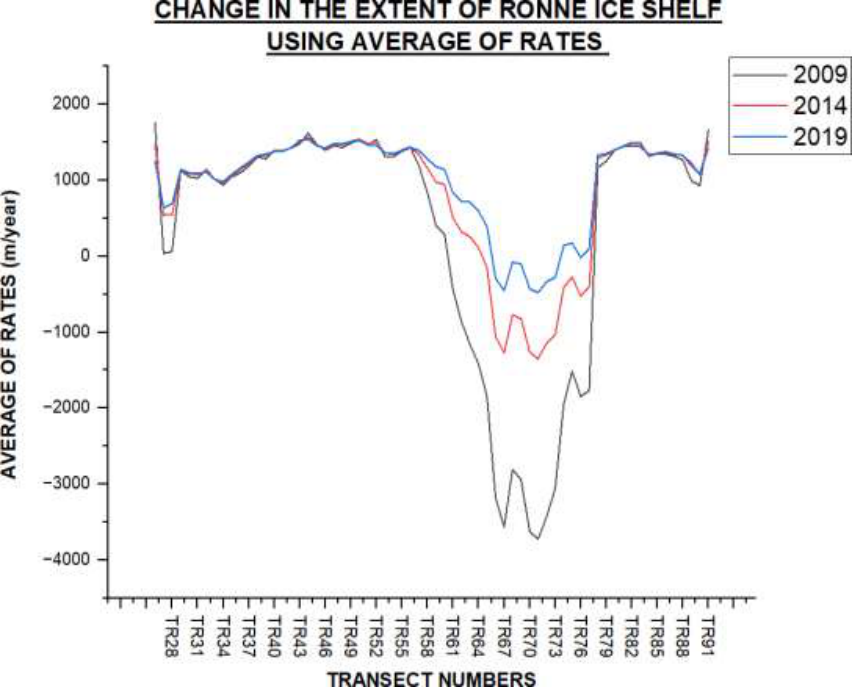 Figure 9
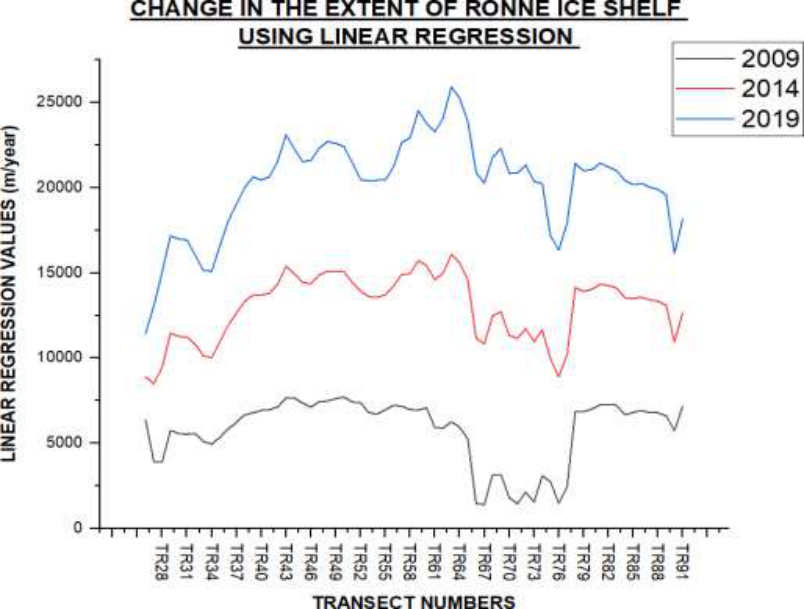 Figure 10
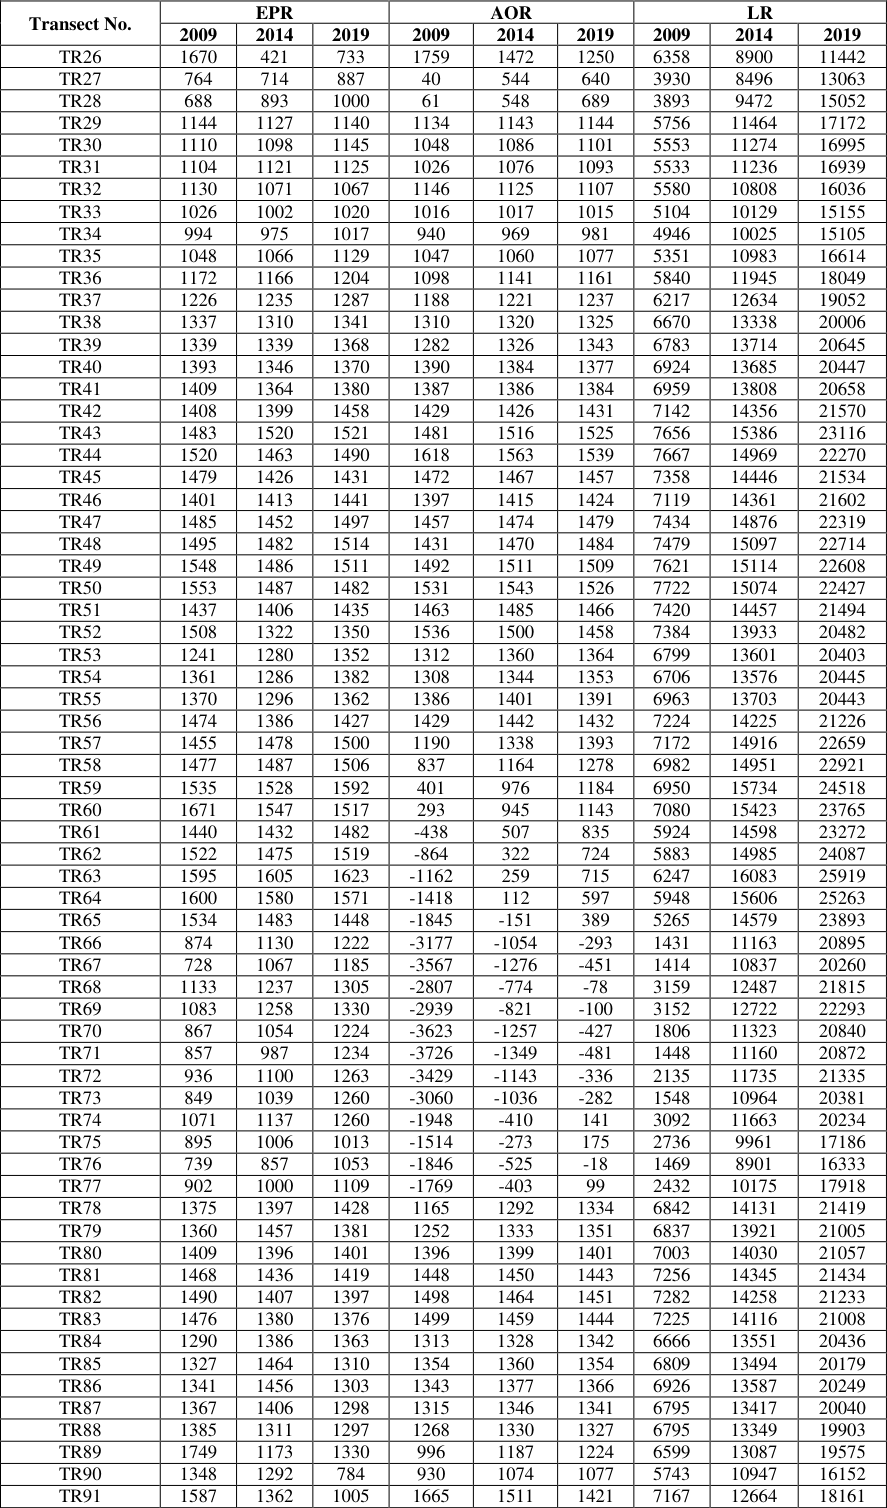 Table 2
Introduction
An ice shelf is defined as a floating extension of land ice that plays an important role in glacier stability, ice sheet mass balance, ocean stratification and bottom water formation, especially through latent and sensible heat processes (Rignot et al., 2013) [10] . The rate of change in ice shelves extent are controlled by the ocean-atmosphere temperatures adjacent to the ice shelves. An increase in ocean heat flux enhances the basal melting beneath ice shelves that leads to a loss of Antarctic ice sheet mass and contributes to sea-level rise. The continent of Antarctica is surrounded by ice shelves. These ice shelves cover more than 1.561 million km 2 (an area the size of Greenland), fringing about 75% of Antarctica's coastline, covering 11% of the total area and receiving 20% of its snow. The ocean cavities beneath the ice shelves provides a temperature gradient across the ocean cavity through the pressure dependence of the freezing temperature and insulates the ocean cavity from atmospheric forcing (Webber et al., 2017; Michael J M Williams et al., 2001) [15,17,18] . The ocean circulation under the ice shelf is strongly linked to the forcing provided by the ice shelf and the bathymetry (Williams et al., 2002) [19] . However, the presence of sea ice, indirectly modulates the stress on sea ice by reducing the amplitude of ocean swell (Thomson and Rogers, 2014) [13] , and the freezing atmospheric temperatures thereby promote the changes in ice shelf morphology. The rate of melting and freezing at the interface between the ice shelf and the ocean can be characterized by the magnitude of the interaction between the ice shelf and the ocean. Hence, during the melting processes, the top layer of water column is cooled and freshened that tends to grade the top of the water column; whereas during freezing processes salinity increases due to salt release which tends to drive the convective mixing (Wen et al., 2010; Michael J.M. Williams et al., 2001) [16,17,18] . There are several studies have been carried out to understand its dynamic characteristics, such as ocean circulation under ice shelves (Hellmer and Jacobs, 1992 [5,6,7,17,18] ; mapping the grounding zone (Fricker et al., 2009, 2002) [3,4] and ice sheet velocity (Joughin, 2002; King et al., 2007; Walker et al., 2015; Young and Hyland, 2002; Yu et al., 2010) [8,9,14,4,21] .
Study Area
Filchner-Ronne Ice Shelf is a large body of floating ice, that lies at the head of the Weddell Sea, that itself is an indentation in the Atlantic coastline of Antarctica. It covers more than 650 feet (200 m) thick and has an area of about 1,00,400 sq. miles (260,000 sq. km). The shelf extends inland on the eastern side of the Berkner Island that stretches for more than 250 miles (400 km) up to the escarpment of Pensacola Mountains. The name Filchner was originally given to the entire shelf that includes the larger area lying to the west of Berkner Island now called the Ronne Ice Shelf. The Ronne Ice Shelf (RIS) is the larger and western part of the Filchner-Ronne ice shelf. It is bounded by Lassiter Coast (LC) on the west near Antarctic Peninsula and Berkner Island (BI) in the east (Rignot and MacAyeal, 1989) [11] . The study area on the eastern flank of the calving front contains Hemmen ice rise (HIR) and part of Berkner Island (BI) which is the largest ice rise in Antarctica (Swithinbank et al., 2003) [12] The Ronne Ice Shelf, has been named after Edit Ronne, who was the first American woman to visit Antarctica. She sat on the Weddell Sea that lies just to the east of the Antarctic Peninsula and on the Transantarctic Mountains' rear slope. This huge ice shelf is the second largest in Antarctica and encompasses an area of about 1,70,660 sq. miles (422,000 sq. km). The Weddell Sea's deep blue water may be seen near the border of the ice sheet, while the remaining water is covered by floating ice. The stability of the ice sheet is significantly influenced by the sea ice that surrounds the large Antarctic ice shelves. According to studies, the amount of salt released during the creation of sea ice during the autumn and winter transforms the water around and below the Ronne Ice Shelf into a kind of protective sheath. This saline water, which has an average temperature of minus 2 °C, aids in protecting the ice shelf from the milder seas delivered by the Weddell Gyre.
Materials and Methods
The spatio-temporal changes in the Ronne Ice Shelf have been analysed using cloud-free cover visible range of Moderate Resolution Imaging Spectro-radiometer (MODIS) satellite images for a period of 16 years, i.e., 2004 to 2019. The images have been downloaded from the archives of National Snow and Ice Data Center (NSIDC) website. The study has been done using the images from the austral summer months (i.e., mid-February to early March). The study has been done during this period because the sea ice extent reaches its lowest with the annual ice shelf also being at its minimum extent. The images acquired from the www.nsidc.org have been projected on the Polar Stereographic projection in order to determine the major ice shelf areas and it extent over the years. The data information and specifications have been given in Table 1. The ice water lines in the images have been demarcated and digitized by means of visual and digital interpretation on the ArcMap software. The study area has been found to cover a stretch of approximately 970 km. This digitized length has been divided into 150 transects at a uniform interval of 5 km vertical to the base year of 2004. The transects have been constructed to find out the difference in the extent of the ice shelf of each year from the base year 2004. In order to understand the change better, the entire length has been divided into different sectors on the basis of the transects that have been drawn. The three sectors in which the area has been divided are: Sector I (TR1 to TR25), Sector II (TR26 to TR91) and Sector III (TR92 to TR150).
For better visualization and understanding of the changes in the ice shelf extent, the ice water line has been taken into consideration and digitized accurately. These vector layers have then been overlayed in order to detect the change better. The overlay analysis carried out on these layers have helped in estimating the amount of progradation and recession across the length of the ice shelf. However, the main focus has been kept on Sector II of the ice shelf, as maximum change has been observed in that region. To find out the rate of change, three methods have been followed: End Point Rate, Average of Rates and Linear Regression methods. The computation for these methods has been done on MS-Excel and values is mentioned in Table 2.
| Transect No. | EPR | — | — | AOR | — | — | LR | — | — |
|---|---|---|---|---|---|---|---|---|---|
| 2009 | 2014 | 2019 | 2009 | 2014 | 2019 | 2009 | 2014 | 2019 | |
| TR26 | 1670 | 421 | 733 | 1759 | 1472 | 1250 | 6358 | 8900 | 11442 |
| TR27 | 764 | 714 | 887 | 40 | 544 | 640 | 3930 | 8496 | 13063 |
| TR28 | 688 | 893 | 1000 | 61 | 548 | 689 | 3893 | 9472 | 15052 |
| TR29 | 1144 | 1127 | 1140 | 1134 | 1143 | 1144 | 5756 | 11464 | 17172 |
| TR30 | 1110 | 1098 | 1145 | 1048 | 1086 | 1101 | 5553 | 11274 | 16995 |
| TR31 | 1104 | 1121 | 1125 | 1026 | 1076 | 1093 | 5533 | 11236 | 16939 |
| TR32 | 1130 | 1071 | 1067 | 1146 | 1125 | 1107 | 5580 | 10808 | 16036 |
| TR33 | 1026 | 1002 | 1020 | 1016 | 1017 | 1015 | 5104 | 10129 | 15155 |
| TR34 | 994 | 975 | 1017 | 940 | 969 | 981 | 4946 | 10025 | 15105 |
| TR35 | 1048 | 1066 | 1129 | 1047 | 1060 | 1077 | 5351 | 10983 | 16614 |
| TR36 | 1172 | 1166 | 1204 | 1098 | 1141 | 1161 | 5840 | 11945 | 18049 |
| TR37 | 1226 | 1235 | 1287 | 1188 | 1221 | 1237 | 6217 | 12634 | 19052 |
| TR38 | 1337 | 1310 | 1341 | 1310 | 1320 | 1325 | 6670 | 13338 | 20006 |
| TR39 | 1339 | 1339 | 1368 | 1282 | 1326 | 1343 | 6783 | 13714 | 20645 |
| TR40 | 1393 | 1346 | 1370 | 1390 | 1384 | 1377 | 6924 | 13685 | 20447 |
| TR41 | 1409 | 1364 | 1380 | 1387 | 1386 | 1384 | 6959 | 13808 | 20658 |
| TR42 | 1408 | 1399 | 1458 | 1429 | 1426 | 1431 | 7142 | 14356 | 21570 |
| TR43 | 1483 | 1520 | 1521 | 1481 | 1516 | 1525 | 7656 | 15386 | 23116 |
| TR44 | 1520 | 1463 | 1490 | 1618 | 1563 | 1539 | 7667 | 14969 | 22270 |
| TR45 | 1479 | 1426 | 1431 | 1472 | 1467 | 1457 | 7358 | 14446 | 21534 |
| TR46 | 1401 | 1413 | 1441 | 1397 | 1415 | 1424 | 7119 | 14361 | 21602 |
| TR47 | 1485 | 1452 | 1497 | 1457 | 1474 | 1479 | 7434 | 14876 | 22319 |
| TR48 | 1495 | 1482 | 1514 | 1431 | 1470 | 1484 | 7479 | 15097 | 22714 |
| TR49 | 1548 | 1486 | 1511 | 1492 | 1511 | 1509 | 7621 | 15114 | 22608 |
| TR50 | 1553 | 1487 | 1482 | 1531 | 1543 | 1526 | 7722 | 15074 | 22427 |
| TR51 | 1437 | 1406 | 1435 | 1463 | 1485 | 1466 | 7420 | 14457 | 21494 |
| TR52 | 1508 | 1322 | 1350 | 1536 | 1500 | 1458 | 7384 | 13933 | 20482 |
| TR53 | 1241 | 1280 | 1352 | 1312 | 1360 | 1364 | 6799 | 13601 | 20403 |
| TR54 | 1361 | 1286 | 1382 | 1308 | 1344 | 1353 | 6706 | 13576 | 20445 |
| TR55 | 1370 | 1296 | 1362 | 1386 | 1401 | 1391 | 6963 | 13703 | 20443 |
| TR56 | 1474 | 1386 | 1427 | 1429 | 1442 | 1432 | 7224 | 14225 | 21226 |
| TR57 | 1455 | 1478 | 1500 | 1190 | 1338 | 1393 | 7172 | 14916 | 22659 |
| TR58 | 1477 | 1487 | 1506 | 837 | 1164 | 1278 | 6982 | 14951 | 22921 |
| TR59 | 1535 | 1528 | 1592 | 401 | 976 | 1184 | 6950 | 15734 | 24518 |
| TR60 | 1671 | 1547 | 1517 | 293 | 945 | 1143 | 7080 | 15423 | 23765 |
| TR61 | 1440 | 1432 | 1482 | -438 | 507 | 835 | 5924 | 14598 | 23272 |
| TR62 | 1522 | 1475 | 1519 | -864 | 322 | 724 | 5883 | 14985 | 24087 |
| TR63 | 1595 | 1605 | 1623 | -1162 | 259 | 715 | 6247 | 16083 | 25919 |
| TR64 | 1600 | 1580 | 1571 | -1418 | 112 | 597 | 5948 | 15606 | 25263 |
| TR65 | 1534 | 1483 | 1448 | -1845 | -151 | 389 | 5265 | 14579 | 23893 |
| TR66 | 874 | 1130 | 1222 | -3177 | -1054 | -293 | 1431 | 11163 | 20895 |
| TR67 | 728 | 1067 | 1185 | -3567 | -1276 | -451 | 1414 | 10837 | 20260 |
| TR68 | 1133 | 1237 | 1305 | -2807 | -774 | -78 | 3159 | 12487 | 21815 |
| TR69 | 1083 | 1258 | 1330 | -2939 | -821 | -100 | 3152 | 12722 | 22293 |
| TR70 | 867 | 1054 | 1224 | -3623 | -1257 | -427 | 1806 | 11323 | 20840 |
| TR71 | 857 | 987 | 1234 | -3726 | -1349 | -481 | 1448 | 11160 | 20872 |
| TR72 | 936 | 1100 | 1263 | -3429 | -1143 | -336 | 2135 | 11735 | 21335 |
| TR73 | 849 | 1039 | 1260 | -3060 | -1036 | -282 | 1548 | 10964 | 20381 |
| TR74 | 1071 | 1137 | 1260 | -1948 | -410 | 141 | 3092 | 11663 | 20234 |
| TR75 | 895 | 1006 | 1013 | -1514 | -273 | 175 | 2736 | 9961 | 17186 |
| TR76 | 739 | 857 | 1053 | -1846 | -525 | -18 | 1469 | 8901 | 16333 |
| TR77 | 902 | 1000 | 1109 | -1769 | -403 | 99 | 2432 | 10175 | 17918 |
| TR78 | 1375 | 1397 | 1428 | 1165 | 1292 | 1334 | 6842 | 14131 | 21419 |
| TR79 | 1360 | 1457 | 1381 | 1252 | 1333 | 1351 | 6837 | 13921 | 21005 |
| TR80 | 1409 | 1396 | 1401 | 1396 | 1399 | 1401 | 7003 | 14030 | 21057 |
| TR81 | 1468 | 1436 | 1419 | 1448 | 1450 | 1443 | 7256 | 14345 | 21434 |
| TR82 | 1490 | 1407 | 1397 | 1498 | 1464 | 1451 | 7282 | 14258 | 21233 |
| TR83 | 1476 | 1380 | 1376 | 1499 | 1459 | 1444 | 7225 | 14116 | 21008 |
| TR84 | 1290 | 1386 | 1363 | 1313 | 1328 | 1342 | 6666 | 13551 | 20436 |
| TR85 | 1327 | 1464 | 1310 | 1354 | 1360 | 1354 | 6809 | 13494 | 20179 |
| TR86 | 1341 | 1456 | 1303 | 1343 | 1377 | 1366 | 6926 | 13587 | 20249 |
| TR87 | 1367 | 1406 | 1298 | 1315 | 1346 | 1341 | 6795 | 13417 | 20040 |
| TR88 | 1385 | 1311 | 1297 | 1268 | 1330 | 1327 | 6795 | 13349 | 19903 |
| TR89 | 1749 | 1173 | 1330 | 996 | 1187 | 1224 | 6599 | 13087 | 19575 |
| TR90 | 1348 | 1292 | 784 | 930 | 1074 | 1077 | 5743 | 10947 | 16152 |
| TR91 | 1587 | 1362 | 1005 | 1665 | 1511 | 1421 | 7167 | 12664 | 18161 |
Table text extracted from the original PDF; superscript letters are shown inline. The original table image is below.
View original table image
The three methods used have been discussed in detail below 1. End Point Rate: Short term rates of ice shelf extent changes have been calculated for each transect using this method from the year 2005-2019. The end point rate is calculated by finding out the difference between two survey years (Fenster et al., 1993) [2] and dividing it by the time between the survey years which gives a result in metres per year. In this study the EPR has been calculated for each transect TR1 to TR91 from 2005 to 2019 though our focus has been Sector II of the ice shelf.
Average of Rates:
This is a widely used method for calculating the arithmetic mean of the rates. The result is obtained by dividing the total length of each transect divided by the number of years. In this study the AOR has been calculated for the focus years, 2009, 2014 and 2019 in order to find out the change at an interval of 5 years starting from the base year of 2004.
Linear regression:
This method is used for calculating long-term changes in the ice shelf extent in meters per year for each transect in the second sector using the slope calculated in the MS Excel (Allan et al., 2003) [1] . The formula used for this method is:
where, y denotes the location of the ice shelf, x is the year for which the linear regression is being calculated date, c is the intercept, and m is the rate at which the ice shelf.
Results
In order to understand the change in the pattern of the ice shelf extent morphology various methods have been followed. The change has been studied by using overlay analysis of the digitized ice water lines at an interval of 5 years for 3 different time periods (i. As observed from the given map, a major part of the beginning of the ice shelf from TR1 to TR16 has shown recession, followed by TR20 to TR23, TR58 to TR77 and finally at the end of the ice shelf from TR122 to almost the end of the ice shelf. Only a visible portion of the ice shelf from TR30 to TR57 has shown progradation followed by TR78 to TR91. It should be noted that with a rise in the effect of global warming, it is quite natural that ice shelves are shrinking due to the rise in temperature which has resulted in its melting, thereby affecting a rise in the sea levels for which these ice shelves are a source of water. The computed results using the EPR method shows a noticeable change from -32.77 km/year at TR1 to 21.34 km/year at TR91. It must also be noted that the computed values prove that there has not been much of recession of the ice shelf due to the reasons discussed above during the year 2004-2005. As observed from the computed results, TR1 to TR116 has shown progradation, the highest being 21.27 km/year at TR114. It has also been found that the computed results from the EPR method have shown a drastic change from -0.013 km/year at TR1 to 1.587 km/year at TR91. Hence, it can be said that there has been major progradation observed by means of the digitised results cross validated by applying the EPR method as well. The Linear Regression method shows a major change in the rate from 6.36 km/year at TR26 to 7.17 km/year at TR91. A major difference has been sited between the year 2004-2014 wherein most parts of the ice shelf extent has shown progradation in the western part, with a considerable portion also depicting recession. This has been observed primarily in the eastern parts of the ice shelf wherein the ice shelf has gone through a stage of melting that has resulted in its depletion and has further contributed to a sea level rise in the surrounding areas.
The digitised results show that TR26 to TR94 has shown an increase in the ice shelf which is an outcome of the basal melting point being low and the freezing rates being high.
The computed results from the different methods further prove that the ice shelf has undergone a net progradation ranging from -0.71 km/year at TR1 to 1.36 km/year at TR91. It has also been found that the Linear Regression method shows a rate of change 8.899 km/year at TR26 to 12.66 km/year at TR91, which is the second sector, that shows a major progradation across all the years. Hence, it can be said that the Ronne Ice Shelf has primarily undergone progradation at a wide range and shown an increase resulting out of the high freezing rates of the bottom ice waters and also due to the basal melting point being low and ineffective compared to the freezing of the waters. Figure 7 represents the extent of Ronne Ice Shelf using the End point rate method. This graph represents three focus years that is 2009, 2014 and 2019 which has been prepared for Sector II that is from TR26 to TR91. This section has been particularly selected because it showed the maximum variation in the ice water lines which could be attributed to bathymetric changes and climate change. It can be observed from the graph that the initial transects that is from TR26 to TR46 almost have identical values that range from 1.1 km/year to 1.4 km/year. After this section we can see slight variations from TR46 to TR64 which alternated in a range from 1.35 km/year to 1.4 km/year. The maximum variation has been observed from TR46 to TR91 where the values are dipping to a great extent that is from 1.3 km/year to 0.7 km/year and there is sudden rise in the value to 1.7 km/year.
From the overall graph we can say that the year 2009 has shown a significant amount of variation compared to the years of 2014 and 2019
Discussion
The visible range of MODIS satellite images have been used to analyse the changes occurring in the extent of the Ronne Ice Shelf using the End Point Rate, Average of Rates and Linear Regression techniques. The impact of the oceanclimate forcing on the ice shelf has been an important factor that has been investigated taking its linkages with the ice shelf during the austral summer months, mid-February to early March. In order to understand the advancement in the Ronne Ice Shelf since 2004, the relation lying between the ice-mass change and the ocean atmosphere temperature have been investigated carefully. The significant role of the melting and freezing of ice sheets has also been taken into account.
The process of melting of the ice shelves leads to the stratification of the water column due to the top layer cooling and freezing which results in the release salt in the water. The process of ocean circulation underneath the ice shelves are also responsible for the formation of a marine ice layer. Hence, it has been observed that there has been major increase in the ice shelves in the past 15 years. The rate of recession that has taken place accounts to the effects of rise in temperatures in those areas that has affected the melting of the ice shelves and contributed to the rise in the water levels in the surrounding areas thus resulting in a change in the world climate as a whole.
Conclusion
This study has revealed that the MODIS satellite images that have been collected for the austral summer months have recorded net progradation or a significant increase in the extent of the Ronne Ice Shelf extent which may be due to ice rise in the eastern side. The change has mainly been observed in the Sector II of the ice shelf from TR26 to TR91, wherein the ice shelves have mostly shown progradation across all the years from 2004 to 2019. Computed results have shown that there has been approximately 20 km increase in the ice shelf between the base year 2004 and the final year 2019 of the concerned period of study. The past ice shelves have also shown recession in a few transects which also helps us understand that the effect of climate change has affected the ice shelves and caused a retreat, due to which there has been an overall rise in the sea level. The factors contributing to the increase in the ice shelves are mainly the basal melting and high freezing rates in that region. It can be said that any notable change in the sea-ice extent of this region is responsible for affecting the global climate as it accounts for a considerable part of the ice shelves of Antarctica. Since, this ice shelf is the second largest in the continent, it is important for us to employ measures that will help in keeping the ice shelves intact and studies should be conducted in order to understand the changes taking place in this region.
Figures and tables from the paper
References
20 in the original paper- Allan JC, Komar PD, Priest GR. Shoreline Variability on the High-Energy Oregon Coast and its Usefulness in Erosion-Hazard Assessments. Journal of Coastal Research. 2003;19(1):83-105.
- Fenster MS, Dolan R, Elder JF. A new method for predicting shoreline positions from historical data. Journal of Coastal Research. 1993;9(2):147-171.
- Fricker HA, Coleman R, Padman L, Scambos TA, Bohlander J, Brunt KM. Mapping the grounding zone of the Amery Ice Shelf, East Antarctica using InSAR, MODIS and ICESat. Antarctic Science. 2009;21(5):515-532.
- Fricker HA, Young NW, Allison I, Coleman R. Iceberg calving from the Amery Ice Shelf, East Antarctica. Annals of Glaciology. 2002;34(1):241-246.
- Hellmer HH, Jacobs SS. Ocean interactions with the base of Amery Ice Shelf, Antarctica. Journal of Geophysical Research. 1992;97(20):305-320.
- Herraiz-Borreguero L, Coleman R, Allison I, Rintoul SR, Craven M, Williams GD. Circulation of modified Circumpolar Deep Water and basal melt beneath the Amery Ice Shelf, East Antarctica. Journal of Geophysical Research: Oceans. 2015;120(4):30983112.
- Holland PR, Jenkins A, Holland DM. The response of Ice shelf basal melting to variations in ocean temperature. Journal of Climate. 2008;21(11):25582572.
- Joughin I. Ice-sheet velocity mapping: A combined interferometric and speckle-tracking approach. Annals of Glaciology. 2002;34:195-201.
- King MA, Coleman R, Morgan PJ, Hurd RS. Velocity change of the Amery Ice Shelf, East Antarctica, during the period 1968-1999. Journal of Geophysical Research: Earth Surface. 2007;112(F1):1-11.
- Rignot E, Jacobs S, Mouginot J, Scheuchl B. Ice Shelf Melting Around Antarctica. Science. 2013 Jul 19;341(6143):266-270.
- Rignot E, MacAyeal DR. Ice-shelf dynatnics near the front of the Filchner-Ronne Ice Shelf, Antarctica, revealed by SAR inter ferotnetry. Journal of Glaciology. 1998 Jan;44(147):405-418.
- Swithinbank C, Jr, RSW, Ferrigno JG, Foley KM, Rosanova CE. Coastal-change and glaciological map of the Bakutis Coast, Antarctica; c2003. p. 1972-2002. IMAP.
- Thomson J, Rogers WE. Swell and sea in the emerging Arctic Ocean. Geophysical Research Letters. 2014;41(9):3136-3140.
- Walker CC, Bassis JN, Fricker HA, Czerwinski RJ. Observations of interannual and spatial variability in rift propagation in the Amery Ice Shelf, Antarctica, 2002-14. Journal of Glaciology. 2015;61(226):243252.
- Webber BGM, Heywood KJ, Stevens DP, Dutrieux P, Abrahamsen EP, Jenkins A, et al. Mechanisms driving variability in the ocean forcing of Pine Island Glacier. Nature Communications 2017;8(1):1-8.
- Wen J, Wang Y, Wang W, Jezek KC, Liu H, Allison I. Basal melting and freezing under the Amery Ice Shelf, East Antarctica. Journal of Glaciology. 2010;56(195):81-90.
- Williams, Michael JM, Grosfeld K, Warner RC, Gerdes R, Determann J. Ocean circulation and ice-ocean interaction beneath the Amery Ice Shelf, Antarctica. Journal of Geophysical Research: Oceans. 2001;106(C10):22383-22399.
- Williams MJM, Warner RC, Budd WF. Sensitivity of the Amery Ice Shelf, Antarctica, to changes in the climate of the southern ocean. Journal of Climate. 2002;15(19):2740-2757.
- Young NW, Hyland G. Velocity and strain rates derived from In SAR analysis over the Amery Ice Shelf, East Antarctica. Annals of Glaciology. 2002;34:228-234.
- Yu J, Liu H, Jezek KC, Warner RC, Wen J. Analysis of velocity field, mass balance, and basal melt of the Lambert glacier-amery ice shelf system by incorporating Radarsat SAR interferometry and ICE Sat laser altimetry measurements. Journal of Geophysical Research: Solid Earth. 2010;115(B11):1-16.