
Research article · 2023 · Full text
International Journal of Geography Geology and EnvironmentStudy geotechnical properties for deposits in Dabas region ∕northwest Kirkuk for purpose brick manufacturing
Volume 5(1) · Pages 162–167 · DOI: 10.22271/27067483.2023.v5.i1b.157 ↗
Research areasGeotechnical and Geomechanical EngineeringMining and Gasification TechnologiesRock Mechanics and Modeling
Abstract
Author-writtenIn view of the need of Kirkuk Governorate to manufacture bricks from clays, this study relied on the clays of the Anjanah Formation in the Dibs area to study the ability of these clays from a physical point of view to produce building bricks. The granular volume of the models consists mainly of granules of the sizes of clay and silt, and a small percentage of the sizes of sand, which is a silty clay soil, as it showed an increase in the percentage of clay over the components of silt and sand in the studied models, as the percentage of clay reached (49.75%), silt at a rate of (42.5%) and sand (7.75%), The results were classified according to Picard's chart, showing that it is located within the clayey silt field, and this indicates an increase in the ability to form the prepared dough for making bricks. And the results of the specific weight ranged between (2.71 -2.75) at a rate of (2.73). It was projected on the plasticity diagram, where the data of the results of this study showed the validity of these clays in the brick industry.
Summary
Source-checkedPlain-language reading of the full paper, prepared with AI and checked against the text. Each point links to the authors' own words.
Why it matters
- Clay serves as the primary raw material for various construction industries, particularly in the production of bricks. View evidence ↗
- Geotechnical properties are critical for determining if a material is feasible and suitable for use in the brick industry. View evidence ↗
- Understanding the geotechnical properties of deposits helps predict and prevent potential structural problems in buildings. View evidence ↗
The question
- The study aimed to determine if clays from the Anjanah Formation in the Dibs area are suitable for brick manufacturing and construction investment. View evidence ↗
What they did
- The research was conducted in a study area located 32 km northwest of Kirkuk city. View evidence ↗
- Four different soil samples were selected for analysis. View evidence ↗
- Laboratory tests were performed following the American Standard for Testing Materials (ASTM) guidelines. View evidence ↗
- The study measured index properties, including specific weight, plasticity, and granular volumetric gradient. View evidence ↗
What they found
- The average composition of the studied models consisted of 49.75% clay, 42.5% silt, and 7.75% sand. View evidence ↗
- Based on Picard's chart, the soil is classified as being within the clayey silt field. View evidence ↗
- The specific weight of the Dibs models ranged from 2.71 to 2.75, with an average of 2.73. View evidence ↗
- Using the Unified Soil Classification System (USCS), the models were classified as medium-plastic (CL). View evidence ↗
- The study found that a higher ratio of clay relative to other components correlates with a higher specific weight. View evidence ↗
- A direct relationship was observed between fine particle size and plasticity, where higher fine particle content led to higher plasticity. View evidence ↗
What it means
- The authors conclude that the clays from the studied area are valid for use in the brick industry. View evidence ↗
- The authors state that the soil's composition of primarily clay and silt provides the necessary plasticity and flexibility for brick manufacturing. View evidence ↗
Visual summary
3 visualsIllustrations explain the paper; charts are replotted from the paper's own table values.
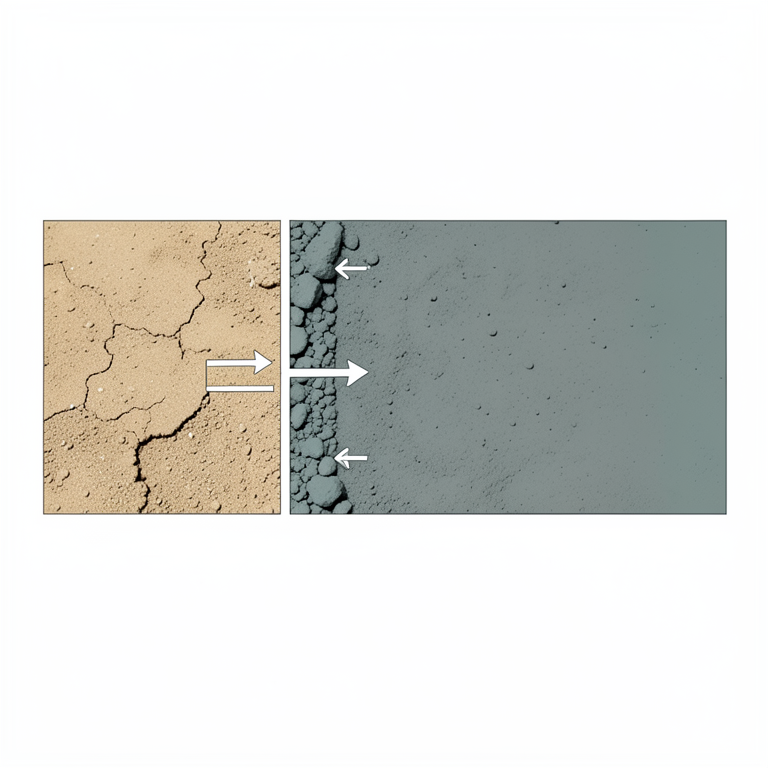
Relationship between Soil Components and Properties
AI-generated conceptual illustration (soil deposits from the Dabas region of northwest Kirkuk). It explains the idea and does not show study data.
View source evidence ↗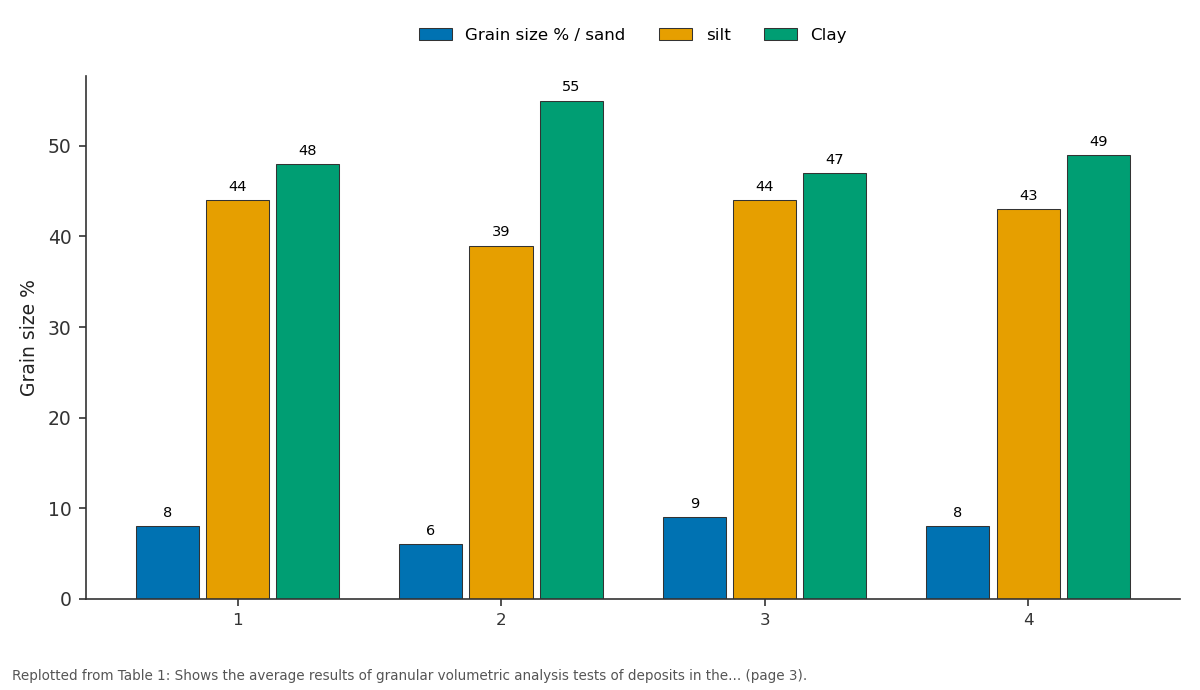
Grain size % / sand and silt and more: 1 vs 2 vs 3 vs 4
Replotted from Table 1 (page 3) of the original paper. Every bar is the paper's own table value.
View source evidence ↗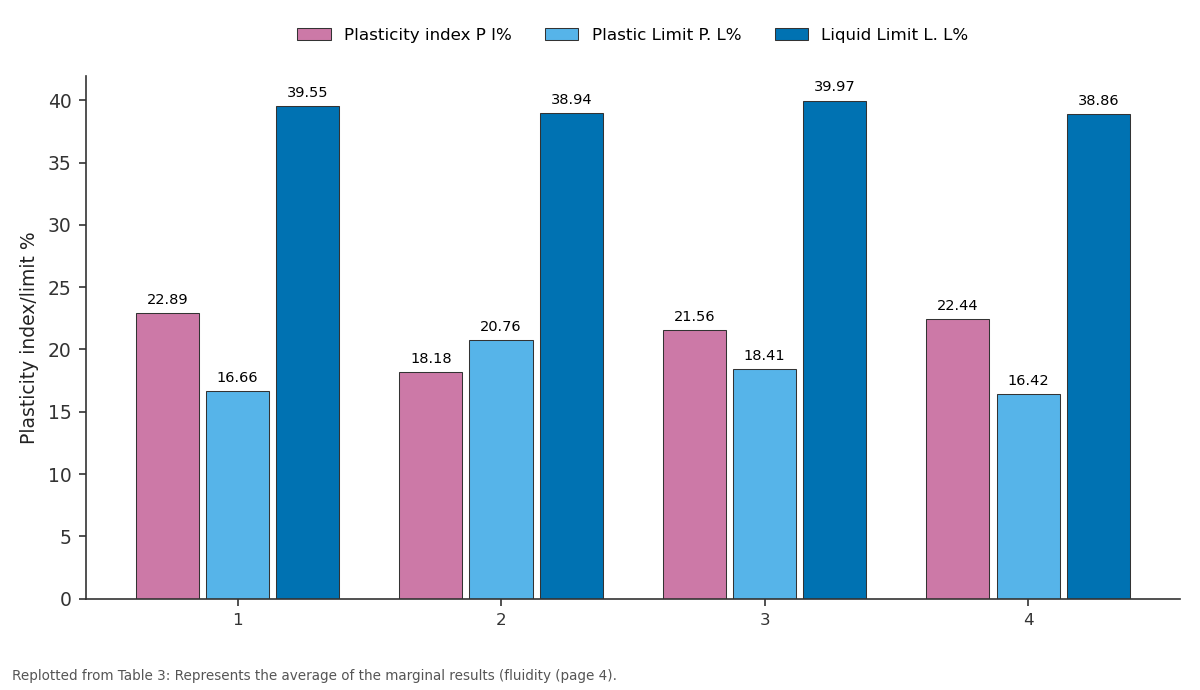
Plasticity index P I% and Plastic Limit P. L% and more: 1 vs 2 vs 3 vs 4
Replotted from Table 3 (page 4) of the original paper. Every bar is the paper's own table value.
View source evidence ↗Figures & tables
From the original paper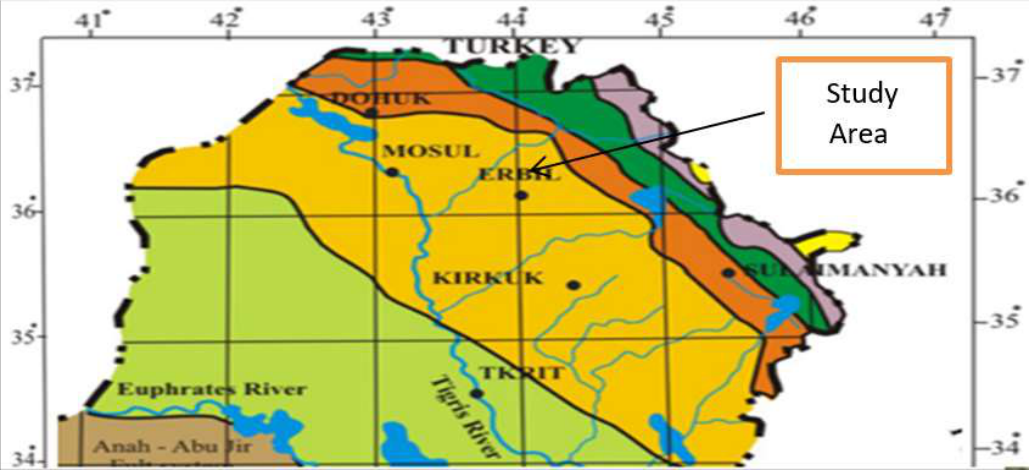 Figure 1
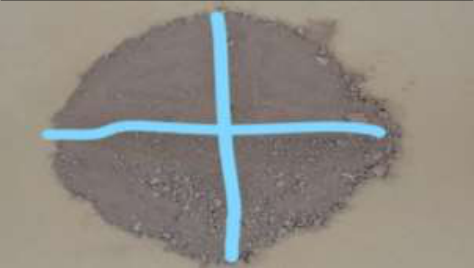 Plate 1
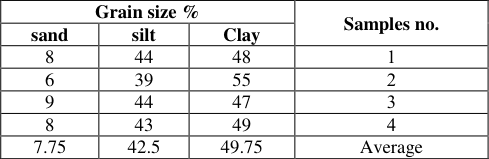 Table 1
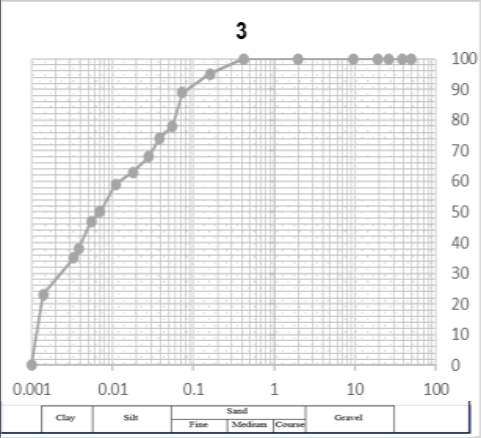 Figure 2
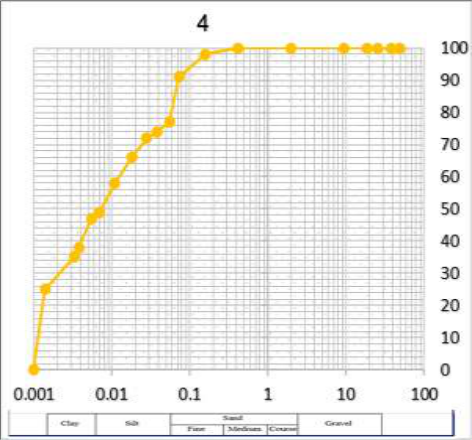 Figure 2
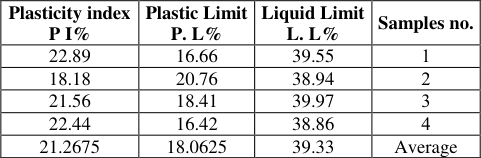 Table 3
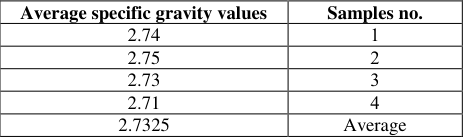 Table 2
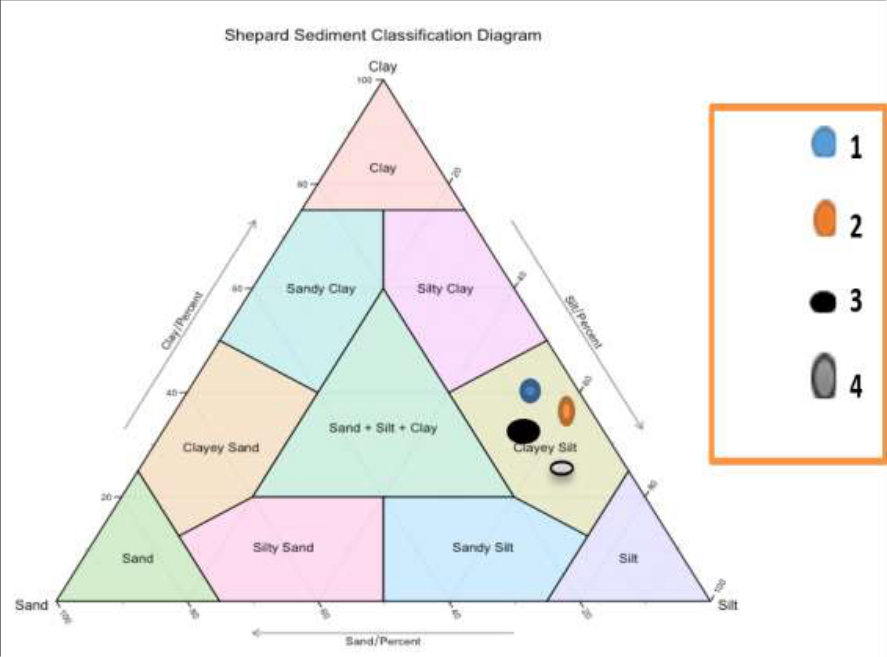 Figure 3
Introduction
Clay is the main raw material in many construction industries, especially in the field of bricks industry (Al-Shafei, 1985) [1] , and (Al-Qasabi, 1993) [2] . Where geotechnical studies deal with a wide spectrum of ground materials (soils and/or rocks), as geotechnical properties are the main factor in evaluating the feasibility and importance of the brick industry. As knowing the geotechnical properties of deposits is necessary when using them in the brick industry because of their important role in predicting and avoiding many problems that occur in buildings (Nwankwaola and Warmate 2014) [4] , and as a result of the increase in urban works and the development taking place in construction work in the world, the need to identify The nature of the soil and its geotechnical properties that help in the design process before starting implementation (Al-Taraf, 2013) [17] .
Location
The study area is located northwest of the city of Kirkuk, 32 km between the two lines of longitude (44° 5' 40''-44° 3' 30.9'') to the west and latitude (35° 8' 1`0.4''-35° 9' 20.4'') to the north. The area of Kirkuk governorate is about (2000) km north-east of Iraq and about (225) km from the capital, Baghdad. Where four different soil samples were chosen, Figure 1. Which shows a site map showing the study area.
Aims of the study
The current study aimed at the following points: 1. Finding new sites with an abundance of clays and evaluating their geotechnical properties. 2. Indication of the suitability of the clays for the Dibs area belonging to the Anjanah Formation for the purposes of making bricks and the possibility of investing them in construction projects.
Stratigraphy of study area Stratigraphy
The stratification of the study area was described by (Buday 1980) [6] , (Jassim and Goff 2006) [7] , (Sissakian, 1992) [8] , where the layers that unfold in Kirkuk / Iraq date back to the Cenozoic Era, consisting of sedimentary rocks and clastic rocks represented by Limestone, Gypsum, Sandstone, Claystone, Siltstone and Salt. As for igneous rocks, they are not found in this region of Iraq (Buday 1980) [6] . In the two study areas, four important geological formations within the Cenozoic Era are unfolding, which include the Fatha Formation, Injana, Mukdadiya, and Bai Hassan, in addition to the recent deposits (Jassim and Goff 2006) [7] .
Working methods
The laboratory work included many tests that were conducted in the construction laboratories in Kirkuk, for the purpose of knowing the validity of these clays in the manufacture of bricks, where the examination sample is taken from the original laboratory model using manual quarter division, and the model was divided by quadruple division into two equal parts after that It is divided into four identical sections, and the two opposite parts are taken from the form, provided that the sample is in a dry state by drying it at room temperature or using an electric oven (105 m), plate 1.
Plate 1: Preparing forms for laboratory tests using the quartile method
Plate 1: Preparing forms for laboratory tests using the quartile method
Results and Discussion
The properties that were studied included the following:
lndex Properties These are the characteristics that represent the essential and indicative properties, which are considered like a fingerprint to identify the mud in each site and study, which include (granular volumetric gradient, plasticity properties, specific weight, and compression test (great dry density and optimal moisture content). The tests were conducted according to the American Standard for Testing Materials-ASTM). They are as follows:-
Particle size analysis
It is considered one of the basic geotechnical properties that represent one of the most important characteristics (lndex properties), to identify the type and nature of the soil and the granular sizes that make up the soil of any area and the proportions of those granular sizes in the soil (Al-Mallah, 2014) [9] . There are two methods for determining the grain size of the soil, which were conducted according to the American Standard Specifications (ASTM) in the Kirkuk Structural Laboratory, and they include the following:
Sieve Analysis (Dry Method)
The sieve analysis test is used to calculate the granular size of coarse soil with diameters greater than (0.075) mm, which includes gravel and sand, and the examination was carried out according to the American Standard (ASTM-D, 421, 2004).
Wet Analysis (Hydrometer).
Wet analysis is used for fine soils whose diameter is less than (0.075) mm, which pass through sieve No. 200 (Ali et al., 1991) [10] . The examination was conducted for soil samples in the construction laboratory in Kirkuk and based on the American standard (ASTM, D-422, 2004) [12] in order to find the percentage of the weight of the different sizes of the soil sample, where the granular volumetric analysis of soil is the basis for soil classification. After conducting the sieve analysis and hydrometric analysis tests, and merging the results of these two tests into one curve, drawing the particle diameters (mm) on a horizontal logarithmic scale and the percentage of sediment passing through (%) from each sieve on a vertical numerical scale. As shown in the figure below 2. which represent curves of the average values of the granular volumetric gradient taken from the region, in which the tables for the results of the granular volumetric analysis were adopted as in Table 1. Where from the grainy gradient curve the proportions of sand grains were obtained Clay and silt.
| Grain size % | — | — | Samples no. |
|---|---|---|---|
| sand | silt | Clay | |
| 8 | 44 | 48 | 1 |
| 6 | 39 | 55 | 2 |
| 9 | 44 | 47 | 3 |
| 8 | 43 | 49 | 4 |
| 7.75 | 42.5 | 49.75 | Average |
Table text extracted from the original PDF; superscript letters are shown inline. The original table image is below.
View original table image
Fig 2 represents the grain size gradient curves of the Molasses area models
The results of the granular volumetric analysis of the clays of the Injana Formation showed that the percentage of clay ranged between (23%-55%), the percentage of silt ranged between (39%-71%), and sand ranged between (5%-11). They are shown in table below 1. The relationship between the weight percentage of the basic components of clay, silt and sand (Sand-Clay-Silt) for the models of the two study areas was represented on the Picard classification triangle (Picard, 1971) [11] in order to know the histological classification as in Figure 3. And due to the great similarity in the components of the mud sediments, this classification was adopted and on its basis it was possible to name the models
Specific gravity
The specific weight is one of the significant characteristics and one of the important geotechnical properties of sediments that are used in the evaluation and classification of soil. in the brick industry. This test was conducted for the soil of the two study areas according to the American standard (ASTM-D, 854-02-2004) [14] in the Al-Inshaya laboratory / Kirkuk. The values of the specific weight of the models of Dibs ranged from (2.71-2.75) at a rate of (2.73) as shown in Table 2.
| Average specific gravity values | Samples no. |
|---|---|
| 2.74 | 1 |
| 2.75 | 2 |
| 2.73 | 3 |
| 2.71 | 4 |
| 2.7325 | Average |
Table text extracted from the original PDF; superscript letters are shown inline. The original table image is below.
View original table image
Consistency of soil
The texture of the soil is one of the most important properties indicative in the dictionary of the engineering guide, as it is one of the indicative tests for determining the different properties of fine-grained soil consisting of (clay and silt) (Sabatini et al, 2002) [16] , and it is important in the production of bricks, which has a role in preparing the appropriate texture For the soil and monitoring the model, which facilitates the molding stage during the production of bricks, which determines the extent of the plasticity of the soil, as the greater the plasticity of the soil, the greater its compressive strength. An examination of the Atropic limits for each of the fluidity and plasticity limits was carried out in the Structural Laboratory / Kirkuk, according to the methods approved by the American Standard (ASTM-D, 4318, 2004) [13] . In this study, the plasticity scheme was relied upon within the USCS (Unified soil classification system). Figure 4. represent the distribution of the location of the study area models on the plasticity chart for the classification of soft soils within the unified classification and the decree between (plasticity coefficient, liquidity limit), where the models were projected within the fields in The shape, on the basis of which it is named and classified, is medium-plastic (CL).
We conclude that the samples taken from the region have a percentage of fine granules, which include (Mud and silt) more than (50%). In the region, the content of clay and silt increased with a small percentage of sand, and in addition to examining the specific weight, we notice an increase in the results. The reason for this is the increase in the content of fine grains in the region, where the more (Clay and silt) increases the value of the specific weight of the models increases, through which the model can be named and that the models of region are classified according to the unified international classification (U.S.C.S) within the category (CL) with low to medium plasticity, and the model are classified according to the classification of Picard (1971) [11] , As for the model of Dibis region of the type (Silty Clay), this is due to the increase in the ratio of clay to silt, and depending on the histological classification of the soil, the model was named depending on the main component in it, and it was found that there is a direct relationship between the results of the granular size and the coefficient of plasticity, as the model Those with a high content of fine granules show a relatively high plasticity, as these properties all share the knowledge of soil behavior. And after examining the results of the tests (specific weight, granular volumetric analysis, and Atterbeck boundaries) of the samples studied in the study area for the purpose of using them in the brick industry, the results indicate that the soil in the study area consists mainly of soft soil (clay and silt) and a small percentage of sand. And it is able to form and take appropriate plasticity and flexibility in the manufacture of bricks.
Conclusion
1. The results of the physical examinations of the raw materials of the sediments of the study area, and depending on the American international specifications (ASTM, D., (422-63) 2004) [12] showed that they vary in terms of the size distribution of the granules, as they mainly consist of granules of clay and silt sizes. (Silt) and a smaller proportion of sand sizes (Sand) which is a silty loamy soil. 2. We conclude from the results of the granular volumetric analysis and based on the nomenclature of Picard (1971) [11] for the relative distribution of clay, silt and sand fractions, that it is located within the clayey silt field, and this indicates an increase in the ability to form the prepared dough for making bricks. 3. We conclude that the higher the ratio of clay to the other components, the higher the value of its specific weight, as in the soil samples of the study area. 4. It was found that there is a direct relationship between fine particle size and plasticity, as samples with high content of fine particles show relatively high plasticity. 5. We conclude that the samples with high clay content, as in the samples, have low to medium plasticity, depending on the plasticity diagram.
Figures and tables from the paper
References
6 in the original paper- Nwankwoala HO, Warmate T. Geotechnical assessment of foundation conditions of a site in Ubima, Ikwerre Local Government Area, Rivers State, Nigeria. International Journal of Engineering Research and Development (IJERD). 2014;9(8):50-63.
- Fatouhi, Ramo Z, Muhammad TK, Al-Jassar S, Mashkour M. 1989: Engineering Geology and Site Investigation, Directorate of Dar Al-Kutub, University of Mosul; c2014. p. 352.
- Sissakian VK. The Geology of Kirkuk Quadrangle, sheet Ni-38-2. scale. 1992;1:250000.
- Picard MD. Classification of Fine -grained Sedimentary Rocks. Journal of Sedimentary Research. 1971;41(1-4):179-195.
- ASTM D. Standard Test Methods for Specific Gravity of Soil Solids by Water Pycnometer; c 2004. p. 854902.
- Okan Z, Taraf HU. The use of blogs in second language teacher education. Procedia-Social and Behavioral Sciences. 2013;83:282-289.