
Research article · 2023 · Full text
International Journal of Geography Geology and EnvironmentImpact of anthropogenic activities on groundwater within Budgam district of J&K, India, with special emphasis on nitrate concentrations
Volume 5(2) · Pages 211–217 · DOI: 10.22271/27067483.2023.v5.i2b.256 ↗
Research areasWater Quality and Pollution AssessmentGroundwater and Watershed Analysis
Abstract
Author-writtenThis research aimed to assess the influence of anthropogenic activities on groundwater, specifically focusing on nitrate concentrations in the Budgam district and potential health risks to the local population. Thirty sampling sites underwent a comprehensive physicochemical analysis, including key anthropogenic indicators such as sulfate, chloride, phosphate, fluoride, and nitrate. The hydrogeochemical data from these sites indicated that concentrations of nearly all parameters adhered to the permissible limits established by the World Health Organization (WHO) and the Bureau of Indian Standards (BIS). Notably, chloride ranged from 25-90 mg/l, sulfate from 25-90 mg/l, phosphates from 0.01-0.3 mg/l, and fluoride from 0.01 mg/l to 0.3 mg/l. Nitrate concentrations fluctuated between 8 and 25 mg/l, with an average value of 15.32 mg/l, peaking at sites S1 (Soibugh) and S29 (Kralpora) and reaching the lowest at site S9 (Larikpora). The examination of nitrate concentrations across the summer and winter seasons revealed a moderate spatial seasonal variation in the study area's groundwater. Most sample sites exhibited higher nitrate concentrations during the summer, potentially linked to agricultural activities and the use of nitrogenous fertilizers. This study suggests that while the current impact of anthropogenic activities in the study area is relatively low, there has been an increase compared to previous assessments. The insights gained from this research can contribute to the development of an effective groundwater management strategy in the future.
Summary
Source-checkedPlain-language reading of the full paper, prepared with AI and checked against the text. Each point links to the authors' own words.
Why it matters
- Groundwater is a critical natural resource, and access to clean water is essential for human welfare. View evidence ↗
- Human activities, including waste disposal and the use of agricultural fertilizers and pesticides, pose significant threats to groundwater quality. View evidence ↗
- High nitrate levels in drinking water can be dangerous, particularly for children under five, as they can transform into carcinogenic nitrosamines in the body. View evidence ↗
The question
- The study aimed to evaluate how human activities affect groundwater in the Budgam district, with a specific focus on nitrate levels and associated health risks. View evidence ↗
What they did
- Spectrophotometric analysis was used to measure the concentrations of nitrate, chloride, sulfate, and phosphate in the water samples. View evidence ↗
- The measured groundwater parameters were compared against safety standards established by the World Health Organization (2017) and the Bureau of Indian Standards (2012). View evidence ↗
What they found
- Almost all measured physicochemical parameters in the groundwater samples remained within the permissible limits of the WHO and BIS. View evidence ↗
- Nitrate concentrations in the groundwater ranged from 8 to 25 mg/L, with an average of 15.32 mg/L. View evidence ↗
- The observed nitrate levels were well below the maximum safety limits of 45 mg/L (BIS) and 50 mg/L (WHO). View evidence ↗
- Nitrate levels varied spatially across the district, peaking at sites S1 (Soibugh) and S29 (Kralpora) and reaching their lowest at S9 (Larikpora). View evidence ↗
- Linear trend analysis revealed a seasonal pattern where nitrate concentrations were significantly higher in the summer than in the winter. View evidence ↗
- Other anthropogenic indicators were also within limits: chloride (25-90 mg/l), sulfate (25-90 mg/l), phosphates (0.01-0.3 mg/l), and fluoride (0.01-0.3 mg/l). View evidence ↗
What it means
- The authors conclude that while groundwater quality is generally satisfactory, the variations in nitrate levels necessitate a proactive management strategy. View evidence ↗
- The authors recommend implementing ongoing monitoring programs, especially in areas with higher nitrate levels, to ensure water safety. View evidence ↗
Visual summary
2 visualsIllustrations explain the paper; charts are replotted from the paper's own table values.
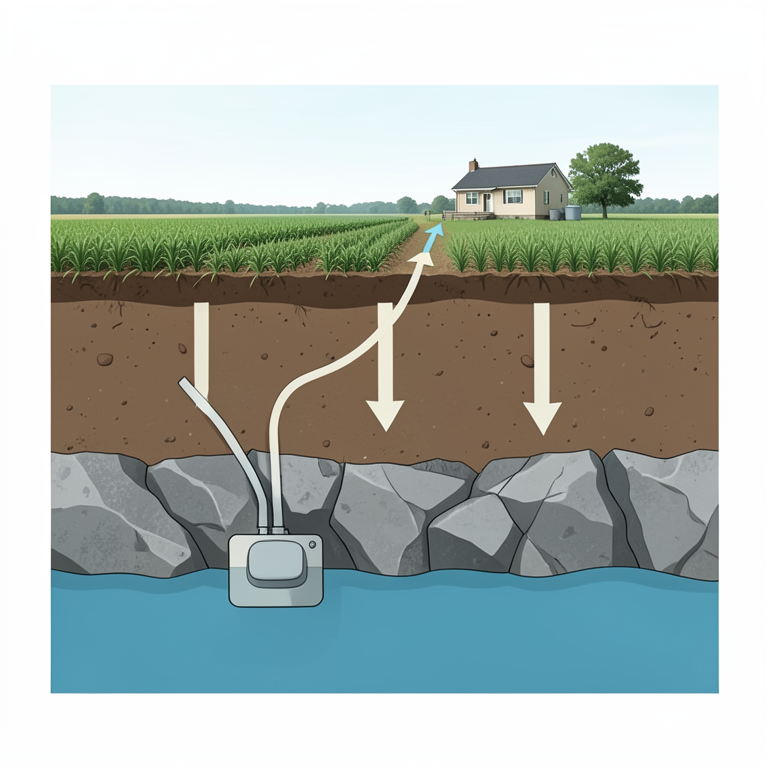
Sources of Nitrate Contamination
AI-generated conceptual illustration (A cross-section of a rural landscape with soil layers and an underground aquifer). It explains the idea and does not show study data.
View source evidence ↗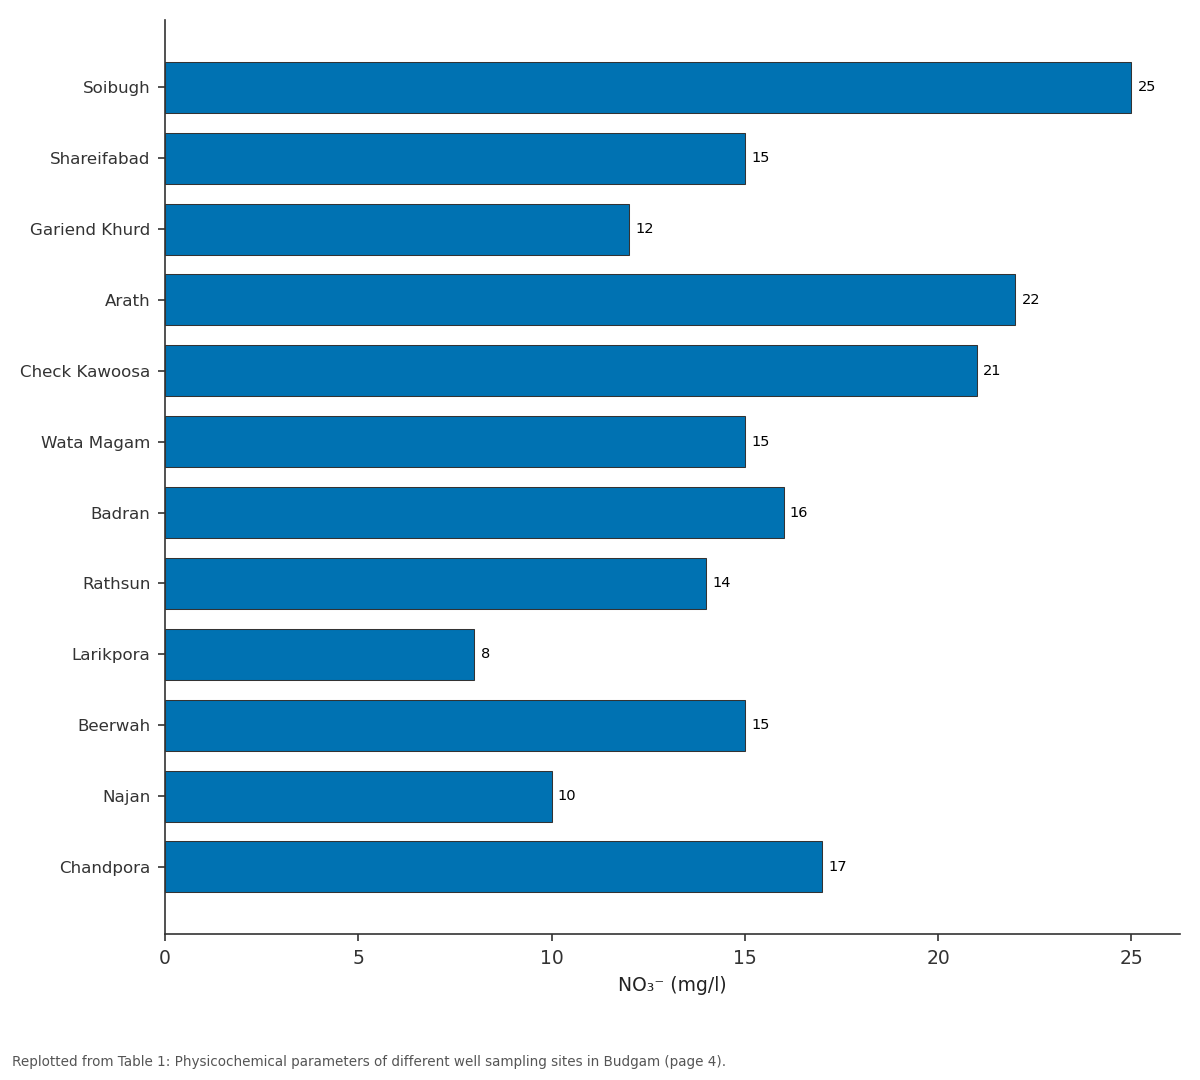
NO₃⁻ (mg/l): Soibugh vs Shareifabad vs Gariend Khurd vs Arath vs Check Kawoosa
Replotted from Table 1 (page 4) of the original paper. Every bar is the paper's own table value.
View source evidence ↗Figures & tables
From the original paper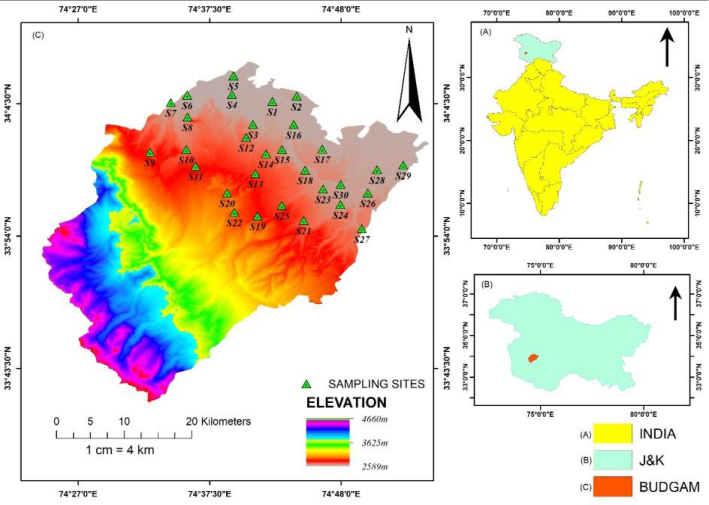 Figure 1
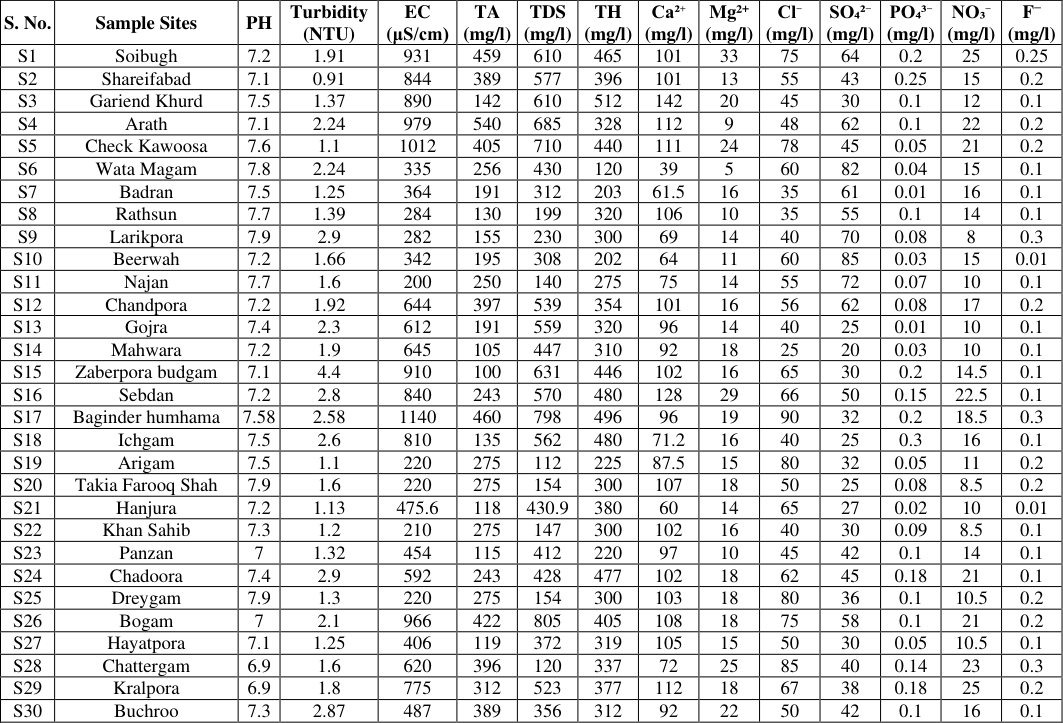 Table 1
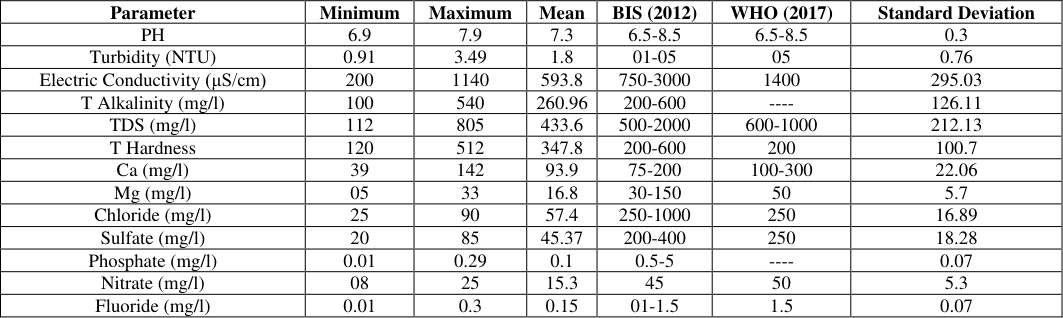 Table 2
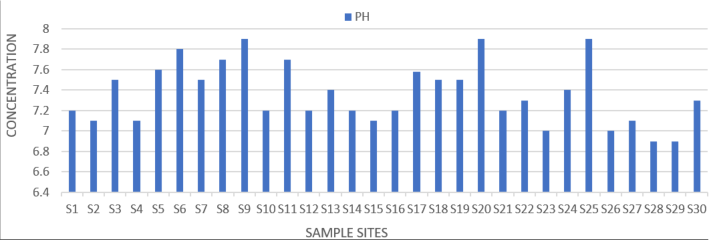 Figure 2
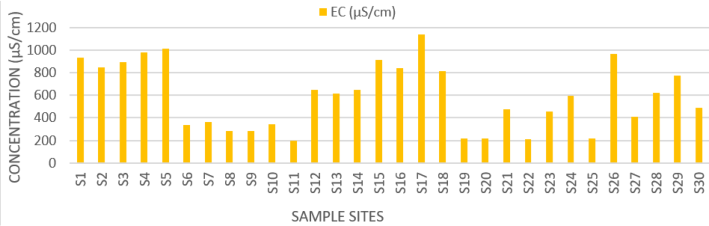 Figure 3
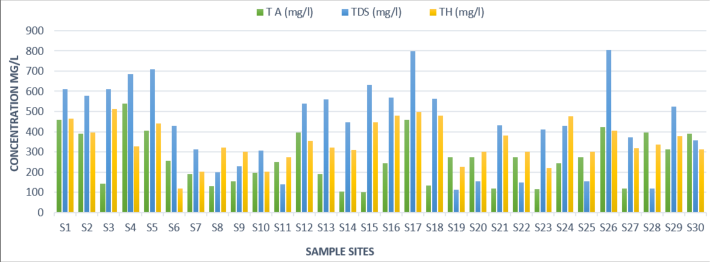 Figure 4
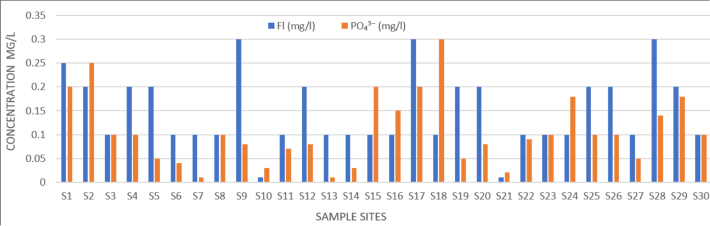 Figure 5
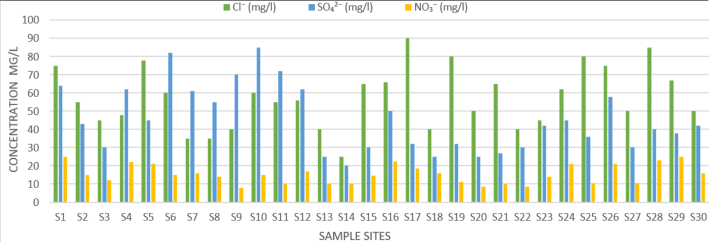 Figure 6
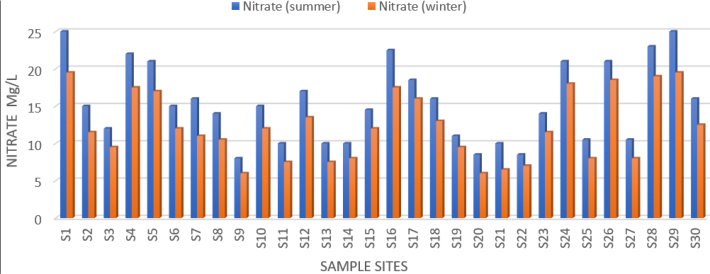 Figure 7
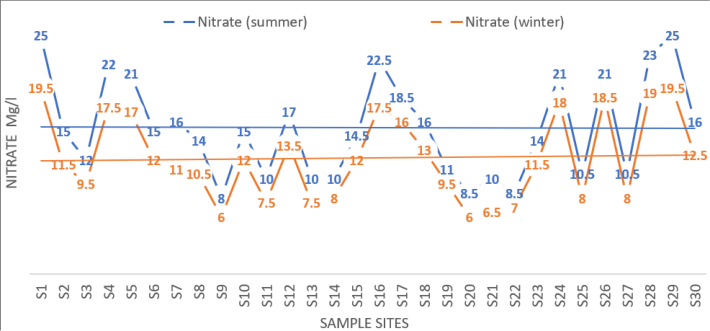 Figure 8
Introduction
Groundwater stands as one of the Earth's most crucial natural resources, and the indispensability of water, especially clean water, is paramount. Groundwater systems are essential to human welfare, whether they are delivering usable and abstractable water or performing a variety of in situ purposes, including maintaining moist surroundings and buffering the climate (Jac van der Gun, 2021) [8] . Anthropogenic activities, such as domestic and municipal solid waste, industrial waste, landfill leachate, careless disposal of human and animal waste, inadequate on-site sanitation facilities, septic tank systems, and the use of fertilizers and pesticides during irrigation, pose a serious threat to groundwater contamination. A variety of pollutants are frequently released into the environment as a result of the development trajectory, which is characterized by industry, urbanization, and modern agriculture. The quality and services offered by natural resources are seriously threatened by the improper disposal of industrial chemicals. In the contemporary era of human development, groundwater emerges as a precious water source for industrial and agricultural activities. However, in developing regions, groundwater serves as a critical resource for potable water supplies in both rural and urban areas. However, its long-term sustainability is threatened by the ongoing impacts of anthropogenic activities and industrial expansion during the past few decades (Niu et al., 2014; Chen et al., 2016; Gallardo and Marui, 2016; Li, 2016) [13,5,7,10] . Groundwater contamination occurs when specific pollutants exceed the prescribed limits set for drinking water. The reasons behind groundwater contamination include natural impurities resulting from geological formations and humaninduced chemicals. The issue of groundwater contamination in agricultural regions is a global concern due to its repercussions on the environment, drinking water, and, notably, human health (WHO, 2011). Challenges related to groundwater quality are particularly pronounced in densely populated, heavily industrialized areas with shallow groundwater tube wells (Shivran et al., 2006; V. Satish Kumar et al., 2016) [19,15] . Nitrate contamination represents a widespread issue in global groundwater systems (Ako et al., 2014) [1] . Nitrogen (N) is a crucial element for sustaining agriculture (Shrestha and Ladha, 2002; Schröder et al., 2004) [20,16] . Nevertheless, the worldwide prevalence of nitrate contamination in groundwater is a significant concern (Kyllmar et al., 2004; Liu et al., 2005) [9,11] . Nitrate, being water-soluble and negatively charged, readily leaches from the soil, ultimately depositing in groundwater (Wongsanit et al., 2015) [23] . Almasri (2007) [2] identifies various sources contributing to nitrate contamination, including point sources such as industrial activities, septic tanks, and dairy and livestock waste, as well as non-point sources like the extensive use of nitrogen fertilizers and atmospheric deposition in agriculture. Multiple factors, often additive, contribute to groundwater nitrate contamination, with agriculture being a major source. While nitrogen fertilizers enhance crop yields, their excessive use can lead to water, air, and soil contamination. Agricultural overuse of nitrogen fertilizers, a common consequence, significantly degrades groundwater quality and pollutes drinking water sources, posing potential threats to human health (Wick et al., 2012) [22] . Several studies highlight the correlation between nitrate contamination and intensive agricultural practices, particularly the heavy use of nitrate fertilizers (Sham-Suddin et al., 2016) [18] . Nitrates, highly soluble compounds, migrate from agricultural lands to groundwater, sustaining contamination even after a decrease in nitrate load. Consumption of water containing high NO 3 levels can pose severe health risks, especially in children (< 5 years). In the human body, nitrates convert to nitrites through specific enzymes, further transforming into carcinogenic nitrosamines. The main biological effect of nitrites involves the oxidation of hemoglobin to methemoglobin, which is incapable of supplying tissues with oxygen. Effects range from cyanosis and cardiac arrhythmia to circulatory failure and impacts on the central nervous system. Methemoglobinemia (blue baby syndrome) occurs when methemoglobin levels exceed 10%, leading to cyanosis and asphyxia, posing high risks to newborns (Mensinga et [12,14,21,24] . Threshold values for nitrates have been established, with the BIS and WHO setting the maximum allowable limit for nitrates at 45 mg/L and 45 mg/L, respectively.
Study Area
Study Area
Methodology
Thirty representative sampling stations, corresponding to villages/blocks in the area, were selected for collecting groundwater samples during the summer season. Highdensity polyethylene (HDPE) bottles were employed to collect fresh groundwater samples. To eliminate contaminants and stabilize electrical conductivity, each sampling well was activated for a minimum of 2 minutes. To ensure sample integrity, each groundwater sample bottle was sealed tightly after collection to prevent leakage and contamination during handling and transport. Meticulous labels were applied for identification and were placed in a 4°C freezer until chemical analysis. Throughout the entire process, from collection to analysis, meticulous procedures and necessary precautions were taken to prevent sample deterioration or contamination. The analysis of water samples followed the established analytical procedures as outlined in APHA (2005). High-quality analytical reagents and double-distilled water bottles were utilized in the preparation of solutions for this analysis. Water samples underwent spectrophotometric analysis to assess Nitrate, Chloride, Sulfate, and Phosphate concentrations.
Results and Discussion
Table 1 outlines the recorded physicochemical parameters and anthropogenic indicators (chloride, sulfate, phosphate, fluoride, and nitrate) for the groundwater samples in the study area, which were measured at 30 sites during the summer season. Emphasis was placed on nitrates due to their significance in indicating the influence of aboveground anthropogenic activities. The concentrations of these parameters observed in the groundwater act as indicators of the influence of above-ground anthropogenic activities in the study area. Importantly, the assessment of all parameters measured in the groundwater samples involved a comparison with the standards set by the World Health Organization (WHO, 2017) and the Bureau of Indian Standards (BIS, 2012). It is noteworthy that all measured values are within the specified limits. In the groundwater samples, pH values ranged between 6.9 and 7.9, with a mean of 7.3, which is considered slightly alkaline (Figure 2). Electric conductivity varied from 200 to 1140 (μS/cm), with the highest at S17 and the lowest at S11 (Figure 3). Turbidity ranged between 0.9 to 4.4 NTU, with the highest at S17 and the lowest at S11. Total alkalinity ranged between 100 to 540 mg/l, with the lowest at S15 and the highest at S4, with a mean of 260 mg/l. Within the study area, groundwater samples exhibited a marked variability in total hardness, ranging from 120 mg/L to 512 mg/L. The maximum concentration was at S3 (Gariend Khurd) and the minimum was at S6 (Wata Magam). This study reveals that the calcium ion dominates the cation chemistry concentration in the study area, ranging from 39 to 142 mg/L, with the highest at S3 (Gariend Khurd) and the lowest at S6 (Wata Magam). The magnesium content of groundwater ranged from 6.0 to 43.5 mg/L, with an average value of 21.9 mg/L. The maximum value was recorded at S1 (Soibugh) and the minimum at S6 (Wata Magam). Analysis of total dissolved solids (TDS) in groundwater samples revealed a significant variation, with concentrations ranging from 112 mg/L to 805 mg/L, averaging 433.6 mg/L with the highest TDS value at S26 (Bogam) and the lowest at S19 (Arigam). Variation in total alkalinity, total hardness, and total dissolved solids is illustrated in Figure 4. Phosphates in groundwater ranged from 0.01-0.3 mg/L, with an average value of 0.1 mg/L. The maximum value was recorded at S18 (Ichgam), and the minimum value was recorded at S7 (Badran) and S13 (Gojra). Human sewage, agricultural runoff from farmlands, effluents from animal feedlots, and the regular use of non-biodegradable detergent are among the anthropogenic sources of phosphate. In our investigation, the fluoride concentration in the groundwater samples ranged from 0.01 mg/L to 0.3 mg/L, averaging 0.07 mg/L. The minimum values were recorded at S10 (Beerwah) and S21 (Hanjura), while the maximum value was observed at S9 (Larikpora), S17 (Baginder Humhama), and S28 (Chattergam). Fluoride-bearing minerals in rocks and their interaction with water and agricultural activities are considered the main causes of fluoride in groundwater. Elevated fluoride levels can lead to fluorosis, impacting the skeleton, teeth, and other body parts (Saxena and Saxena, 2013) [17] . The variation in phosphate and fluoride concentrations is shown in Figure 5. Chloride concentration ranged from 25 to 90 mg/L, with an average value of 57.5 mg/L, highest at S17 (BaginderHuhmhama) and lowest at S14 (Mahwara). Evaporation and precipitation significantly affect water chloride concentration, which is more harmful to plants than sulfate ions and serves as a primary indicator of pollution. The assessment of chloride concentration in water samples provides information regarding the contamination of water samples by wastewater, soluble chloride salts, and other contaminants. Chloride ions might be introduced to groundwater from the widespread domestic sewage, agricultural activities and leaching. Sulfate values ranged from 20 to 85 mg/l, with an average of 45.3 mg/l, peaking at S10 (Beerwah) and lowest at S14 (Mahwara). While not acutely toxic, sulfate in groundwater can cause health issues like diarrhea and, in rare cases, impact blood oxygen transport. It can also corrode pipes and damage concrete. Sources of sulfate in groundwater include natural minerals as well as human activities such as agriculture and improper wastewater disposal, which contribute to leaching processes and introduce sulfate into the groundwater system through anthropogenic activities. Nitrate is a common component found in raw water and predominantly exists in the form of the N2 molecule, representing its oxidized state. Drinking water is harmful in the presence of excess nitrate concentrations. Infants younger than six months old suffer from methemoglobinemia, often known as blue baby disease, due to increased nitrate concentrations in water. The nitrate concentration in the water ranged from 8 to 25 milligrams per liter (mg/L), with an average value of 15.32 mg/L. The sources of nitrate in groundwater include domestic and animal waste, decaying organic matter, and agricultural practices, particularly the application of nitrogen-rich fertilizers. These fertilizers infiltrate the soil profile, potentially leaching excess nitrate and contaminating groundwater resources. Significantly, all measured nitrate concentrations adhered to established drinking water safety guidelines. Values remained well below the maximum permissible limits set by both the Bureau of Indian Standards (45 mg/L) and the World Health Organization (50 mg/L). This confirms the suitability of the water for consumption based on nitrate levels. There is a moderate spatial variation in nitrate concentration in the Budgam district, with the highest concentration at S1 (Soibugh), S29 (Kralpora), and the lowest at S9 (Larikpora). The former site can be attributed to anthropogenic impact, as NO 3 -that enters the water systems originates from wastes or fertilizers applied to the land surface, while the latter site can be considered unpolluted, as indicated by the low nitrate concentration. Figure 6 illustrates the variation in chlorides, sulfates, and nitrates. Notably, seasonal fluctuations in nitrate concentrations were observed in the Budgam district, as shown in Figure 7. Generally, the lowest values occurred during the winter season, while the highest values were noted in the summer season. The graphical representation of nitrate contamination comparison between the summer and winter seasons, using linear trend analysis (LTA), is presented in Figure 8. The linear trend analysis (LTA) showed a clear seasonal pattern in nitrate concentration, with significantly higher values observed during the summer months compared to winter, as indicated by the elevated position of the summer LTA line relative to the winter line. Several factors likely contribute to this seasonal disparity. Agricultural activity often intensifies during the summer in many regions, leading to increased application of nitrogenbased fertilizers (N-fertilizers). These fertilizers can become a significant source of nitrate contamination if not properly managed, as excess nitrogen can leach through the soil profile and into groundwater reserves. Furthermore, summer months often coincide with increased water use for irrigation, which can influence groundwater flow dynamics and potentially mobilize nitrate contamination already present within the subsurface. It's important to recognize that natural processes can also contribute to nitrate in groundwater. Within the soil zone, organic nitrogen (NH₄⁺) can undergo a natural conversion process to nitrate (NO₃⁻). This process, known as nitrification, can be influenced by various environmental factors, but it generally occurs under aerobic conditions. Additionally, human activities can influence nitrification rates, such as through land-use changes or soil disturbances (Freeze and Cherry, 1979) [6] . Table 2 shows the minimum, maximum, mean, and standard deviation of different parameters compared against the standard permissible limits established by reputable organizations such as the WHO 2017 (World Health Organization) and BIS 2012 (Bureau of Indian Standards).
| Parameter | Minimum | Maximum | Mean | BIS (2012) | WHO (2017) | Standard Deviation |
|---|---|---|---|---|---|---|
| PH | 6.9 | 7.9 | 7.3 | 6.5-8.5 | 6.5-8.5 | 0.3 |
| Turbidity (NTU) | 0.91 | 3.49 | 1.8 | 01-05 | 05 | 0.76 |
| Electric Conductivity (μS/cm) | 200 | 1140 | 593.8 | 750-3000 | 1400 | 295.03 |
| T Alkalinity (mg/l) | 100 | 540 | 260.96 | 200-600 | ---- | 126.11 |
| TDS (mg/l) | 112 | 805 | 433.6 | 500-2000 | 600-1000 | 212.13 |
| T Hardness | 120 | 512 | 347.8 | 200-600 | 200 | 100.7 |
| Ca (mg/l) | 39 | 142 | 93.9 | 75-200 | 100-300 | 22.06 |
| Mg (mg/l) | 05 | 33 | 16.8 | 30-150 | 50 | 5.7 |
| Chloride (mg/l) | 25 | 90 | 57.4 | 250-1000 | 250 | 16.89 |
| Sulfate (mg/l) | 20 | 85 | 45.37 | 200-400 | 250 | 18.28 |
| Phosphate (mg/l) | 0.01 | 0.29 | 0.1 | 0.5-5 | ---- | 0.07 |
| Nitrate (mg/l) | 08 | 25 | 15.3 | 45 | 50 | 5.3 |
| Fluoride (mg/l) | 0.01 | 0.3 | 0.15 | 01-1.5 | 1.5 | 0.07 |
Table text extracted from the original PDF; superscript letters are shown inline. The original table image is below.
View original table image
| S. No. | Sample Sites | PH | Turbidity (NTU) | EC (μS/cm) | TA (mg/l) | TDS (mg/l) | TH (mg/l) | Ca²⁺ (mg/l) | Mg²+ (mg/l) | Cl⁻ (mg/l) | SO₄²⁻ (mg/l) | PO₄³⁻ (mg/l) | NO₃⁻ (mg/l) | F− (mg/l) |
|---|---|---|---|---|---|---|---|---|---|---|---|---|---|---|
| S1 | Soibugh | 7.2 | 1.91 | 931 | 459 | 610 | 465 | 101 | 33 | 75 | 64 | 0.2 | 25 | 0.25 |
| S2 | Shareifabad | 7.1 | 0.91 | 844 | 389 | 577 | 396 | 101 | 13 | 55 | 43 | 0.25 | 15 | 0.2 |
| S3 | Gariend Khurd | 7.5 | 1.37 | 890 | 142 | 610 | 512 | 142 | 20 | 45 | 30 | 0.1 | 12 | 0.1 |
| S4 | Arath | 7.1 | 2.24 | 979 | 540 | 685 | 328 | 112 | 9 | 48 | 62 | 0.1 | 22 | 0.2 |
| S5 | Check Kawoosa | 7.6 | 1.1 | 1012 | 405 | 710 | 440 | 111 | 24 | 78 | 45 | 0.05 | 21 | 0.2 |
| S6 | Wata Magam | 7.8 | 2.24 | 335 | 256 | 430 | 120 | 39 | 5 | 60 | 82 | 0.04 | 15 | 0.1 |
| S7 | Badran | 7.5 | 1.25 | 364 | 191 | 312 | 203 | 61.5 | 16 | 35 | 61 | 0.01 | 16 | 0.1 |
| S8 | Rathsun | 7.7 | 1.39 | 284 | 130 | 199 | 320 | 106 | 10 | 35 | 55 | 0.1 | 14 | 0.1 |
| S9 | Larikpora | 7.9 | 2.9 | 282 | 155 | 230 | 300 | 69 | 14 | 40 | 70 | 0.08 | 8 | 0.3 |
| S10 | Beerwah | 7.2 | 1.66 | 342 | 195 | 308 | 202 | 64 | 11 | 60 | 85 | 0.03 | 15 | 0.01 |
| S11 | Najan | 7.7 | 1.6 | 200 | 250 | 140 | 275 | 75 | 14 | 55 | 72 | 0.07 | 10 | 0.1 |
| S12 | Chandpora | 7.2 | 1.92 | 644 | 397 | 539 | 354 | 101 | 16 | 56 | 62 | 0.08 | 17 | 0.2 |
| S13 | Gojra | 7.4 | 2.3 | 612 | 191 | 559 | 320 | 96 | 14 | 40 | 25 | 0.01 | 10 | 0.1 |
| S14 | Mahwara | 7.2 | 1.9 | 645 | 105 | 447 | 310 | 92 | 18 | 25 | 20 | 0.03 | 10 | 0.1 |
| S15 | Zaberpora budgam | 7.1 | 4.4 | 910 | 100 | 631 | 446 | 102 | 16 | 65 | 30 | 0.2 | 14.5 | 0.1 |
| S16 | Sebdan | 7.2 | 2.8 | 840 | 243 | 570 | 480 | 128 | 29 | 66 | 50 | 0.15 | 22.5 | 0.1 |
| S17 | Baginder humhama | 7.58 | 2.58 | 1140 | 460 | 798 | 496 | 96 | 19 | 90 | 32 | 0.2 | 18.5 | 0.3 |
| S18 | Ichgam | 7.5 | 2.6 | 810 | 135 | 562 | 480 | 71.2 | 16 | 40 | 25 | 0.3 | 16 | 0.1 |
| S19 | Arigam | 7.5 | 1.1 | 220 | 275 | 112 | 225 | 87.5 | 15 | 80 | 32 | 0.05 | 11 | 0.2 |
| S20 | Takia Farooq Shah | 7.9 | 1.6 | 220 | 275 | 154 | 300 | 107 | 18 | 50 | 25 | 0.08 | 8.5 | 0.2 |
| S21 | Hanjura | 7.2 | 1.13 | 475.6 | 118 | 430.9 | 380 | 60 | 14 | 65 | 27 | 0.02 | 10 | 0.01 |
| S22 | Khan Sahib | 7.3 | 1.2 | 210 | 275 | 147 | 300 | 102 | 16 | 40 | 30 | 0.09 | 8.5 | 0.1 |
| S23 | Panzan | 7 | 1.32 | 454 | 115 | 412 | 220 | 97 | 10 | 45 | 42 | 0.1 | 14 | 0.1 |
| S24 | Chadoora | 7.4 | 2.9 | 592 | 243 | 428 | 477 | 102 | 18 | 62 | 45 | 0.18 | 21 | 0.1 |
| S25 | Dreygam | 7.9 | 1.3 | 220 | 275 | 154 | 300 | 103 | 18 | 80 | 36 | 0.1 | 10.5 | 0.2 |
| S26 | Bogam | 7 | 2.1 | 966 | 422 | 805 | 405 | 108 | 18 | 75 | 58 | 0.1 | 21 | 0.2 |
| S27 | Hayatpora | 7.1 | 1.25 | 406 | 119 | 372 | 319 | 105 | 15 | 50 | 30 | 0.05 | 10.5 | 0.1 |
| S28 | Chattergam | 6.9 | 1.6 | 620 | 396 | 120 | 337 | 72 | 25 | 85 | 40 | 0.14 | 23 | 0.3 |
| S29 | Kralpora | 6.9 | 1.8 | 775 | 312 | 523 | 377 | 112 | 18 | 67 | 38 | 0.18 | 25 | 0.2 |
| S30 | Buchroo | 7.3 | 2.87 | 487 | 389 | 356 | 312 | 92 | 22 | 50 | 42 | 0.1 | 16 | 0.1 |
Table text extracted from the original PDF; superscript letters are shown inline. The original table image is below.
View original table image
Conclusion
This study investigated the impact of anthropogenic activities on groundwater quality within the Budgam district of Jammu and Kashmir, India, with a specific focus on nitrate concentrations. Groundwater samples were collected from 30 representative sites during the summer season for analysis. The study examined various physicochemical parameters and anthropogenic indicators, including chloride, sulfate, phosphate, fluoride, and nitrate concentrations, to assess the influence of anthropogenic activities on groundwater quality in the area. All parameters, particularly the anthropogenic indicators derived from the collected groundwater samples, adhere to the recommended limits set by the World Health Organization (WHO 2017) and the Bureau of Indian Standards (BIS 2012). The findings indicate that key anthropogenic indicators such as chloride ranged from 25-90 mg/l, sulfate ranged from 25-90 mg/l, phosphates ranged from 0.01-0.3 mg/l, and fluoride ranged from 0.01 mg/l to 0.3 mg/l, all of which are within the permissible limits. Nitrate concentrations ranged from 8 to 25 mg/L, with an average of 15.32 mg/L, which is well below the safety guidelines. However, there was moderate spatial variation in nitrate concentration, with higher elevated levels observed in some locations as compared to others. This suggests the potential influence of anthropogenic activities like fertilizer use or sewage disposal in those locations. Seasonal variations were also observed, with higher nitrate levels recorded in the summer season compared to the winter season. This could be due to increased agricultural activities and lower dilution rates during the summer months. While the analysis of various parameters suggests overall satisfactory groundwater quality within the investigated area, observed variations in nitrate concentrations warrant a proactive management approach.
The implementation of ongoing monitoring programs, with a particular focus on areas exhibiting elevated nitrate levels, is crucial. This targeted approach will ensure the continued safety and sustainability of this vital water resource for both human consumption and environmental health.
Figures and tables from the paper
References
20 in the original paper- Ako AA, Eyong GET, Shimada J, Koike K, Hosono T, Ichiyanagi K, et al. Nitrate contamination of groundwater in two areas of the Cameroon Volcanic Line (Banana Plain and Mount Cameroon area). Appl Water Sci. 2014;4:99-113.
- Almasri M. Nitrate contamination of groundwater: A conceptual management framework. Environ Impact Assess Rev. 2007;27(3):220-242. DOI: 10.1016/j.eiar.2006.11.002.
- Chen J, Wu H, Qian H. Groundwater nitrate contamination and associated health risk for the rural communities in an agricultural area of Ningxia, Northwest China. Expo Health. 2016;8(3):349-359.
- Gallardo AH, Marui A. The aftermath of the Fukushima nuclear accident: measures to contain groundwater contamination. Sci Total Environ. 2016;547:261-268.
- Kyllmar K, Mårtensson K, Johnsson H. Model-based coefficient method for calculation of N leaching from agricultural fields applied to small catchments and the effects of leaching reducing measures. J Hydrol. 2004;304(1-4):343-354.
- Li P. Groundwater quality in Western China: challenges and paths forward for groundwater quality research in Western China. Expo Health. 2016;8:305-310.
- Aiguo L, Jinghua M, Ramble AO. Nitrate contamination in private wells in rural Alabama, United States. Sci Total Environ. 2005;346:112-120.
- Mensinga TT, Speijers GJA, Meulenbelt J. Health implications of exposure to environmental nitrogenous compounds. Toxicol. Rev. 2013;22(1):41-51.
- Niu Loáiciga HA, Wang Z, Zhan FB, Hong S. Twenty years of global groundwater research: a Science Citation Index Expanded-based bibliometric survey (1993-2012). J Hydrol. 2014;519:966-975.
- Renseigne N, Umar S, Iqbal M. Nitrate accumulation in plants, factors affecting the process, and human health implications: A review. Agron Sustain Dev. 2007;27(1):45-57.
- Satish Kumar V, Amarender B, Dhakate R, et al. Assessment of groundwater quality for drinking and irrigation use in shallow hard rock aquifer of Pudunagaram, Palakkad District Kerala. Appl Water Sci. 2016;6:149-167.
- Schröder JJ, Scholefield D, Cabral F, Hofman G. The effects of nutrient losses from agriculture on ground and surface water quality: the position of science in developing indicators for regulation. Environ Sci Policy. 2004;7:15-23.
- Saxena U, Saxena S. Statistical assessment of groundwater quality using physicochemical parameters in Bassi Tehsil of Jaipur District, Rajasthan, India. Glob J Sci Frontier Res. 2013;13(3):23-31.
- Shamsuddin AS, Ismail SNS, Abidin EZ, Bin HY, Juahir H, Ho YB, et al. Contamination of nitrate in groundwater and evaluation of health risk in Bachok, Kelantan: A cross-sectional study. Am J Appl Sci. 2016;13(1):80-90.
- Shivran HS, Dinesh Kumar D, Singh RV. Improvement of water quality though biological denitrification. J Environ Sci Eng. 2006;48(1):57-60.
- Shrestha RK, Ladha JK. Nitrate pollution in groundwater and strategies to reduce pollution. Water Sci Technol. 2002;45(9):29-35.
- Smical I, Muntean A, Chioran C. The human health risk assessment related to the nitrates and nitrites in the wells water in Farcasa Village, Maramures County (Romania). ProEnvironment. 2014;7:198-203.
- Wick K, Heumesser C, Schmid E. Groundwater nitrate contamination: Factors and indicators. J Environ Manage. 2012;111:178-186.
- Wongsanit J, Teartisup P, Kerdsueb P, Tharnpoophasiam P, Worakhunpiset S. Contamination of nitrate in groundwater and its potential human health: A case study of lower Mae Klong River basin, Thailand. Environ Sci Pollut Res. 2015;22(15):115041112.
- World Health Organization. World Health Statistics 2017: Monitoring Health for the SDGs, Sustainable Development Goals. Geneva: World Health Organization; c2017.