
Research article · 2024 · Full text
International Journal of Agriculture Extension and Social DevelopmentAssess the level of empowerment of women vegetable sellers through Ima market
Volume 7(7) · Pages 292–296 · DOI: 10.33545/26180723.2024.v7.i7d.814 ↗
Research areasDiverse Scientific Research StudiesAgricultural Economics and PracticesInnovation and Socioeconomic Development
Abstract
Author-writtenThe present study was conducted in the Ima Market situated in the Imphal West District of Manipur during the 2023-2024 period to assess the level of empowerment among female vegetable sellers present in the market. A total of one twenty respondents were selected for this study. The market is completely run by women making it one of a kind. Women from various community and places of the state come together under the same roof and carry out the business activity daily. The study revealed that majority 51.67 percent of the respondents are of middle age group, 32.50 percent of the respondents were educated up to junior high school, 58.33 percent of the respondents were involved in business as well as agriculture as occupation. Majority 50.83 percent of the respondents were widows, 55.00 percent of the respondents are from joint family, majority 52.5 percent of the respondents have semi- cemented housing pattern, 51.67 percent of the respondents have Rs 1,00,966 to Rs 2,05,374 as their annual income, 44.17 percent of the respondents have 1-2 acres of land. It was observed that 48.33 percent of the respondents had high level of mass media exposure, 50.00 percent of the respondents have medium level of contact with extension personnel. It was also observed that 52.5 percent of the respondent started the business as their own choice. Age, education, occupation, housing pattern, annual income, land holding, mass-media exposure, extension contact and reason for employment found positively and significantly correlated with the overall empowerment of the respondents.
Summary
Source-checkedPlain-language reading of the full paper, prepared with AI and checked against the text. Each point links to the authors' own words.
Why it matters
- The Ima market is a unique and globally significant marketplace because it is entirely run and controlled by women. View evidence ↗
- Women's empowerment is defined as a process of gaining control over material, human, intellectual, and financial resources, as well as decision-making power in various societal levels. View evidence ↗
The question
- The study aimed to assess the level of empowerment among female vegetable sellers operating in the Ima Market in Manipur's Imphal West District between 2023 and 2024. View evidence ↗
What they did
- The study employed a descriptive research design. View evidence ↗
- Primary data was collected using a pre-tested structured interview schedule. View evidence ↗
What they found
- The majority of respondents were middle-aged (51.67%), educated up to junior high school (32.50%), and engaged in both business and agriculture (58.33%). View evidence ↗
- Demographic findings showed that 50.83% were widows, 55.00% lived in joint families, 52.5% had semi-cemented housing, 51.67% earned between Rs 1,00,966 and Rs 2,05,374 annually, and 44.17% owned 1-2 acres of land. View evidence ↗
- Regarding economic empowerment, 44.17% of respondents were in the medium category and 37.50% were in the high category. View evidence ↗
- Social empowerment levels were predominantly medium (45.00%), followed by high (35.50%). View evidence ↗
- Political empowerment was mostly at a medium level (45.00%), with 36.67% at a high level. View evidence ↗
- Cultural empowerment was highest in the medium category (60.00%), while 23.33% were in the low category. View evidence ↗
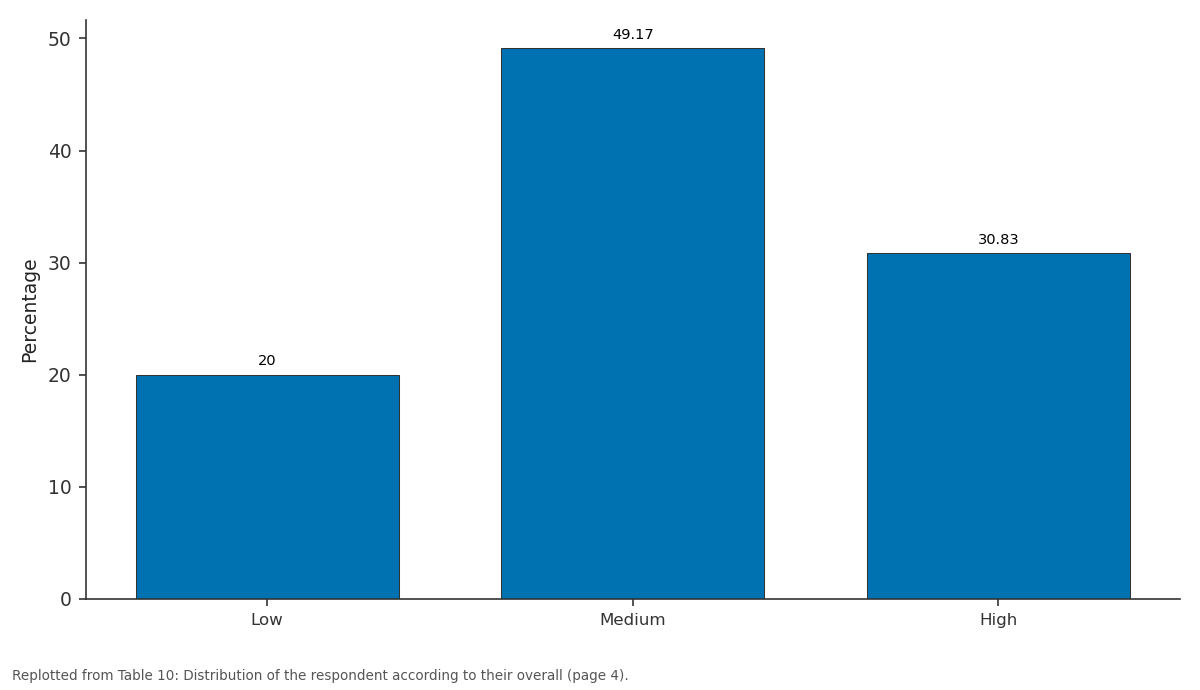
- Overall empowerment levels for the respondents were medium (49.17%), high (30.83%), and low (20.00%). View evidence ↗
- Land holding, mass media exposure, and the reason for employment were found to be positively and significantly correlated with empowerment at the 0.01% probability level. View evidence ↗
- Education, occupation, and contact with extension personnel also showed a positive and significant correlation with overall empowerment at the 0.05% probability level. View evidence ↗
What it means
- The authors concluded that most respondents were middle-aged, educated to junior high school, lived in joint families with semi-cemented housing, combined business with agriculture, and generally fell into the medium category of empowerment. View evidence ↗
Visual summary
2 visualsIllustrations explain the paper; charts are replotted from the paper's own table values.
Percentage: Low vs Medium vs High
Replotted from Table 10 (page 4) of the original paper. Every bar is the paper's own table value.
View source evidence ↗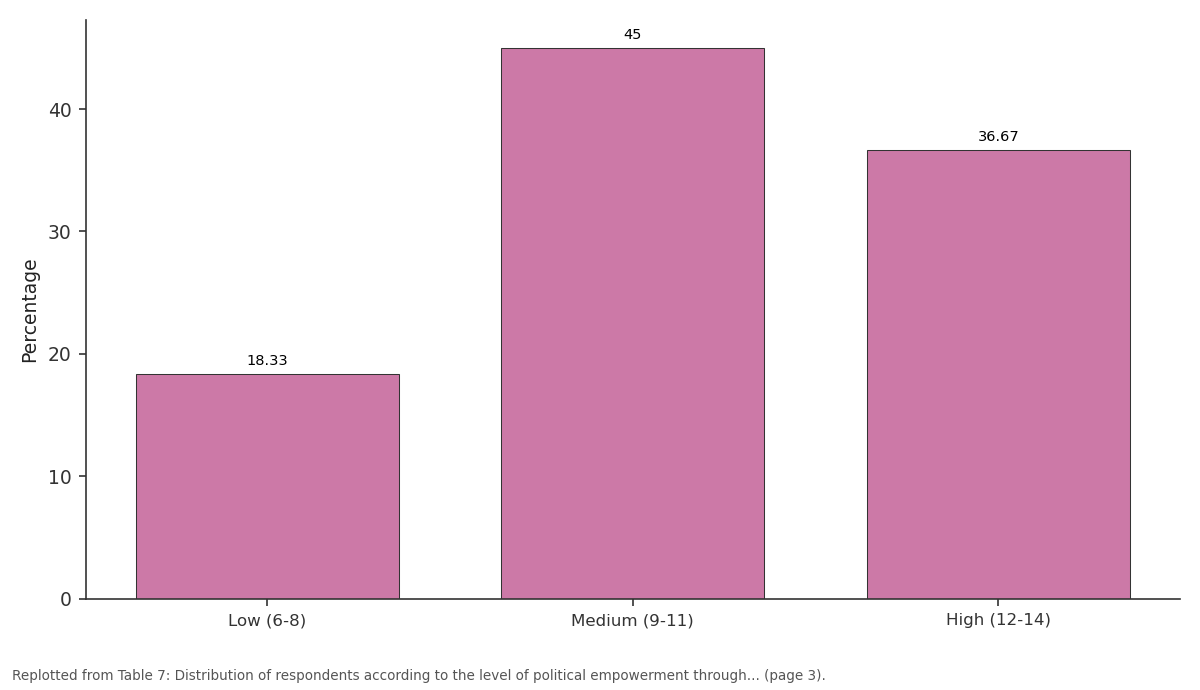
Percentage: Low (6-8) vs Medium (9-11) vs High (12-14)
Replotted from Table 7 (page 3) of the original paper. Every bar is the paper's own table value.
View source evidence ↗Figures & tables
From the original paper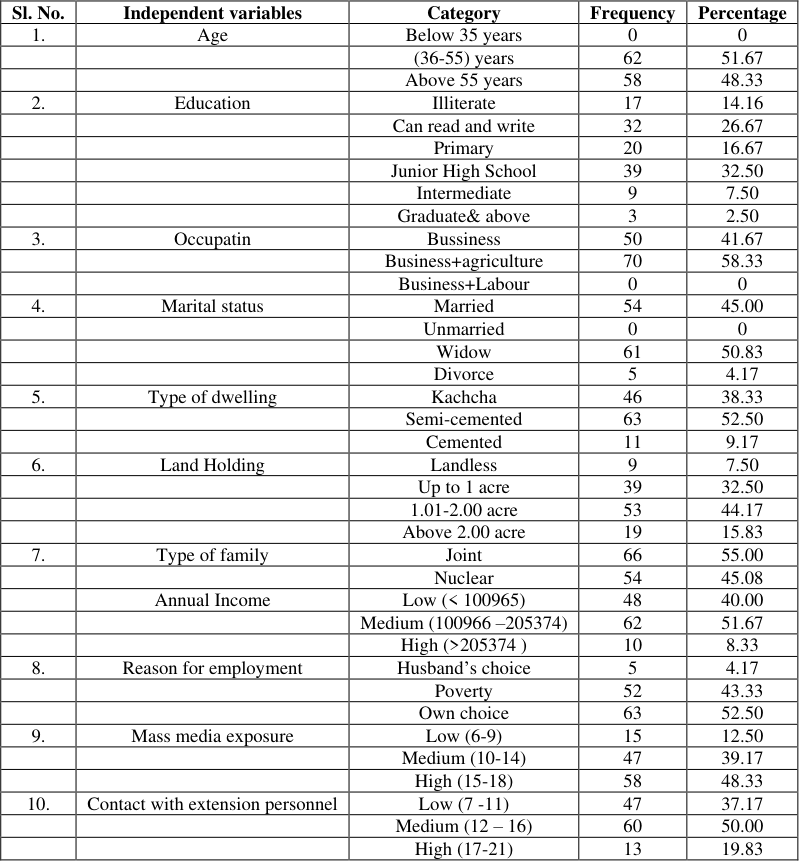 Table 1
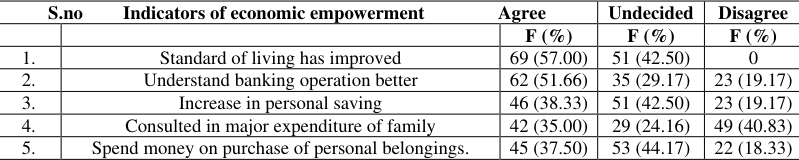 Table 2
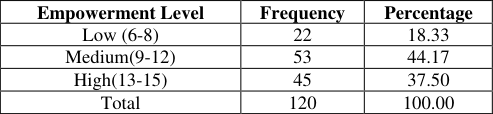 Table 3
 Table 4
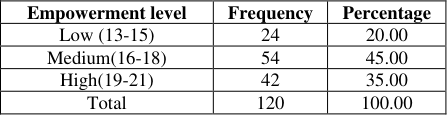 Table 5
 Table 6
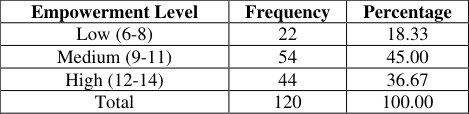 Table 7
 Table 8
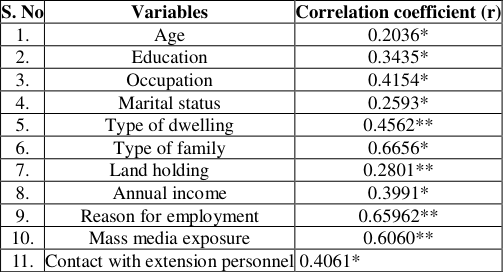 Table 11
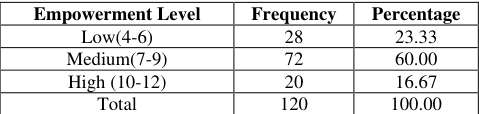 Table 9
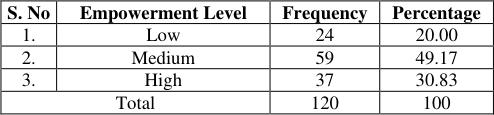 Table 10
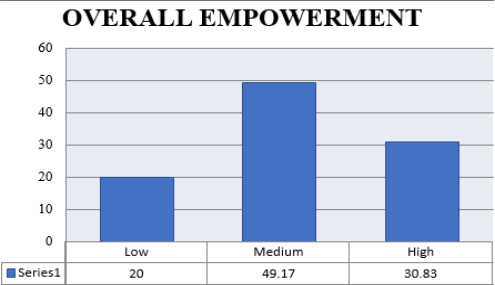 Figure 1
Introduction
A woman is identified as a mother, a wife, daughter-in-law or a daughter, but she is not identified as an independent person. Women constitute almost half of the population, perform nearly two-third of its work hours, receive onetenth of the world's income and own less than one hundredth of the world property. By the time a young girl has reached age of five years, she assumes adult responsibilities, both inside and outside of the household. Empowerment is a multi-faceted, multi-dimensional and multi-layered concept. Women empowerment is a process in which women gain greater share of control over resourcesmaterial, human and intellectual (knowledge, information and ideas) and financial resources and control over decision making in the home, community, society, and nation and to gain 'power'. According to a report of government of India, "empowerment means moving from a position of enforced powerlessness to one of power." In this process women should be empowered socially, economically, educationally and politically that can help them take self decision regarding education, mobility, economic independency, political participation and awareness to exercise rights.
Means of Empowerment
Ima market is one of the biggest markets of its kind in the world, where the whole market is run and controlled by women only. The word "Ima" in Manipuri translates to mother. This market is also known as Khwairamband bazaar. About 3500 women are carrying out their business on a regular basis. This market is an important trading spot for the people of the state. Majority of the women entrepreneurs involved in trading are due to obligation to support their families.
Research Methodology
Descriptive research design was followed for the present study. Imphal west district of Manipur was selected purposively for investigation of the study as the said women's market is situated at Imphal west district of the state.
Materials and Methods
A pre-tested structured interview schedule directed towards the objectives of the study was developed for primary data collection. The secondary data was obtained from books, journals, research paper, etc. The collected data were classified, tabulated, and analysed according to the objectives. www.extensionjournal.com The above Table 1. shows that majority i.e. 51.67 percent of the respondents are of middle age group, 32.50 percent of the respondents were educated up to junior high school, 58.33 percent of the respondents were involved in business as well as agriculture as occupation. Majority 50.83 percent of the respondents were widows, 55.00 percent of the respondents are from joint family, majority 52.50 percent of the respondents have semi-cemented housing pattern, 51.67 percent of the respondents have Rs 1,00,966 to Rs 2,05,374 as their annual income, 44.17 percent of the respondents have 1-2 acres of land. It was observed that 48.33 percent of the respondents had high level of mass media exposure, 50.00 percent of the respondents have medium level of contact with extension personnel. It was also observed that 52.5 percent of the respondent started the business as their own choice. The data pertaining to economic empowerment are presented in Table 2 which shows that only 57.00 percent of the respondents felt that their standard of living has improved after joining the market and 51.00 percent had better understanding of the banking system, 38.33 percent of women agreed that there was increase in personal saving. www.extensionjournal.com Table 3 representing the level of economic empowerment shows that majority (44.17%) of the respondents belong to the medium category of economic empowerment followed by 37.50 percent of respondents who belong to the high level category. Remaining 18.33 percent of the respondents were under the low level of empowerment category. In view with social indicator, 39.17 percent of the women agreed that there has been increase in participation regarding social activities, 70.00 percent women agreed that there has been increase in the participation in the social activities. 91.67 percent them improvement in social security. It has been observed that there had been significant increase in freedom to attend social functions and visit doctors.
| Empowerment Level | Frequency | Percentage |
|---|---|---|
| Low (6-8) | 22 | 18.33 |
| Medium(9-12) | 53 | 44.17 |
| High(13-15) | 45 | 37.50 |
| Total | 120 | 100.00 |
Table text extracted from the original PDF; superscript letters are shown inline. The original table image is below.
View original table image
| S.no Indicators of economic empowerment Agree | — | — | Undecided | Disagree |
|---|---|---|---|---|
| F (%) | F (%) | F (%) | ||
| 1. | Standard of living has improved | 69 (57.00) | 51 (42.50) | 0 |
| 2. | Understand banking operation better | 62 (51.66) | 35 (29.17) | 23 (19.17) |
| 3. | Increase in personal saving | 46 (38.33) | 51 (42.50) | 23 (19.17) |
| 4. | Consulted in major expenditure of family | 42 (35.00) | 29 (24.16) | 49 (40.83) |
| 5. | Spend money on purchase of personal belongings. | 45 (37.50) | 53 (44.17) | 22 (18.33) |
Table text extracted from the original PDF; superscript letters are shown inline. The original table image is below.
View original table image
| Sl. No. | Independent variables | Category | Frequency | Percentage |
|---|---|---|---|---|
| 1. | Age | Below 35 years | 0 | 0 |
| (36-55) years | 62 | 51.67 | ||
| Above 55 years | 58 | 48.33 | ||
| 2. | Education | Illiterate | 17 | 14.16 |
| Can read and write | 32 | 26.67 | ||
| Primary | 20 | 16.67 | ||
| Junior High School | 39 | 32.50 | ||
| Intermediate | 9 | 7.50 | ||
| Graduate& above | 3 | 2.50 | ||
| 3. | Occupatin | Bussiness | 50 | 41.67 |
| Business+agriculture | 70 | 58.33 | ||
| Business+Labour | 0 | 0 | ||
| 4. | Marital status | Married | 54 | 45.00 |
| Unmarried | 0 | 0 | ||
| Widow | 61 | 50.83 | ||
| Divorce | 5 | 4.17 | ||
| 5. | Type of dwelling | Kachcha | 46 | 38.33 |
| Semi-cemented | 63 | 52.50 | ||
| Cemented | 11 | 9.17 | ||
| 6. | Land Holding | Landless | 9 | 7.50 |
| Up to 1 acre | 39 | 32.50 | ||
| 1.01-2.00 acre | 53 | 44.17 | ||
| Above 2.00 acre | 19 | 15.83 | ||
| 7. | Type of family | Joint | 66 | 55.00 |
| Nuclear | 54 | 45.08 | ||
| Annual Income | Low (< 100965) | 48 | 40.00 | |
| Medium (100966 –205374) | 62 | 51.67 | ||
| High (>205374 ) | 10 | 8.33 | ||
| 8. | Reason for employment | Husband’s choice | 5 | 4.17 |
| Poverty | 52 | 43.33 | ||
| Own choice | 63 | 52.50 | ||
| 9. | Mass media exposure | Low (6-9) | 15 | 12.50 |
| Medium (10-14) | 47 | 39.17 | ||
| High (15-18) | 58 | 48.33 | ||
| 10. | Contact with extension personnel | Low (7 -11) | 47 | 37.17 |
| Medium (12 – 16) | 60 | 50.00 | ||
| High (17-21) | 13 | 19.83 |
Table text extracted from the original PDF; superscript letters are shown inline. The original table image is below.
View original table image
Results and Discussion
Results and Discussion
F-Frequency %-Percentage
In reference with political indicator, there has been significant increment in the casting of votes, 61.00 percent of the respondents agreed to have increase in attending political meetings, while 54.00 percent of the women accepted that they became more aware of the legal rights of women then earlier. In accordance to cultural indicator, 39.17 percent of the respondent felt they had gained more freedom to attend social gatherings. 28.33 percent of the women felt more included in taking decisions regarding son/daughter marriages while 55% felt no significant in the same. Among them 32.50 percent of the women felt more liberty to attend marriage ceremony. Table 9 shows that the majority (60.00%) of the respondents belongs to the medium category of cultural empowerment followed by 23.33 percent of respondents who belong to the low level category. Remaining 16.67 percent of the respondents were under the high level of empowerment category.
| Empowerment Level | Frequency | Percentage |
|---|---|---|
| Low(4-6) | 28 | 23.33 |
| Medium(7-9) | 72 | 60.00 |
| High (10-12) | 20 | 16.67 |
| Total | 120 | 100.00 |
Table text extracted from the original PDF; superscript letters are shown inline. The original table image is below.
View original table image
Overall empowerment level through the market
Overall empowerment of the in the Ima market is calculated by summing the value of low, medium and high categories and finding their mean with regard to the four dimensions i.e. economical, social, political and cultural empowerment indices and it is categorized as given below in Table 10. The data in table 10 revealed that 49.17 of the respondents belonged to medium category of empowerment. This was followed by 30.83 percent of the respondents appearing in high category of empowerment. The percentage of respondents appearing in low category of empowerment was found to be 20.00 percent. Based on the analysis of table 11 it was observed that several variables, are positively and significantly correlated with the empowerment of the women in the market. These variables include land holding, mass media exposure and reason for employment. The correlation was found to be statistically significant at a probability level 0.01%. Additionally, education, occupation and contact with extension personnel also positively and significantly correlated with the respondents' overall empowerment but at a slightly lower probability level of 0.05%.
| S. No | Empowerment Level | Frequency | Percentage |
|---|---|---|---|
| 1. | Low | 24 | 20.00 |
| 2. | Medium | 59 | 49.17 |
| 3. | High | 37 | 30.83 |
| Total | 120 | 100 |
Table text extracted from the original PDF; superscript letters are shown inline. The original table image is below.
View original table image
| S. No | Variables | Correlation coefficient (r) |
|---|---|---|
| 1. | Age | 0.2036* |
| 2. | Education | 0.3435* |
| 3. | Occupation | 0.4154* |
| 4. | Marital status | 0.2593* |
| 5. | Type of dwelling | 0.4562** |
| 6. | Type of family | 0.6656* |
| 7. | Land holding | 0.2801** |
| 8. | Annual income | 0.3991* |
| 9. | Reason for employment | 0.65962** |
| 10. | Mass media exposure | 0.6060** |
| 11. | Contact with extension personnel | 0.4061* |
Table text extracted from the original PDF; superscript letters are shown inline. The original table image is below.
View original table image
Conclusion
It was concluded that majority of the respondents are of middle age group and attended junior high school, are from joint family, have semi-cemented housing pattern, are engaged in business along with agriculture, having Rs 1,00,966 to Rs 2,05,375 as their annual income, have above 1 acre -2 acres of land, have high level of mass media exposure and medium level extension personnel. Majority of the respondent belonged to the medium level category of empowerment. The factors influencing the empowerment of the women are education, occupation, housing pattern, annual income, land holding, mass media exposure and contact with extension personnel, which were directly correlated.
Figures and tables from the paper
| S. No | Indicators of social empowerment | Agree F (%) | Undecided F (%) | Disagree F (%) |
|---|---|---|---|---|
| 1. | Increase in participation in discussion about social activities. | 47 (39.17) | 35 (29.17) | 38 (31.66) |
| 2. | Participation in social development programmes has increased. | 84 (70.00) | 35 (29.17) | 1 (0.83) |
| 3. | Participate in public speaking | 35 (29.17) | 45 (37.50) | 40 (33.33) |
| 4. | Awareness on social problems | 82 (68.33) | 35 (29.17) | 24 (20.00) |
| 5. | Free to attend social social functions | 113 (94.17) | 7 (5.83) | 0 |
| 6. | Feeling social security | 110 (91.67) | 10 (8.33) | 0 |
| 7. | More freedom to visit doctors | 83 (69.17) | 37 (30.83) | 1 (0.83) |
Table text extracted from the original PDF; superscript letters are shown inline. The original table image is below.
View original table image
| Empowerment level | Frequency | Percentage |
|---|---|---|
| Low (13-15) | 24 | 20.00 |
| Medium(16-18) | 54 | 45.00 |
| High(19-21) | 42 | 35.00 |
| Total | 120 | 100.00 |
Table text extracted from the original PDF; superscript letters are shown inline. The original table image is below.
View original table image
| S. No | Indicators of political empowerment | Agree F (%)) | Undecided F (%) | Disagree F (%) |
|---|---|---|---|---|
| 1. | Cast votes | 120 (100) | 0 | 0 |
| 2. | Support political parties | 84 (70.00) | 22 (18.33) | 14 (11.67) |
| 3. | Awareness to legal rights of women | 54 (45.00) | 20 (16.67) | 46 (38.33) |
| 4. | Attending political meetings | 61 (50.83) | 51 (42.50) | 8 (6.67) |
| 5. | Contested in panchayat election | 0 | 1 (0.83) | 119 (99.17) |
Table text extracted from the original PDF; superscript letters are shown inline. The original table image is below.
View original table image
| Empowerment Level | Frequency | Percentage |
|---|---|---|
| Low (6-8) | 22 | 18.33 |
| Medium (9-11) | 54 | 45.00 |
| High (12-14) | 44 | 36.67 |
| Total | 120 | 100.00 |
Table text extracted from the original PDF; superscript letters are shown inline. The original table image is below.
View original table image
| S. No | Indicators of cultural empowerment | Agree F (%) | Undecided F (%) | Disagree F (%) |
|---|---|---|---|---|
| 1. | Freedom to attend social gathering | 47 (39.17) | 51 (42.5.0) | 22 (18.33) |
| 2. | Decision regarding marriage of sons/ | 34 (28.33) | 66 (55.00) | 20 (16.67) |
| 3. | Daughters Freedom to visit religious places | 17 (14.17) | 37 (30.83) | 66 (55.00) |
| 4. | Liberty to attend marriage ceremony | 39 (32.50) | 58 (48.33) | 23 (19.17) |
Table text extracted from the original PDF; superscript letters are shown inline. The original table image is below.
View original table image
References
9 in the original paper- Barua I, Devi A. Women's market of Manipur: An anthropo-historical perspective. J Hum Ecol. 2004;15(2):129-133.
- Jayarani L, Singh MK, Chaudhary KP, Ram D. Entrepreneurship behaviour of women entrepreneurs in Imphal of Manipur. Indian Res J Ext Edu. 2013;13(2):31-35.
- Rukhsana S. Empowerment of rural women through self-help groups (SHGs) in Allahabad district of Uttar Pradesh [Ph.D. thesis]. Allahabad: SHIATS; 2015.
- Tekale VS, Bhalekar DN, Shekh JI. Entrepreneurial behaviour of dairy farmers. Indian J Ext Edu. 2013;9(32&36):53-61.
- Thangamani S, Muthuselvi S. A study on women empowerment through self-help groups with special reference to Mettupalayam Taluk in Coimbatore district. IOSR J Bus Manag. 2013;8(6):17-24.
- Gehlot A. Women empowerment: Issues and challenges. Int J Indian Psychol. 2014;4(3):150-161.
- Bansal V, Joshi V, Solanki D, Subhasli M. Empowerment of rural women through self-help groups of Udaipur district. Indian Res J Ext Edu. 2015;1(1):1116.
- Nandini R, Sudha. A study on women empowerment through self-help groups with special reference to Ram Nagar district, Karnataka. BIMS Int J Soc Sci Res. 2014:7-15.
- Boruah R, Borua S, Deka CR, Borah D. Entrepreneurial behavior of tribal winter vegetable growers in Jorhat district of Assam. Indian Res J Ext Edu. 2016;15(1):6569.