
Research article · 2024 · Full text
International Journal of Geography Geology and EnvironmentLevel of human resource development and disparities in Jaunpur district, Uttar Pradesh
Volume 6(1) · Pages 18–25 · DOI: 10.22271/27067483.2024.v6.i1a.197 ↗
Research areasAgricultural risk and resilience
Abstract
Author-writtenThis paper attempts to deal with the analysis of Human Resource development and disparities in Jaunpur district of Uttar Pradesh. The study area is situated in Eastern Uttar Pradesh of the Middle Ganga Plain. The study is exclusively based on secondary data collected at block level from different offices. The data were tabulated and analyzed using statistical methods, like mean, standard deviation (SD), Z score. Micro Soft excel and Arc GIS 10.2 software have been used for computation and cartographic presentation. There are 13 variables selected social sectors to measure the regional disparities in the levels of development. The geographical factors like terrain condition, quality of soil, drainage, water logging, transport network and urban centers have been observed to held major impact in the level of development in district. Dharmapur, Baksha, Ramnagar, Jalalpur, Sujanganj and Muftiganj have recorded under the high level of HRD while Mungra Badshahpur, Machhalishahar, Suithakala and Shahganj blocks recorded low level developed blocks with 25.82 percent area of district and rest of the block observed in a medium level of development which covers the 50.82 percentage area.
Summary
Source-checkedPlain-language reading of the full paper, prepared with AI and checked against the text. Each point links to the authors' own words.
Why it matters
- Human resources are critical for a country's socio-economic development, making it essential to understand population resources to foster regional growth. View evidence ↗
- A large population only serves as an asset if it is converted into productive human capital; otherwise, it can negatively impact living conditions and development. View evidence ↗
What they did
- The research relied exclusively on secondary data obtained from government offices, including the 2011 Primary Census Abstract of Uttar Pradesh and the District Census Handbook. View evidence ↗
- Data analysis was performed using mean, standard deviation, and Z-scores, with Microsoft Excel and Arc GIS 10.2 used for computation and mapping. View evidence ↗
What they found
- The population density of the district increased from 969 to 1,113 persons per sq. km between 2001 and 2011. View evidence ↗
- Between 2001 and 2011, Jaunpur's population growth rate was 14.89%, which was lower than both the state (20.23%) and national (17.70%) averages. View evidence ↗
- The overall literacy rate in the area is 70.92%, with a significant gender gap of 24.93% between male literacy (83.40%) and female literacy (58.80%). View evidence ↗
- The total working population comprises 39% of the total population, with males making up 88.45% and females 11.55% of the workforce. View evidence ↗
- High levels of human resource development were found in 23.36% of the district's area, specifically in the Dharmapur, Baksha, Ramnagar, Jalalpur, Sujanganj, and Muftiganj blocks. View evidence ↗
- Low levels of development were recorded in 25.82% of the district's area, including the Mungra Badshahpur, Machhalishahar, Suithakala, and Shahganj blocks. View evidence ↗
- The remaining 50.82% of the district's area is categorized as having a medium level of human resource development. View evidence ↗
What it means
- The authors conclude that blocks with low development can improve their status by increasing social infrastructure, such as schools and health services, and implementing awareness programs. View evidence ↗
Visual summary
2 visualsIllustrations explain the paper; charts are replotted from the paper's own table values.
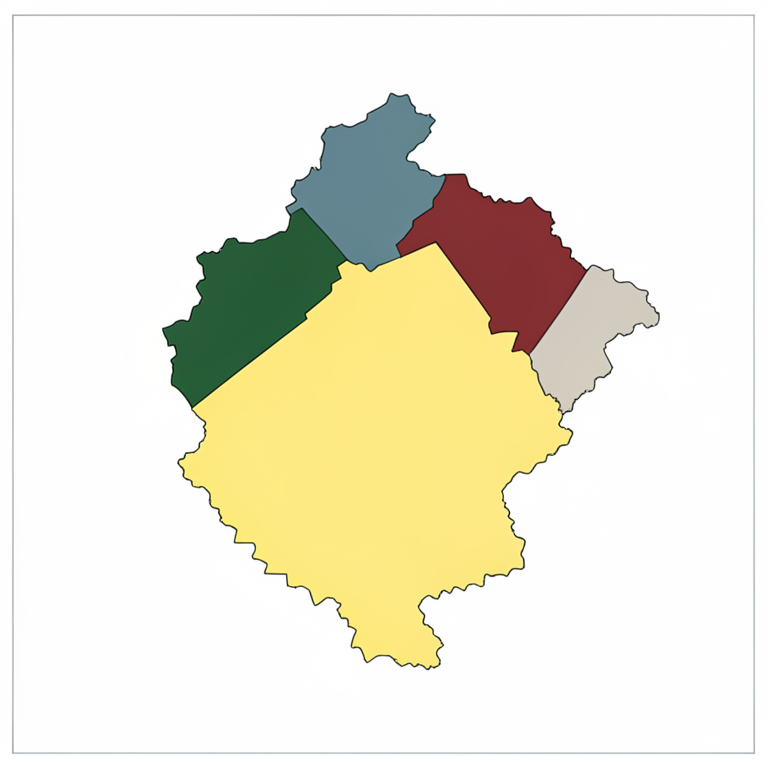
HRD Distribution Overview
AI-generated conceptual illustration (A map of Jaunpur district, Uttar Pradesh). It explains the idea and does not show study data.
View source evidence ↗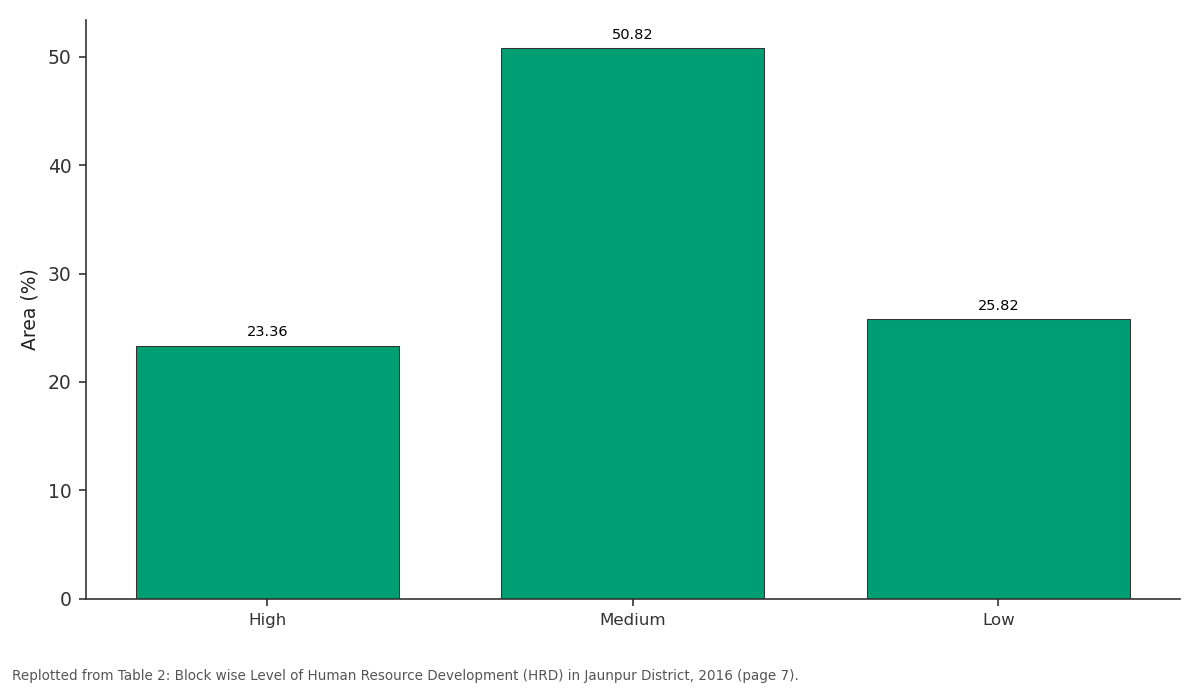
Blocks / Area: High vs Medium vs Low
Replotted from Table 2 (page 7) of the original paper. Every bar is the paper's own table value.
View source evidence ↗Figures & tables
From the original paper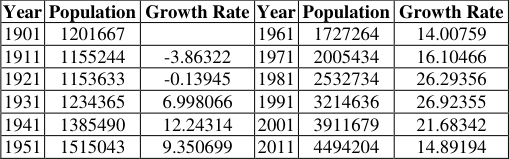 Table 1
 Table 2
Introduction
Natural and human resources development are the basis of development of any region, but the importance of natural resources depends on the human power and capacity of the region (Kayastha, 1998) [11] , because resources are not they become (Zimmerman, 1951) [23] . All other resources get their meaning and importance from man because it is man who uses the physical landscape and create the cultural landscape (Sandanshiv, 2009) [15] . Resource development is the planned use of the resources provided by nature, with the help of his intelligence, discretion, knowledge and technology (Treewartha, 1985) [20] . In this context, since the resources of the natural environment are determined by the technological level of the population, humans are used as pillars in the utilization, conservation, planning and development plans of various resources. Human is an important element in the process of socio-economic development of a country, hence knowledge of the population resources of any area is essential for the development of that area. Population is the basic resource which has an impact on the overall development of an area and local level planning (Zelinsky, 1971) [22] . The importance of human resources and regional and global development can be recognized from the fact that out of the 8 Millennium Development Goals proposed by the United Nations at the beginning of the 21 st century, which were to be achieved by 2015, three goals were taken in the context of population. It is also clear in a report of the United Nations that the large population of an area can be understood as an asset only as long as it can be transformed into productive human capital, otherwise it will affect the living conditions of the concerned area and also negatively affect the development. The United national development program measures the Human Development Index (HDI) each year of different countries on the basis of life expectancy at birth, expected year of schooling, mean years of schooling and per capita gross national income. In 2021 the Switzerland, Norway and Iceland are the top HDI scorer country while India got the 130 th rank with the score of 0.663. The same fact in mind, various aspects of human resources such as population distribution, population growth, density, literacy, sex ratio, occupational structure, etc. have been evaluated in this Paper.
Foreign scholars like Triwartha (1960) [20] , Zelinski (1971) [22] , Clarke (1972) [4] , Taylor (1972) [19] , Stanford (1972) [18] , Gould (2009) [8] , Ehrlich and Ehrlich (1996) [6] , Potson and Michel (2005) [14] and Indian scholar like Kaystha (1998) [11] , Shrinivasan (1998) [17] , Pathak (1998) [13] , Sinha (2001) [16] , Chandana (1980) [2] , Ghosh (1985) [7] . Dixit (2003) [5] , Bhende (2003) [1] , Hassan (2005) [9] , Sandashiv et al. (2009) [15] , Kundu and Mondal (2012) [24] , Raman and Reena (2012) [25] , Singh (2013) [26] , Mishra and Singh (2016) [12] mention human resource development in his research.
Study area
Jaunpur district (25˚ 26' N to 26˚ 11'N and 82˚ 8' E to 83˚ 5' E) is situated in Eastern Uttar Pradesh of the Middle Ganga Plain. Total area of the district is 4038 km 2 having population of 44, 94, 204 persons (Census 2011). There are eight rivers which flow in the district namely Gomati, Sai, Varuna, Basuhi, Pili, Tambura, Mongar and Gangi. The Gomati and Sai Rivers flow in middle part of the district (Fig. 1). Physiographically Jaunpur is divided into five part such as Gomati new alluvium, Sai new alluvium, northern tract, central tract (between Gomati and Sai River) and southern tract (between Sai and Varuna River). The surface of district is about flat and some undulation is seen in the part of riverine areas. The slope of the district is towards the south east and relief varies from 77 metres to 89 metres from mean sea level. The district is covered by mainly two type of soils like loam (Domat) and clay (Matiyar). The loamy soil is found in Jaunpur, Kerakat and some parts of Shahganj Tahsil. Clay soil is found in Shahganj, Machhalishahar and Kerakat Tahsil.
Objectives
The major objectives of the study are as follows: 1. To measure the level of human resource development in Jaunpur District. 2. To analyze the inter block disparities in the level of development and their spatial pattern.
Data base and methodology
The present study is exclusively based on secondary data collected from the different government offices like Primary Census Abstract of Uttar Pradesh (2011), District Census Handbook Zila Sankhikiya Patrika from Vikas Bhavan and different websites. The data were tabulated and analyzed by using statistical methods, like mean, standard deviation (SD) and inter correlation matrix. Mean and SD methods have been used for dividing the blocks into three categories, i.
Analysis and Discussion
The identification of backward blocks stands as prime concern of present investigation so that these blocks could be taken into consideration for upgrading their status to remove regional disparity of human development. The blocks that are highly developed in terms of social, economic and demographic factors can be considered for maintaining their status, obtaining optimum land use and increase agricultural efficiency.
Spatial Distribution of Population
The population distribution pattern determines the extent to which humans have adjusted or modified the physical environment and why they have chosen or left areas to live. According to census 2011 the total population of Jaunpur district is 4,494,204 with 4,147,624 rural population which is 92.29% of the total population. It is clear that the significant population of the study area is rural which depends on agriculture and the distribution of population depends on arable land, irrigation sources, transportation facility, and other social-economic factors. On the basis of the map, the population distribution pattern fallows the plain area type pattern. Most of the population lives in the city and near to the market. The high concentration of population can be seen in old floodplain zonal blocks like Sirkoni Karanjakala and Dharmapur and followed by Tahsil level blocks like Shahganj, Kerakat, Mariyahu, Machhalishahar, Badlapur and moderate concentration is seen in new floodplain zonal block. The waterlogged area, revinous area, and bank of the river are the less population concentrated area (Fig. 2).
Population Concentration Index (PCI)
Population concentration index is the ratio between the actual population and optimum population of any area, where places have a high concentration of population called as overpopulation, and many places which are less populated named as under population. Both of the situations are harmful because in under population humans cannot use the total resource of the area and in overpopulation struggle by lack of resources. On the basis of this formula, we have categorized all blocks in three categories as over-concentration, optimum concentration, and under concentration. Dharmapur, Karanjakala, Khuthan, Ramnagar, Dobhi, Baksha, Sirkoni, and Sikrara are categorized as overpopulated blocks because some blocks are near to the city and some blocks have mad fertile land, etc. Kerakat, Rampur, Jalalpur, and Badlapur blocks fall in optimum concentration. These are mediumsized blocks, and man has optimum land while Mariyahu, Shahganj, Muftiganj, Sujanganj, Suithakala, Mahrajganj, Mungra Badshahpur, Barsathi, and Machhalishahar are noted in low concentrated area. These blocks are big in size and have less population (Fig. 3A).
Density
Density
Physiological Density
A more explicit representation of population pressure and economic situation is possible by Physiological density because it expresses the ratio of population to agricultural land. According to the census 2011, the physiological density of the district is 1520 persons per 100 ha NSA. Karanjakala, Khuthan, Sirkoni, Dharmapur, Shahganj, Sikrara, Ramnagar have high pressure on arable land of population because most of the blocks have high population pressure and some block have less arable land. Moderate physiological density found in Kerakat, Baksha, Rampur, Jalalpur, Dobhi, Suithakala, and Badlapur block while Mariyahu, Barsathi, Sujanganj, Muftiganj, Mahrajganj, Machhalishahar, and Mungra Badshahpur have more arable land compares to other blocks.
Population Growth
Population growth refers to the change in the number of people residing in a particular area over a given period of time and this change may be positive or negative. The growth rate of Jaunpur is 14.89 percent between 2001 and 2011, which is lower than Uttar Pradesh (20.23) and India (17.70). Table 6.1 shows the trend of the growth rate of Jaunpur district from 1901 to 2011. There is a negative growth rate till 1921 than it is continues to increase till 1991 and record the highest growth rate of 26.92 percent after this, the growth is falling down till 14.89 percent. The spatial pattern of growth rate varies between 5.71 to 23.98 percent. Lowest growth rate is recorded in Barsathi because of high migration and lower health facility but higher growth rate noted in Shahganj block because of low migration of people an immigration of people in the urban area. Here many low-level industries and two urban areas, namely Khetasarai and Shahganj and health facility are in better quality. Shahganj, Suithakala, Mungra Badshahpur, Machhalishahar, Karanjakala, Khuthan, and Sikrara noted as higher growth rated block and Sirkoni, Badlapur, Dobhi, Sujanganj, Mahrajganj, Kerakat, Mariyahu, and Muftiganj noted in the moderate category. At the same time, Baksha, Jalalpur, Ramnagar, Rampur, Dharmapur and Barsathi counted in lower growth rate (Fig. 3C).
Sex Ratio
According to the 2011 census, the study area has a registered sex ratio of 1034 female /1000 male of the rural area, which is higher than the national average and state average both. The main reason for the high sex ratio in the district is the lack of employment opportunities, mainly the male population migrating to other urban areas for employment. The spatial distribution of sex ratio varies from 1108 to 990. High sex ratio is observed in Barsathi, Muftiganj, Mariyahu, Machhalishahar, and Kerakat blocks because of Tahsil level blocks and nearer block of urban area where male dose not migrate towards the city area for employment. Apart from these reasons, low social status, lack of proper attitude towards female infants, improper nutrition, lack of health facilities, low age at marriage, and maternal mortality are also the cause of low sex ratio. Rampur, Ramnagar, Baksha, Sujanganj, Jalalpur, Dharmapur, Dobhi, Mungra Badshahpur, Badlapur, Mahrajganj have a moderate ratio between male and female in the eastern and western part of the district while northern and central blocks like Khuthan, Sikrara, Suithakala, Shahganj, Sirkoni, Karanjakala blocks noted low sex ratio because of low migration of male in the big urban area and selective immigration of male population. Due to this, the number of males is found here more than in other development blocks. Apart from this, due to lack of socioeconomic services in these areas, the female population is also affected and the sex ratio is reduced (Fig 3D). There are positive and negative changes that reflect at the block level in Jaunpur district. High positive change (Above 1.69 percent) in sex ratio found in Barsathi, Baksha, Ramnagar, Mungra Badshahpur, Rampur, Machhalishahar and Badlapur due to increasing the level of education, health and women condition while low change (below 0.12 percent) was found in Muftiganj and negative change found in Kerakat, Dobhi, Sirkoni, Sujanganj, Dharmapur, Khuthan, Jalalpur, Shahganj blocks. In these blocks, most of the bocks have Tahsil headquarters and urban areas, and males do not migrate to the metropolitan areas.
Literacy: Literacy is a qualitative element of the population, which is a reliable indicator of socio-economic development of any region (Chandana and Siddhu, 1980) [2] . According to the Indian Census, a person will be considered literate only if he is seven years of age and able to read and write a statement comprehensively. Overall literacy in the study area is 70.92 percent and separate record as 83.40 percent male literacy while female literacy is 58.80 percent. So, the gap between male and female literacy is 24.93 (Fig. 6.3 D). This is a high percentage gap and is not quite good for any region with focus on development. High literacy (above 71 percentage) found in Jalalpur, Baksha, Sirkoni, Sujanganj, Sikrara, Badlapur, Mahrajganj, Kerakat, and Dobhi block. These blocks lie both sides of Gomati and Sai River. Moderate literacy (71-70 percent) is noted in Khuthan, Ramnagar, Mariyahu, Karanjakala, Mungra Badshahpur, and Muftiganj, which are lies both sides of the river in old floodplain zone and low literacy observed in depress zonal blocks like Rampur, Barsathi, Suithakala, Shahganj, and Machhalishahar which are the far area from the main urban region and part of OFZ II and depressed law land zone (Fig. 4A).
The positive change in the literacy rate of any area reflects the social and economic development. There is 16.07 percent positive change in literacy in the Jaunpur district between 2001 and 2011. The table shows that big change is (More than 16.94 percent) found in Karanjakala, Mahrajganj, Sujanganj, Rampur, Ramnagar, Shahganj due to an increase in the quantity and quality of education facility with local awareness of people for education while the Low change in Khuthan, Dobhi, Sikrara, Machhalishahar, and Sirkoni. Sirkoni have already a high literacy rate (Fig. 4B). It is clear that necessary efforts have been made spared the literacy rate development of the entire region, but the in difference of rural people, the rapidly increasing population and lack of proper education facilities affect the low literacy rate.
Female Literacy
The consequences of literacy on women has a ripple effect beginning from the individual level to the national level human resources. In this category female, old mans and children are included. There is 68.24 percent population, dependent in 2001 while in 2011 it had decreased to 67.72 percent, but the number of dependent populations has increased. The main cause of increasing the number of nonworkers is high population growth and improved medical services for an older man.
Household Worker
The household industries counted under secondary economic activity and the pattern of these industries developed a possibility of small-scale industrial areas. A total of 5.82 percent of workers of total workers are engaged in the household industries like bidi making, perfume, rolled gold jewelry, and another household industry. The distribution pattern of the household worker in percent are uneven like Sujanganj, Rampur, Ramnagar, Baksha, Dharmapur, Suithakala, Jalalpur, and Barsathi have high percent while Mariyahu, Mungra Badshahpur, Badlapur, Kerakat, Mahrajganj, Karanjakala, Khuthan, Muftiganj, and Shahganj have a low percentage of these type of worker and remaining block categorizes as a moderate percentage of household worker. There are 6.8 percent positive change found in household industries. high positive change in Sirkoni, Sujanganj, Badlapur, Baksha, Dobhi, Suithakala and Muftiganj due to urbanization while negative change shows in Machhalishahar, Mungra Badshahpur, Mahrajganj, Sikrara, Ramnagar, Shahganj, Karanjakala, Barsathi, Rampur and Dharmapur due to migration and communicational development.
Other Workers
All those workers other than cultivators or agricultural labourers or household industry workers are other workers (Census of India 2011). Total 22.90 workers of total worker are engaged in other economic activities. The central part of blocks near to Jaunpur city, namely Sirkoni, Baksha, Dharmapur, Dobhi, Kerakat, and Jalalpur have a high percent while distanced block like Ramnagar, Barsathi, Machhalishahar, Shahganj, Suithakala, Rampur, Khuthan and Mahrajganj have a low percentage of other workers. There is 69.89 percent positive change in other workers in the Jaunpur district between 2001 and 2011 due to modernization, increase literacy and migration. The table shows that Sirkoni, Suithakala, Baksha, Machhalishahar, and Badlapur while Barsathi, Ramnagar, Mahrajganj, Shahganj, Khuthan, Rampur and Dharmapur counted in low changing category and rest of the blocks are categorized in the moderate category.
Level of Human Resource Development
Zimmermann had a clear view that elements found in any area cannot be declared as resources until they become for human use. Humans have a special necessity of knowledge, need, and understanding for use the natural element as a resource. The development of human as resource development of knowledge, understanding, feeling, etc. are most important. There are many disparities in the development of human resources at the micro-level in the area of study, therefore, to measure this inequality we have chosen the 13 types of variables (Nine positives and four negatives) like Sex Ratio (X1), Population Concretion Index(X2), Density(X3), Literacy(X5), Female Literacy (X6), Total Worker (X7), Main Worker (X8), Househod Worker (X10) and Other Worker (X11) are the positive variables while Growth Rate(X4), Marginal Worker (X9) treated as negative variable which related to human and measure the level of development by Z score methods. It mentioned earlier.
There are 23.36 percent area of the district having high level of human developed like Dharmapur, Baksha, Ramnagar, Jalalpur, Sujanganj and Muftiganj have recorded under the high level of HRD while Mungra Badshahpur, Machhalishahar, Suithakala and Shahganj blocks recorded low level developed blocks with 25.82 percent area of district and rest of the block observed in a medium level of development which covers the 50.82 percentage area (Fig. 6.6). Here we cannot ignore the effect of the modernization of communication and Transport system for human resource development because high-level migration also happened in the district for about the last decade. Those blocks which have urbanization effect have high developed blocks, but the which block have less availability of infrastructure fall in low developed area (Fig. 6).
Conclusion
Human is an important element in the process of socioeconomic development of a country, hence knowledge of the population resources of any area is essential for the development of that area. The Z score method can measure the level of human resource development and analyze the inter block disparities in the level of development and their spatial pattern of any area. In the final result, the 23.36 percent area of the district having high level of human developed while Mungra Badshahpur, Machhalishahar, Suithakala and Shahganj blocks recorded low level developed blocks with 25.82 percent area of district and rest of the block observed in a medium level of development which covers the 50.82 percentage area. The result is based on urbanization and social infrastructure of the area. The low development block can develop, if the social infrastructure like school, health services etc. has been increased. The awareness program also increases the level of development.
Figures and tables from the paper
| Year | Population | Growth Rate | Year | Population | Growth Rate |
|---|---|---|---|---|---|
| 1901 | 1201667 | 1961 | 1727264 | 14.00759 | |
| 1911 | 1155244 | -3.86322 | 1971 | 2005434 | 16.10466 |
| 1921 | 1153633 | -0.13945 | 1981 | 2532734 | 26.29356 |
| 1931 | 1234365 | 6.998066 | 1991 | 3214636 | 26.92355 |
| 1941 | 1385490 | 12.24314 | 2001 | 3911679 | 21.68342 |
| 1951 | 1515043 | 9.350699 | 2011 | 4494204 | 14.89194 |
Table text extracted from the original PDF; superscript letters are shown inline. The original table image is below.
View original table image
| Category | HRD Z Score | Blocks | — | — |
|---|---|---|---|---|
| Area | Number | Name | ||
| High | Above 0.20 | 23.36 | 6 | Dharmapur, Baksha, Ramnagar, Jalalpur, Sujanganj, Muftiganj |
| Medium | -0.20 - 0.20 | 50.82 | 11 | Dobhi, Sikrara, Kerakat, Badlapur, Mariyahu, Sirkoni, Barsathi, Karanjakala, Khuthan, Rampur, Mahrajganj |
| Low | Below -0.20 | 25.82 | 4 | Mungra Badshahpur, Machhalishahar, Suithakala, Shahganj |
Table text extracted from the original PDF; superscript letters are shown inline. The original table image is below.
View original table image
References
10 in the original paper- Hassan MI. Population Geography. New Delhi: Rawat Publication. 2005;14:152.
- Hazara A. Gender Disparity in Education. Yozana. 2009;58(11):32-35.
- Mishra N, Singh MB. Spatial analysis of micro-regional disparity in level of development: A case study of Saharasa District, Bihar. Nat Geogr J India. 2016;62(2):157-172.
- Sandanshiv LP. Regional Disparities in Human Resource Development in Western Satapura Region of India. Sodh Shamiksha Evam Mulyankan. 2009;II(6):844-846.
- Sinha BRK. Urban-Rural Differences in Human Resource Development in West Bengal. Annals of the National Association of Geographers, India. 2001;XXI(1):87-99.
- Treewartha GT. Geography of Population: World Patterns. New York: Pergamon Press, John Wiley; 1960-85.
- Zelinsky W. The Hypothesis of the Mobility Transition. Geographical Review. 1971;61(2):219-249.
- Mondal A, Kundu S, Mukhopadhyay A. Rainfall trend analysis by Mann-Kendall test: A case study of northeastern part of Cuttack district, Orissa. International Journal of Geology, Earth and Environmental Sciences. 2012;2(1):70-8.
- Raman R, Kumari R. Regional disparity in agricultural development: A district level analysis for Uttar Pradesh. Journal of regional development and planning. 2012;1(2):71-90.
- Singh MR. Enhancement of the second-harmonic generation in a quantum dot-metallic nanoparticle hybrid system. Nanotechnology. 2013;24(12):125701.