
Research article · 2024 · Full text
International Journal of Geography Geology and EnvironmentChanges in child sex ratio of Punjab: A spatio-temporal observations
Volume 6(1) · Pages 258–268 · DOI: 10.22271/27067483.2024.v6.i1d.230 ↗
Research areasDemographic Trends and Gender PreferencesGlobal Maternal and Child HealthMigration and Labor Dynamics
Abstract
Author-writtenThe present study is an attempt to examine the decadal changes in child sex ratio of every group of population of Punjab i.e., total, rural and urban. To analyse the temporal changes in child sex ratio of Punjab the Census data of 1991, 2001 and 2011 has been used. In present study, the changes in child sex ratio of Punjab over the decades have been analysed at the tehsil-level. Further, the study identifies the factors responsible for such decadal variations found in this context. It has been observed that the child sex ratio of the state has sharply declined during 1991-2001. This decade witnessed rapid spread of sex-determination techniques in the entire country especially in the north-western states. Among these states, Punjab was forerunner to adopt these techniques leading to female foeticide. The study found that relatively high practice of sex-selective abortion due to mushrooming of private ultrasound and abortion clinics in the state were mostly responsible for decline of child sex ratio during 1991-2001. In addition to it, the late implementation of the PNDT Act in the study area led to a notable decline in child sex ratio during this decade. During the next decade (2001-2011), an improvement has been observed in this regard. The urban areas of the state experienced relatively high improvement in child sex ratio as compared to their rural counterparts during this period. It has been observed that the highest rise in child sex ratio during this decade was reported in Doaba as compared to Majha and Malwa.
Summary
Source-checkedPlain-language reading of the full paper, prepared with AI and checked against the text. Each point links to the authors' own words.
Why it matters
- A patriarchal culture in Punjab promotes a strong preference for sons, as they are viewed as the primary means of achieving social survival and socio-economic security. View evidence ↗
- The child sex ratio in Punjab has shown a severe long-term decline, dropping from 901 in 1961 to 846 by the 2011 census. View evidence ↗
- The introduction of reproductive sex-selective technologies, starting with the first ultrasound clinic in the late 1970s, has widened the gender gap in Punjab. View evidence ↗
The question
- The study aims to examine decadal changes in the child sex ratio across total, rural, and urban population groups in Punjab. View evidence ↗
- The research seeks to identify the specific factors responsible for the observed decadal variations in the child sex ratio. View evidence ↗
What they did
- The study utilized Census data from 1991, 2001, and 2011, using tehsils as the primary units of analysis. View evidence ↗
- Spatio-temporal changes were analyzed using choropleth maps and various graphical methods to represent trends. View evidence ↗
What they found
- Between 1991 and 2001, all twenty districts saw a decline, with Fatehgarh Sahib showing the highest drop (108 points) and Muktsar the lowest (44 points). View evidence ↗
- Regional analysis showed that all districts in the Majha region had relatively low child sex ratios, while no districts in the Doaba region fell into this low category. View evidence ↗
- Between 1991 and 2005, dowry deaths increased by 200% (from 51 to 153) and dowry harassment increased by over 3000% (from 11 to 378), pressuring families to avoid female children. View evidence ↗
- The improvement observed between 2001 and 2011 is linked to government policies such as the Balri Rakshak Yojana (2005), Nanhi Chhaan scheme (2008), and Mai Bhago Vidhya Scheme (2011). View evidence ↗
What it means
- The authors conclude that while there was improvement from 2001-2011, it did not meet expectations and remained low compared to the national average. View evidence ↗
- The authors state that overall, the state experienced a decline in the child sex ratio despite various socio-economic developments. View evidence ↗
Figures & tables
From the original paper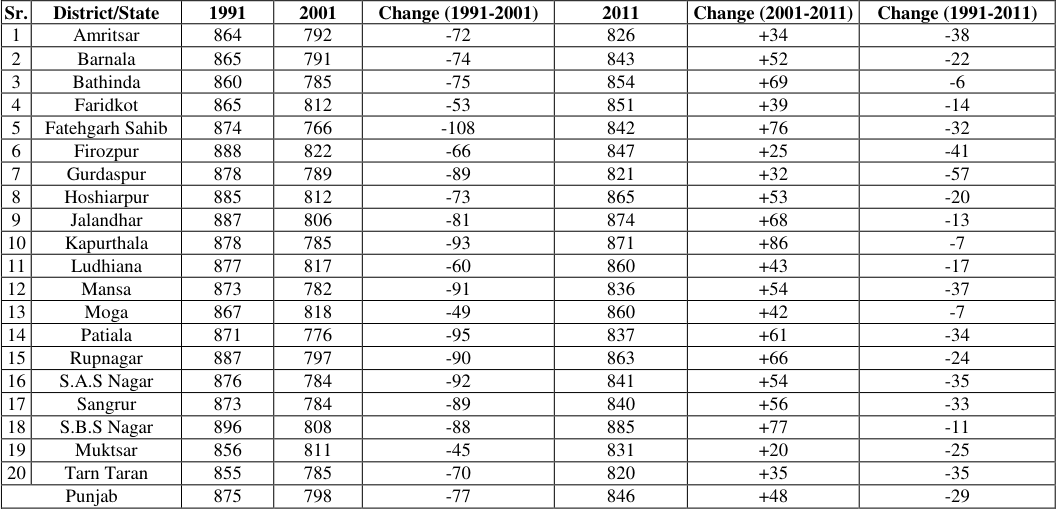 Table 1
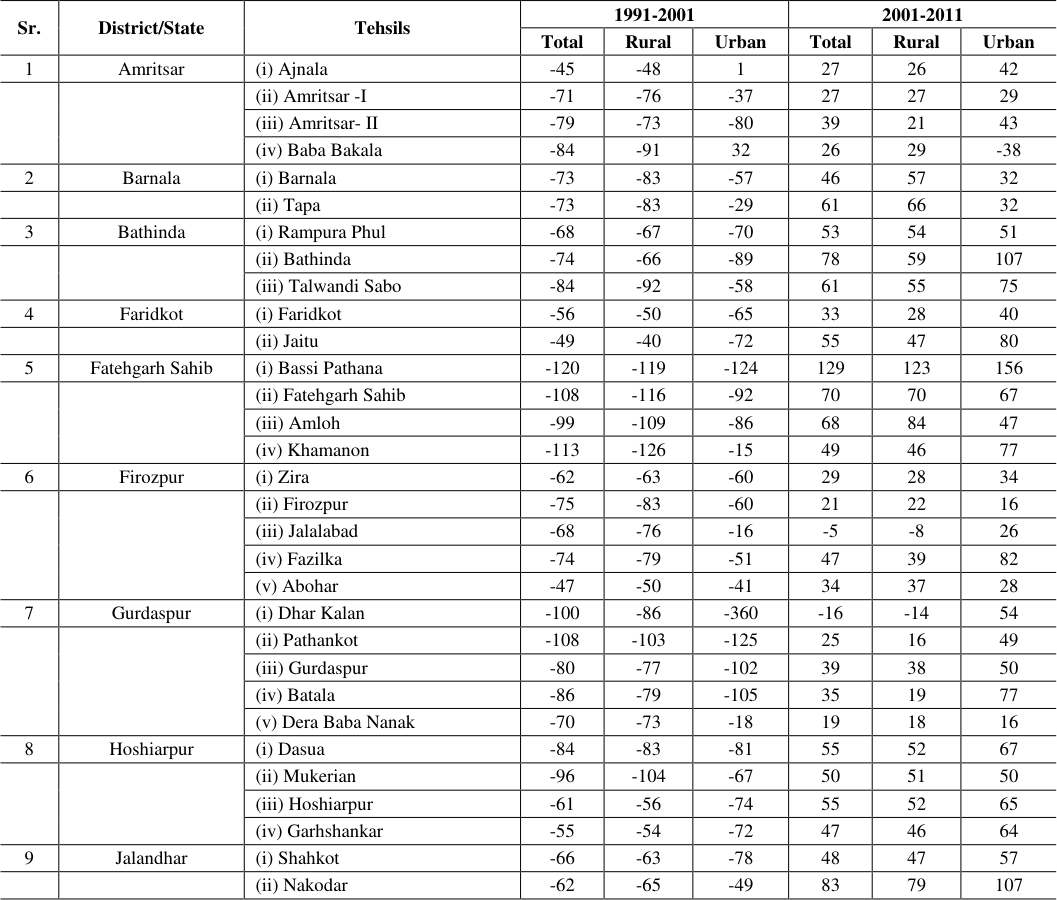 Table 2
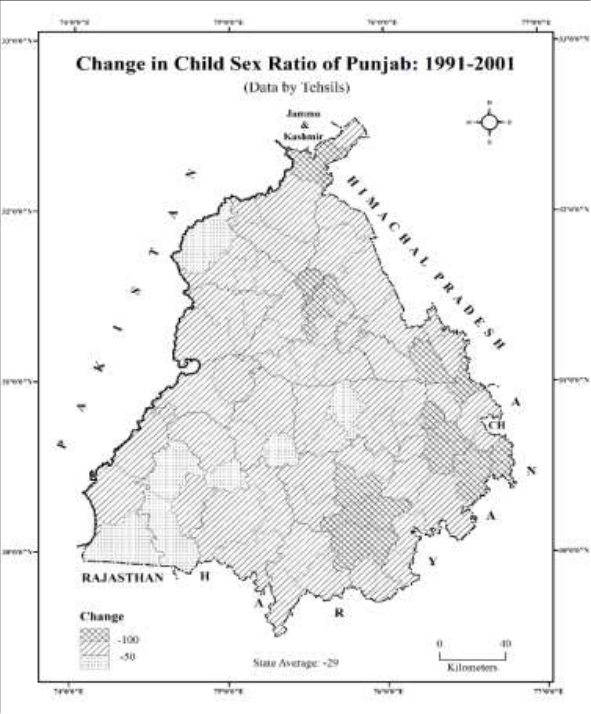 Figure 1
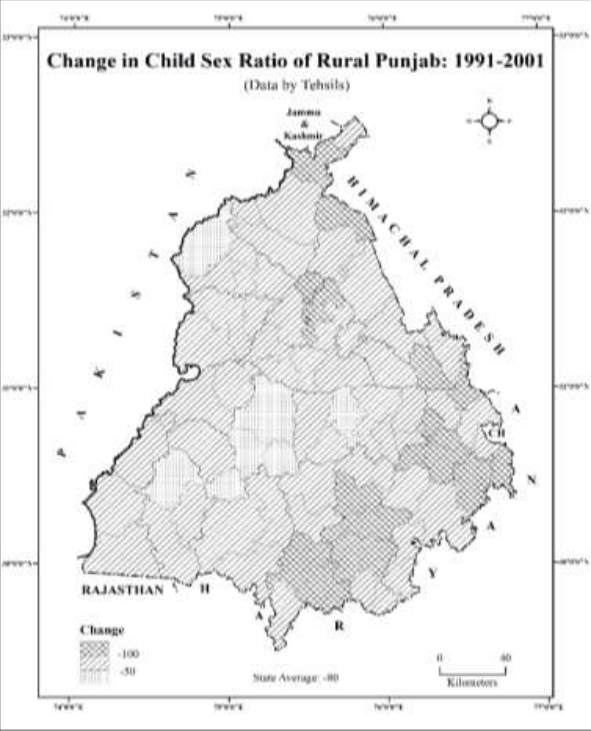 Figure 2
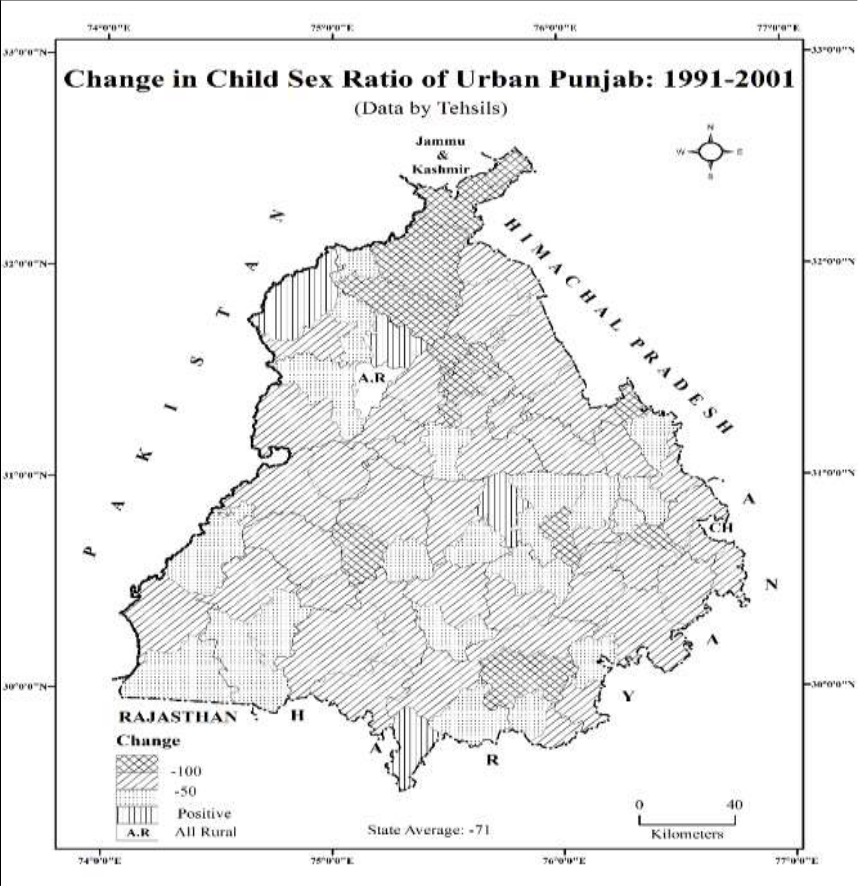 Figure 3
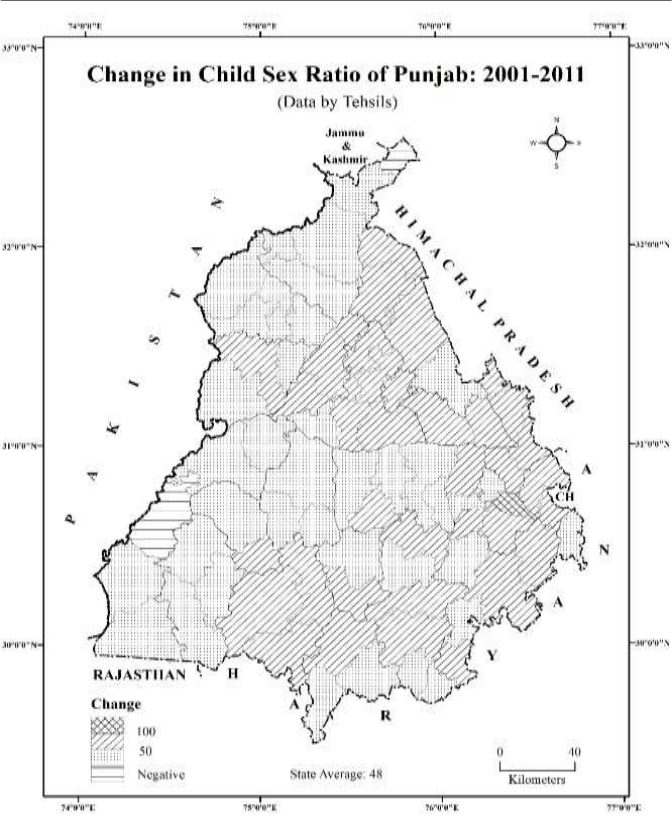 Figure 4
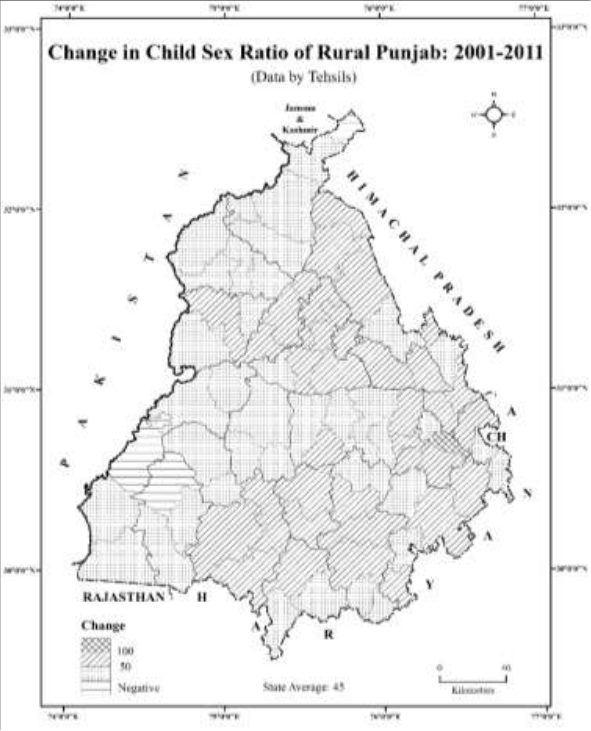 Figure 5
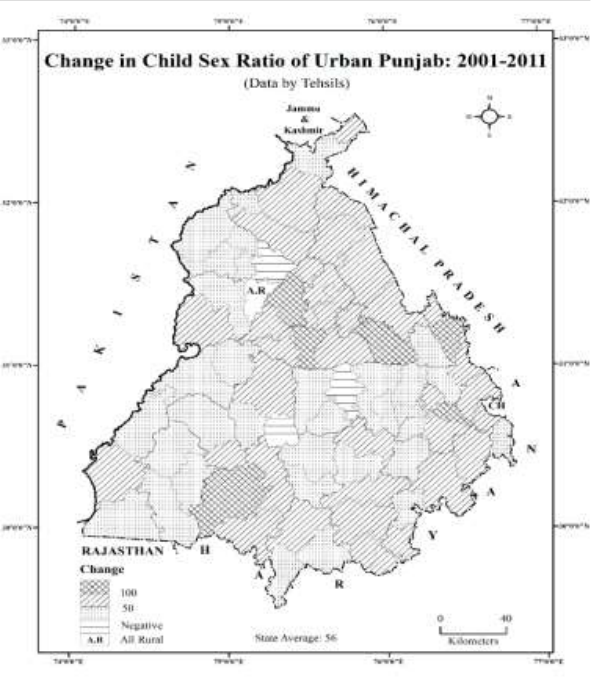 Figure 6
Introduction
Punjab is a region that had always been considered as a gateway of India to central Asia for traders, travellers and invaders. Besides, invaders also made frequent attacks resulting in widespread loot and gender violence (Purewal, 2010) [11] . Thus, males were needed to fight wars, protect their lands and women, whereas women had to produce more male children than females to ward off these invasions (Department of Health and Family Welfare, Government of Punjab, 2007) [4] . Therefore, Punjab's sex ratio stayed in favour of males than females (Dagar, 2007) [3] . It has ultimately led to low child sex ratio in the deep past. Over time, the situation of females in general and that of girls in particular has always remained the same in Punjab. Even after independence, Punjab had faced many types of violence in which the position of women had always worsened. For instance, declining sex ratios of females after independence in the Punjab was the result of the state's anti-Sikh movements during the late 1970s to mid-1990s (Purewal, 2010) [11] . However, extensive historical and other source materials show that son preference and female discrimination have existed in Punjab among the Rajputs, the Khatris and others since long (Browne, 1857; Panigrahi, 1972; Malhotra, 2002) [1,10,9] . Consequently, the gender gap in child sex ratio has a long history in Punjab. The term child sex ratio (CSR) is defined as the number of females per thousand males in the age group of 0-6 years. Gender disparity in Punjab existed in various forms, the most obvious being the trends of continuously declining sex ratio and child sex ratio in the last few decades (Census of India, 2011) [2] . Basically, the patriarchal culture of the state played a notable role in this regard. Patriarchal culture promotes son preference that is essentially a manifestation of social survival and socio-economic security which has been among the basic threads of human social organisation, and the prevalent view holds that it can be achieved through sons only (Gill, 2013) [6] . This attitude plays an important role towards higher neglect of the girl child for the sake of having a son. Further, despite the ideology of Sikhism propagating gender equality, the lust for a male child and the superiority of men have long been the hallmark of the Punjabi culture and society which also contributed to this (Robitaille and Chatterjee, 2013; Radkar, 2018) [13,12] . Moreover, new reproductive sex-selective technologies have also contributed to widening this gender gap in Punjabi society. Because it was Punjab where the first ultrasound clinic was opened in the late 1970s (Purewal, 2010) [11] . Over the time, these types of private clinics rapidly diffused to other areas of the state. It eventually leads to high sex-selective abortions and low child sex ratio. As per the census 2011, Punjab's child sex ratio stood at 846, which has gradually decreased from 901 in 1961 to the present level which signals the severity of this problem. Punjab is one of the bottom ranking states in terms of child sex ratio. The child sex ratio in census 2011 indicated some increase from the previous decade i.e., 798 in 2001 to 846 in 2011 but this figure is still far less as compared to 1961. Many social, economic, political and cultural factors are responsible for deteriorating position of child sex ratio in Punjab. Several ups and downs have been observed from previous decades in this regard. So, it is crucial to examine the key factors which are responsible for spatio-temporal changes in child sex ratio of Punjabi society. Therefore, the present study is an in-depth attempt to understand the changing nature of gender inequality in the form of child sex ratio across the study area. Keep this in mind, the present study examines the decadal changes in child sex ratio of every group of population of Punjab i.e., total, rural and at tehsil-level.
Objectives
1. To understand the situation of child sex ratio in Punjab. 2. To examine the temporal changes in child sex ratio at micro level. 3. To analyse the changes in child sex ratio of rural and urban areas of the state. 4. To find out the factors responsible for decadal changes in child sex ratio of Punjab.
Data Sources and Methodology
To achieve aforesaid objectives, Census data of 1991, 2001 and 2011 has been used. Tehsils are used as study units to explore the changes in child sex ratio of Punjab. The present study is limited to three Censuses only because tehsil-wise 0-6 age group data was available only since the 1991 census. Choropleth maps have been prepared to examine the spatio-temporal changes in this regard. Moreover, suitable graphical methods have been used to represent the trends of child sex ratio in the state. [2] . Primary Census Abstract, Punjab, 1991, 2001 and 2011. Out of these, the highest decline (127 points) was reported by Rupnagar tehsil closely followed by Sunam (124 points), Bhulath (121 points), Bassi Pathana (120 points), Khamanon (113 points), Rajpura (113 points), Dhuri (112 points), Jalandhar-II (110 points), Fatehgarh Sahib (108 points), Pathankot (108 points) and Balachaur (108 points). Among these, Malwa recorded very high decline in their child sex ratio followed by Doaba and Majha (Figure 1). About seventy-four percent tehsils emerged with moderate decline (between 50-100 points) in child sex ratio during the same period. Dhar Kalan tehsil possesses the top position in this regard. About eighty-three percent tehsils of Majha, eighty percent of Doaba and seventy percent of Malwa reported moderate decline in child sex ratio. Only seven tehsils of the state registered relatively low decline (below 50 points) in child sex ratio during this decade (1991-2001). Among these, Ludhiana West reported the lowest decline (38 points) in child sex ratio in the state (Table 2). Out of these, six tehsils were located in Malwa and only one was in Majha. Not even a single tehsil of Doaba emerged with relatively low decline in child sex ratio. (Figure 1). This decade (1991-2001) had faced many ups and downs in the state's social, cultural, economic and political structures. The state witnessed technological advancement in the medical field during this period. This decade witnessed rapid spread of sex-determination techniques in the entire country especially in the north-western states. Among these states, Punjab was forerunner to adopt these techniques leading to female foeticide. In the late 1970, the state was the first to start the commercial use of sex-selection technologies at 'New Bhandari Ante-Natal SD clinics' in Amritsar (Purewal, 2010) [11] . "Pay Rs 500 now rather than spend Rs 50,000 later on daughter's wedding", these types of advertisements were widely spread across the region by private practitioners. It was a hot spot area from where such clinics mushroomed across the entire Punjab and also to the neighbouring states. Spreading of these clinics was on peak during 1991-2001. People got an easy choice to use abortion techniques to neglect a girl child for the sake of having at least a son in the family. With the passage of time, thus, the child sex ratio of the state deteriorated. The government of India passed the Pre-Natal Diagnostic Techniques (PNDT) Act in 1994 to stop female foeticide in India. According to this act, the use of such techniques was illegal. Despite the Pre-Natal Diagnostic Techniques (PNDT) Act being passed by the Indian parliament in 1994 which made sex-selective scanning officially illegal, it was not fully implemented in Punjab until 1997 (Purewal, 2010) [11] . Thus, the late implementation of the PNDT Act in the study area led to a notable decline in child sex ratio during this decade. Besides, the socio-economic development during this period resulted in smaller family size through sex-selective abortions i.e., aborting of female foetuses only (Department of Women and Child Development, Ministry of Human Resource Development, Government of India and Punjab State Human Rights Commission, Chandigarh, 2002). Majority of people in the study area did not opt for sexselection if the first child was a son, but if the first-born was a girl the practice of sex-selective abortion gained momentum for the second child (John et al., 2008) [7] . Consequently, child sex ratio declined due to the adoption of small family size norms with son preference in this period. Moreover, an increase in the cases of dowry deaths and dowry harassment also contributed to this worst situation of child sex ratio in Punjab. As per the report entitled "Identifying and Controlling Female Foeticide and Infanticide in Punjab" published by Institute for Development and Communication (IDC), Chandigarh (2000), "dowry deaths in the state increased from 51 to 153 during the period of 1991-2005-an increase of 200 percent. The cases of dowry harassment are even more alarming as these registered an increase of more than 3000 percent in the same period as these had gone up from 11 to 378". Dowry demands and dowry deaths were higher in Majha as compared to Malwa and Doaba during 1991-2001 (Department of Women and Child Development, Ministry of Human Resource Development, Government of India and Punjab State Human Rights Commission, Chandigarh, 2002). Due to increase in heavy demands of dowry on the marriages of girls and dowry harassment after their marriage, the people got pressurised to neglect the birth of a girl child in the family. As far as the change in child sex ratio of rural Punjab was concerned, seventeen tehsils of the state experienced relatively high decline in child sex ratio during 1991-2001. Rupnagar tehsil recorded the highest decline (135 points) in this regard; closely followed by Khamanon (126 points), Bhulath (126 points), Sunam (123 points), Dhuri (123 points), Sangrur (122 points), Bassi Pathana (119 points), Rajpura (119 points), Fatehgarh Sahib (116 points), Amloh (109 points) and Jalandhar-II (109 points). About twentyseven percent tehsils of Doaba, twenty-four percent of Malwa reported relatively high decline in their child sex ratio during the same period (Figure 2). Whereas only one tehsil of Majha fell in this group. Moderate decline in rural child sex ratio was experienced by about sixty-nine percent tehsils during this decade (1991-2001). Out of these, Nabha tehsil occupied the top position in this regard by declining 100 points. About eighty-three percent tehsils of Majha, seventy-three percent of Doaba and sixty-four percent of Malwa emerged with moderate decline in rural child sex ratio during this period. On the other hand, only nine percent tehsils recorded relatively low decline in rural child sex ratio during this period. The lowest decline (38 points) in rural child sex ratio was found in Nihal Singhwala tehsil. Among these, six tehsils belonged to Malwa and the remaining one to Majha (Figure 2). During this decade the information related to sex determinations tests was widespread, even in the rural areas which are far from the urban centres. About 38.2 percent of sex determination tests took place in rural Majha, 37 percent in rural Malwa and 30 percent in rural Doaba (Department of Women and Child Development, Ministry of Human Resource Development, Government of India and Punjab State Human Rights Commission, Chandigarh, 2002). The spread of private clinics for abortions even in the rural areas during this period were responsible for the rapid decline in rural child sex ratio. In addition to it, Green Revolution had reached a plateau stage from the previous decade. During this time there was increase of mechanization in agricultural activities of the state and it acted as a social variable also. Gradually, people started to use machines instead of human labours. As a result, the economic value of the females decreased in the agricultural and non-agricultural families; which ultimately ended in widening the gender gap. On the other hand, in urban areas of the state only fourteen percent tehsils recorded high decline in child sex ratio during this decade (1991-2001). Dhar Kalan tehsil occupied the top position by reporting decline of 360 points in urban child sex ratio followed by Bagha Purana (136 points), Payal (126 points), Pathankot (125 points), Bassi Pathana (124 points), Sunam (124 points), Bhulath (108 points), Jalandhar-II (107 points), Batala (105 points) and Gurdaspur (102 points) (Table 2). Majority of the northern parts of the study area also reported high decline in urban child sex ratio during this period (Figure 3). About fifty-three percent tehsils of the study area witnessed moderate decline. About eighty percent tehsils of Doaba and fifty-four percent of Malwa reported moderate decline in this regard. On the other hand, only two tehsils of Majha showed moderate decline. However, twenty-six percent tehsils of the study area showed relatively less decline in urban child sex ratio during the same period. About thirty-two percent tehsils of Malwa, one-fourth tehsils of Majha and only one tehsil of Doaba reported relatively less decline in urban child sex ratio (Table 2). It is worthwhile to mention here that only few urban areas of the state showed a positive change in child sex ratio during 1991-2001 (Table 2). Only four tehsils of the urban Punjab namely, Ludhiana West (37 points), Baba Bakala (32 points), Sardulgarh (14 points) and Ajnala (1 point) recorded positive change in child sex ratio. Out of these, two tehsils belonged to Malwa and another to Majha region (Figure 3). The decline in child sex ratio continued in this period (1991-2001). All the segments of the population of the state except urban population have recorded only negative change. It is surprising to note that in spite of implementation of laws against female foeticide and infanticide the child sex ratio of the state declined during this decade.
| Sr. | District/State | Tehsils | 1991-2001 | — | — | 2001-2011 | — | — |
|---|---|---|---|---|---|---|---|---|
| Total | Rural | Urban | Total | Rural | Urban | |||
| 1 | Amritsar | (i) Ajnala | -45 | -48 | 1 | 27 | 26 | 42 |
| (ii) Amritsar -I | -71 | -76 | -37 | 27 | 27 | 29 | ||
| (iii) Amritsar- II | -79 | -73 | -80 | 39 | 21 | 43 | ||
| (iv) Baba Bakala | -84 | -91 | 32 | 26 | 29 | -38 | ||
| 2 | Barnala | (i) Barnala | -73 | -83 | -57 | 46 | 57 | 32 |
| (ii) Tapa | -73 | -83 | -29 | 61 | 66 | 32 | ||
| 3 | Bathinda | (i) Rampura Phul | -68 | -67 | -70 | 53 | 54 | 51 |
| (ii) Bathinda | -74 | -66 | -89 | 78 | 59 | 107 | ||
| (iii) Talwandi Sabo | -84 | -92 | -58 | 61 | 55 | 75 | ||
| 4 | Faridkot | (i) Faridkot | -56 | -50 | -65 | 33 | 28 | 40 |
| (ii) Jaitu | -49 | -40 | -72 | 55 | 47 | 80 | ||
| 5 | Fatehgarh Sahib | (i) Bassi Pathana | -120 | -119 | -124 | 129 | 123 | 156 |
| (ii) Fatehgarh Sahib | -108 | -116 | -92 | 70 | 70 | 67 | ||
| (iii) Amloh | -99 | -109 | -86 | 68 | 84 | 47 | ||
| (iv) Khamanon | -113 | -126 | -15 | 49 | 46 | 77 | ||
| 6 | Firozpur | (i) Zira | -62 | -63 | -60 | 29 | 28 | 34 |
| (ii) Firozpur | -75 | -83 | -60 | 21 | 22 | 16 | ||
| (iii) Jalalabad | -68 | -76 | -16 | -5 | -8 | 26 | ||
| (iv) Fazilka | -74 | -79 | -51 | 47 | 39 | 82 | ||
| (v) Abohar | -47 | -50 | -41 | 34 | 37 | 28 | ||
| 7 | Gurdaspur | (i) Dhar Kalan | -100 | -86 | -360 | -16 | -14 | 54 |
| (ii) Pathankot | -108 | -103 | -125 | 25 | 16 | 49 | ||
| (iii) Gurdaspur | -80 | -77 | -102 | 39 | 38 | 50 | ||
| (iv) Batala | -86 | -79 | -105 | 35 | 19 | 77 | ||
| (v) Dera Baba Nanak | -70 | -73 | -18 | 19 | 18 | 16 | ||
| 8 | Hoshiarpur | (i) Dasua | -84 | -83 | -81 | 55 | 52 | 67 |
| (ii) Mukerian | -96 | -104 | -67 | 50 | 51 | 50 | ||
| (iii) Hoshiarpur | -61 | -56 | -74 | 55 | 52 | 65 | ||
| (iv) Garhshankar | -55 | -54 | -72 | 47 | 46 | 64 | ||
| 9 | Jalandhar | (i) Shahkot | -66 | -63 | -78 | 48 | 47 | 57 |
| (ii) Nakodar | -62 | -65 | -49 | 83 | 79 | 107 |
Table text extracted from the original PDF; superscript letters are shown inline. The original table image is below.
View original table image
Results and Discussion
Results and Discussion
Change in Child Sex Ratio during 2001-2011
As per the Census 2011, India had reported decline of 13 points in child sex ratio during 2001-2011. But in case of Punjab, the child sex ratio had experienced rise of 48 points from 798 to 846 during this decade. The urban areas of the state recorded the highest improvement (56 points) in child sex ratio than that of its rural counterparts (45 points) during this period. It is significant to mention here that all the tehsils of the study area recorded rise in their child sex ratio during the same period (Table 2). Only one tehsil of the state namely, Bassi Pathana of Malwa region recorded the highest increase (129 points) in child sex ratio during 2001-2011. On the other hand, about fortyeight percent tehsils reported moderate increase (between 50-100 points) in child sex ratio. Among these, eighty-seven percent tehsils of Doaba and forty-four percent of Malwa showed moderate increase in child sex ratio. But only one tehsil of Majha had contributed in this regard. About fortynine percent tehsils emerged with relatively low increase (below 50 points) in child sex ratio during this decade. The lowest increase (2 points) in child sex ratio was reported in Samana tehsil. Majha region played relatively very discouraging role in this regard followed by Malwa and Doaba. Majority of northern, north-western, western and central areas of the state showed relatively low increase in their child sex ratio (Figure 4). It is significant to mention here that two tehsils of the study area namely, Dhar Kalan and Jalalabad showed negative change in child sex ratio during 2001-2011 (Table 2). In the rural Punjab, Bassi Pathana was the only tehsil that reported relatively high increase (123 points) in child sex ratio. On the other hand, thirty-five tehsils of the state emerged with moderate increase in rural child sex ratio. About eighty-seven percent tehsils of Doaba and forty-two percent of Malwa registered moderate increase in this context. However, almost fifty percent tehsils showed relatively low increase in rural child sex ratio during this decade. Out of these, Giddarbaha tehsil showed the lowest rise (1 point) in this regard. Largely, northern, north-western and central parts of the study area had reported relatively low increase in child sex ratio (Figure 5). It is important to mention here that three tehsils of the state namely, Dhar Kalan, Jalalabad and Muktsar reported decline in rural child sex ratio. As for as the change in child sex ratio in the urban Punjab was concerned, only six tehsils of the study area recorded relatively high increase in child sex ratio during this period. The highest rise (156 points) in urban child sex ratio of the state was reported by Bassi Pathana tehsil followed by Kapurthala (127 points), Anandpur Sahib (126 points), Nakodar (107 points), Bathinda (107 points) and Nawanshahr (104 points). Out of these, three tehsils each belonged to Malwa and Doaba. On the other hand, not even a single tehsil of Majha recorded relatively high increase in urban child sex ratio (Figure 6). About fifty-five percent tehsils appeared with moderate increase in urban child sex ratio during this period. Moderate increase in child sex ratio was observed in seventy-three percent tehsils of Doaba followed by Malwa (40 percent) and Majha (33 percent). On the other hand, thirty-two tehsils of the state recorded relatively low increase in urban child sex ratio during this decade. The lowest magnitude of increase (1 point) in child sex ratio was reported in Samana tehsil. Almost fifty percent tehsils of Majha as well as Malwa region come under this category. Only one tehsil of Doaba lie in this category. It is important to mention that three tehsils of the study area emerged with negative change in urban child sex ratio (Table 2). Out of these, Nihal Singhwala showed higher decline (146 points) followed by Baba Bakala (38 points) and Ludhiana West (16 points) (Figure 6 and Table 2). Among these, two tehsils belonged to Malwa and the rest of one to Majha. The data reveals that majority of the areas which recorded relatively high increase in child sex ratio previously belonged to the category of low child sex ratio in 2001, whereas in 2011, these areas came under the category of moderate and high child sex ratio. It is interesting to note that the urban areas of the state experienced relatively high improvement in child sex ratio as compared to their rural counterparts during this period (2001-2011). During this decade, the highest rise in child sex ratio was reported in Doaba as compared to Majha and Malwa. Various factors are responsible for rapid improvement in child sex ratio in Doaba but exposure towards the western countries played a very significant role in this regard. Awareness spread by the immigrants played an important role in the improvement of child sex ratio in this region. Besides, relatively high growth in literacy rate and education levels especially among the females in Doaba were the major contributors towards the improvement in child sex ratio (Census of India, 2011) [2] . On the other hand, the low advancement in education levels, economic backwardness and low degree of urbanisation in Malwa were responsible for lesser improvement in child sex ratio during this period (Kaur, 2003 and Human Development Report, 2012) [8] . Due to the implementation of various government schemes and policies like Balri Rakshak Yojana (2005), Nanhi Chhaan scheme (2008), Mai Bhago Vidhya Scheme (2011) etc. child sex ratio improved to some extent during 2001-2011. For instance, 'Punjab Women Commission' was formed for the social security and development of women in 2001 (Government of Punjab), 'Bebe Nanki Laadli Beti Kalyan Scheme' was launched under 13 th finance commission in the state from 2011-12 to improve the child sex ratio in the state, 'Kanya Jagriti Jyoti Scheme' was launched by the Department of Social Security, Government of Punjab in 1996-97 to reduce the school drop-out rate of girls and uplift their social status, 'Beti Bachao Beti Padhao (BBBP) Scheme' was implemented by the Punjab Government in the state on the pattern of center government to address the issue of declining child sex ratio, to prevent the sex-selection of the female child and to ensure the education for all the girls in the state, 'Balri Rakshak Yojana' scheme implemented by the state's Department of Health and Family Welfare in 2005 to give a monthly incentive to those families who have no male child and have one or two girl child (Planning Commission of Punjab, 2009), 'Nanhi Chhaan' scheme was launched by State Government in 2008 to make a positive impact on adverse gender ratio of the state, 'Kanya Jagriti Jyoti' scheme launched by the State Government in 2009-2010 for giving the state scholarship to the girl children who born in Below Poverty Line (BPL) family (Planning Commission of Punjab, 2009). These all schemes were implemented in the state to curb the female foeticide which ultimately improved the child sex ratio during 2001-2011. Although these schemes meant to improve the child sex ratio of the study area during this decade had not been meeting the expectations, but it seems a good beginning.
Summing Up
The state has observed both positive and negative changes in its child sex ratio since 1991. The study points out that a sudden sharp decline had been reported in the state's child sex ratio during 1991-2001. During this period, Malwa has emerged with the highest decline in child sex ratio followed by Doaba and Majha. It has also been observed that some urban areas of the state have registered improvement in child sex ratio during the same period. Interestingly, despite several laws and regulations that have been implemented in the state against female foeticide and infanticide the child sex ratio had been on the decline during this period. Although in the next decade 2001-2011, some improvement in child sex ratio of the study area has been reported but it was not at the expected level. It was still quite low as compared to the national average. Broadly speaking, the child sex ratio of the state had always been worse during the study period. Majha region of the state had observed high decline in child sex ratio as compared to Malwa and Doaba during 1991-2011. Whereas the rural areas of the state had obaserved higher decline in child sex ratio than the urban counterparts during these two decades. Generally speaking, the state had experienced decline in child sex ratio despite many socio-economic developments that had taken place during the study period.
Figures and tables from the paper
| Sr. | District/State | 1991 | 2001 | Change (1991-2001) | 2011 | Change (2001-2011) | Change (1991-2011) |
|---|---|---|---|---|---|---|---|
| 1 | Amritsar | 864 | 792 | -72 | 826 | +34 | -38 |
| 2 | Barnala | 865 | 791 | -74 | 843 | +52 | -22 |
| 3 | Bathinda | 860 | 785 | -75 | 854 | +69 | -6 |
| 4 | Faridkot | 865 | 812 | -53 | 851 | +39 | -14 |
| 5 | Fatehgarh Sahib | 874 | 766 | -108 | 842 | +76 | -32 |
| 6 | Firozpur | 888 | 822 | -66 | 847 | +25 | -41 |
| 7 | Gurdaspur | 878 | 789 | -89 | 821 | +32 | -57 |
| 8 | Hoshiarpur | 885 | 812 | -73 | 865 | +53 | -20 |
| 9 | Jalandhar | 887 | 806 | -81 | 874 | +68 | -13 |
| 10 | Kapurthala | 878 | 785 | -93 | 871 | +86 | -7 |
| 11 | Ludhiana | 877 | 817 | -60 | 860 | +43 | -17 |
| 12 | Mansa | 873 | 782 | -91 | 836 | +54 | -37 |
| 13 | Moga | 867 | 818 | -49 | 860 | +42 | -7 |
| 14 | Patiala | 871 | 776 | -95 | 837 | +61 | -34 |
| 15 | Rupnagar | 887 | 797 | -90 | 863 | +66 | -24 |
| 16 | S.A.S Nagar | 876 | 784 | -92 | 841 | +54 | -35 |
| 17 | Sangrur | 873 | 784 | -89 | 840 | +56 | -33 |
| 18 | S.B.S Nagar | 896 | 808 | -88 | 885 | +77 | -11 |
| 19 | Muktsar | 856 | 811 | -45 | 831 | +20 | -25 |
| 20 | Tarn Taran | 855 | 785 | -70 | 820 | +35 | -35 |
| Punjab | 875 | 798 | -77 | 846 | +48 | -29 |
Table text extracted from the original PDF; superscript letters are shown inline. The original table image is below.
View original table image
References
3 in the original paper- Gill MS. Female Foeticide in India: Looking beyond Son Preference and Dowry. The Mankind Quarterly. 2013;53(3&4):281-305.
- Radkar A. Is son-preference weakening?, Economic and Political Weekly. 2018;53(12):101-106.
- Robitaille, Marie C. Determinants of stated sonpreference in India: Are men and women different?, The Journal of Development Studies. 2013;49(5):657669.