
Research article · 2024 · Full text
International Journal of Research in AgronomyAnalysis of marketing patterns and price spread of maize among tribal area in Balrampur district, Chhattisgarh
Volume 7(7S) · Pages 113–115 · DOI: 10.33545/2618060x.2024.v7.i7sb.1035 ↗
Research areasAgricultural Economics and Practices
Abstract
Author-writtenMaize (Zea mays L.), often referred to as the queen of cereals, occupies a prominent global position owing to its outstanding genetic yield potential and adaptability across diverse ecologies and seasons. In India, it holds the rank of third among food crops, following rice and wheat, with the country ranking fourth in global maize cultivation area and seventh in production. Indian maize cultivation durations, two primary seasons: the rainfed kharif and the winter rabi, with recent increases in spring maize cultivation observed in northwestern states. Madhya Pradesh and Karnataka are the foremost states in maize cultivation in India, each contributing 15% to the total maize area, followed by Maharashtra, Rajasthan, and Uttar Pradesh. Bihar leads in maize production, while Andhra Pradesh showcases the maximum productivity. In Chhattisgarh, significant tribal populations lead maize cultivation regions like Surguja and Bastar. This study focuses on the marketing dynamics of maize in the tribal areas of Chhattisgarh, specifically Balrampur district, utilizing a multistage purposive random sampling approach. The analysis finds three prevalent marketing channels: Producer-Consumer, Producer-FPO-Feed Company, and Producer-Village Merchant-Wholesaler-Consumer. Results indicate that Channel 1 yields the highest net price for producers, followed by Channels 2 and 3, revealing an inverse relationship between producer net prices and intermediary involvement. Detailed tabular analyses illustrate the maize marketing patterns, showcasing high efficiency in Channel 1 compared to Channels 2 and 3. Producers' share in consumer rupees is notably highest in Channel 1 (92.4%), followed by Channel 2 (83.54%) and Channel 3 (82.28%). These findings underscore Channel 1 as the most efficient for both producers and consumers in the study area. In conclusion, maize cultivation proves beneficial for intensifying agricultural productivity and offers substantial income opportunities for farmers in tribal Chhattisgarh. Effective marketing infrastructure and supportive policies are crucial for enhancing farmers' incomes and promoting sustainable agricultural practices in the region.
Summary
Source-checkedPlain-language reading of the full paper, prepared with AI and checked against the text. Each point links to the authors' own words.
Why it matters
- In India, maize is the third most important food crop, and the country ranks fourth globally in cultivation area and seventh in production. View evidence ↗
- Tribal populations in Chhattisgarh are key to maize cultivation, with Balrampur district having the largest maize area at 19.71%. View evidence ↗
The question
- The study aimed to examine the marketing patterns of maize within the tribal areas of the Balrampur district. View evidence ↗
What they did
- The researchers used a multistage stratified purposive random sampling method to select the district, blocks, villages, and participants. View evidence ↗
- The study sampled 150 maize growers across four farm size categories: marginal, small, medium, and large. View evidence ↗
- Three marketing channels were analyzed: direct producer-to-consumer, producer through a Farmer Producer Organization (FPO) to a feed company, and producer through a village merchant and wholesaler to the consumer. View evidence ↗
- The data collected for this analysis pertains to the 2022-23 agricultural year. View evidence ↗
What they found
- The overall marketable surplus of maize was 26.28 quintals per farm, which is 97.94% of the total production. View evidence ↗
- Producers received the highest net price through Channel 1 (Rs. 1848.00), followed by Channel 2 (Rs. 1838.00) and Channel 3 (Rs. 1728.00). View evidence ↗
- The producer's share of the consumer's rupee was highest in Channel 1 at 92.4%, compared to 83.54% in Channel 2 and 82.28% in Channel 3. View evidence ↗
- Consumer prices per quintal varied by channel, with the lowest price in Channel 1 (Rs. 1848) and the highest in Channel 2 (Rs. 2200). View evidence ↗
- The study found an inverse relationship between the number of intermediaries in the marketing channel and the net price/share received by the producer. View evidence ↗
- Despite lower efficiency for the producer, Channel 2 facilitated the highest quantity of maize sales in the study area. View evidence ↗
What it means
- The authors conclude that maize cultivation can potentially double farmer incomes if marketing infrastructure and supportive policies are improved. View evidence ↗
- The authors identify the direct Producer-Consumer channel (Channel 1) as the most efficient marketing route for both parties. View evidence ↗
Figures & tables
From the original paper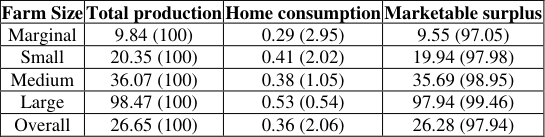 Table 1
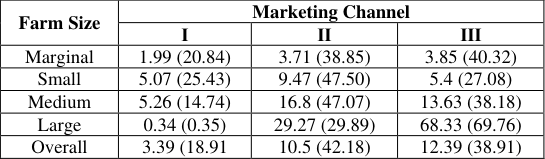 Table 2
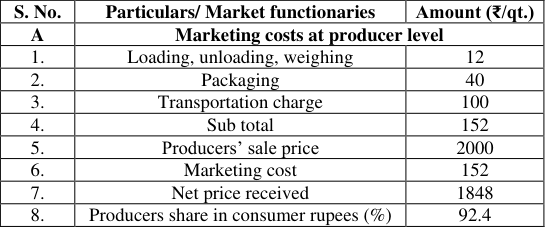 Table 3
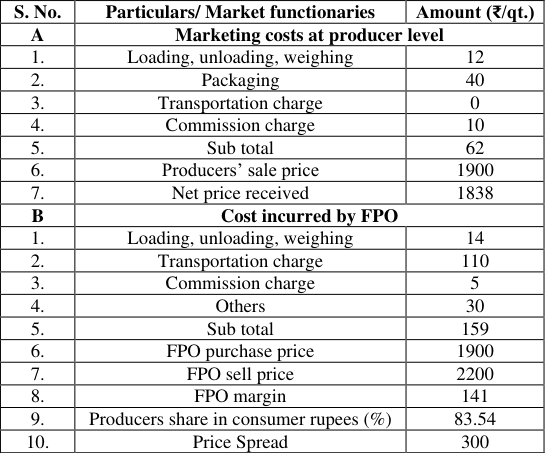 Table 4
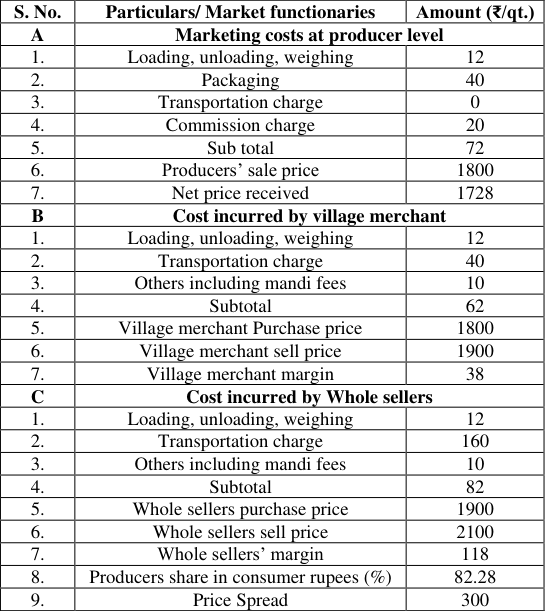 Table 5
Introduction
Maize (Zea mays L.), the world's leading crop, is a versatile cereal grain domesticated in Central America. Known as the "queen of cereals" for its highest genetic yield potential, maize can be cultivated in diverse seasons, ecologies, and for various uses. It includes types like yellow/white grain, sweet corn, baby corn, popcorn, waxy corn, high amylase corn, high oil corn, and quality protein maize. Additionally, maize serves as a crucial industrial raw material, offering significant value addition opportunities. In India, maize is the third most significant food crop, coming after rice and wheat. The country ranks 4 th in maize area and 7 th in production globally, contributing 4% of the world's maize area and 2% of total production. Indian maize cultivation occurs in two main seasons: rainy (kharif) and winter (rabi). Kharif maize covers 83% of the total maize area, primarily grown under rainfed conditions, which subject it to various stresses. Recently, spring maize cultivation has gained momentum in northwestern India, particularly in Punjab, Haryana, and Western Uttar Pradesh, covering an estimated 150 thousand hectares. Maize has shown the highest growth rates among cereals in both area and productivity. Madhya Pradesh and Karnataka are the leading states in maize cultivation, each accounting for 15% of India's maize area, followed by Maharashtra (10%), Rajasthan (9%), and Uttar Pradesh (8%). Bihar ranks highest in maize production, while Andhra Pradesh boasts the highest productivity, with districts like Krishna and West Godavari achieving up to 12 tons per hectare. In Chhattisgarh, the tribal population is significant, with 17,43,277 individuals out of a total population of 2,55, 45,198 (census 2011). The Surguja division has the largest tribal population (30.56%), followed by the Bastar division (23.28%). Surguja covers 45.65% of the state's maize area, and Bastar covers 34.37%. Among the districts, Balrampur has the largest maize area (19.71%), followed by Kondagaon (13.43%). For the study of marketing aspects, commission agents were randomly selected from the market. Three marketing channels were prevalent for disposal of maize in the study area viz; 1-Producer-Consumer, 2-producer-FPO-feed company (last consumer), 3-Producer-village merchant-whole seller-consumer. Producers received the highest net price in channel 1, followed by channel 2 and channel 3. Considering these facts, the study is titled "Comparative study of resource use efficiency and marketing of maize in tribal area of Chhattisgarh" The objective of the study was to examine the marketing pattern of maize in the study area.
Research Methodology
A multistage stratified purposive random sampling procedure was employed to select the district, block, village, and respondents. In Chhattisgarh Balrampur district was purposively chosen due to its significant maize acreage. Balrampur, Rajpur, and Kusmi blocks, were selected which have the highest maize cultivation areas. Specifically, the research will focus on selected villages: Krishnnagar, Ranhat, and Amdanda in Balrampur block; Basantpur, Sagri, and Sadgoli in Rajpur block; and Jaljali, Chando, and Samari in Kusmi block. The local market, serving as the primary outlet for maize disposal, was included in the study of marketing aspects. Commission agents from this market were randomly selected. Three marketing channels were identified for maize disposal: 1) Producer-Consumer, 2) Producer-FPO-Feed Company (final consumer), and 3) Producer-Village Merchant-Wholesaler-Consumer. Producers received the highest net price through channel 1, followed by channels 2 and 3. To study the disposal patterns and price spread of maize, an appropriate number of commission agents were interviewed to gather relevant marketing information. Simple tabular analysis was applied to examine various aspects of maize marketing in the study area. The study pertains to the agricultural year 2022-23.
Results and Discussion
In the study area, three distinct marketing channels were identified for maize: Channel 1 (Producer-Consumer), Channel 2 (Producer-FPO-Feed Company), and Channel 3 (Producer-Village Merchant-Wholesaler-Consumer). Table 1 presents the marketable surplus of maize across Balrampur, Rajpur, and Kusmi markets. The overall marketing surplus amounted to 26.28 quintals, representing 97.94% of the total production. Marginal, small, medium, and large farms contributed 97.05%, 97.98%, 98.95%, and 99.46% to the total marketed produce, respectively. Table 2 illustrates the disposal patterns of maize through various channels in the Balrampur, Rajpur, and Kusmi markets. The disposal pattern varied significantly among farm size categories and across different channels. Analysis revealed that Channel 2 facilitated the highest quantity of maize sales, followed by Channel 3 and Channel 1 in the study area.
| Farm Size | Marketing Channel | — | — |
|---|---|---|---|
| Ⅰ | Ⅱ | Ⅲ | |
| Marginal | 1.99 (20.84) | 3.71 (38.85) | 3.85 (40.32) |
| Small | 5.07 (25.43) | 9.47 (47.50) | 5.4 (27.08) |
| Medium | 5.26 (14.74) | 16.8 (47.07) | 13.63 (38.18) |
| Large | 0.34 (0.35) | 29.27 (29.89) | 68.33 (69.76) |
| Overall | 3.39 (18.91 | 10.5 (42.18) | 12.39 (38.91) |
Table text extracted from the original PDF; superscript letters are shown inline. The original table image is below.
View original table image
| Farm Size | Total production | Home consumption | Marketable surplus |
|---|---|---|---|
| Marginal | 9.84 (100) | 0.29 (2.95) | 9.55 (97.05) |
| Small | 20.35 (100) | 0.41 (2.02) | 19.94 (97.98) |
| Medium | 36.07 (100) | 0.38 (1.05) | 35.69 (98.95) |
| Large | 98.47 (100) | 0.53 (0.54) | 97.94 (99.46) |
| Overall | 26.65 (100) | 0.36 (2.06) | 26.28 (97.94) |
Table text extracted from the original PDF; superscript letters are shown inline. The original table image is below.
View original table image
Summary and Conclusion
This study highlights maize cultivation as a viable option for intensive agricultural practices, offering substantial employment opportunities. The research involved 150 maize growers from various farm size categories: marginal, small, medium, and large. A multistage stratified purposive proportionate random sampling method was employed to select respondents, and tabular analysis was conducted to derive the study's findings. The primary objective of the research was to examine the marketing pattern of maize in the study area. Three distinct marketing channels were identified for maize disposal: (1) Producer-Consumer, (2) Producer-FPO-Feed Company (final consumer), and (3) Producer-Village Merchant-Wholesaler-Consumer. Producers achieved the highest net price through Channel 1, followed by Channels 2 and 3, indicating an inverse relationship between the number of intermediaries involved and the net price received by producers. Furthermore, the study revealed that producers' share in consumer rupees was highest in Channel 1 (92.4%), followed by Channel 2 (83.54%) and Channel 3 (82.28%). Channel 1 demonstrated greater efficiency for both producers and consumers compared to Channels 2 and 3 in the study area. Maize emerged as a suitable cereal crop for farmers in the study area, presenting an opportunity to potentially double their income. This underscores the significance of maize cultivation in enhancing rural livelihoods and economic development through efficient marketing strategies.
Figures and tables from the paper
| S. No. | Particulars/ Market functionaries | Amount (₹/qt.) |
|---|---|---|
| A | Marketing costs at producer level | |
| 1. | Loading, unloading, weighing | 12 |
| 2. | Packaging | 40 |
| 3. | Transportation charge | 100 |
| 4. | Sub total | 152 |
| 5. | Producers’ sale price | 2000 |
| 6. | Marketing cost | 152 |
| 7. | Net price received | 1848 |
| 8. | Producers share in consumer rupees (%) | 92.4 |
Table text extracted from the original PDF; superscript letters are shown inline. The original table image is below.
View original table image
| S. No. | Particulars/ Market functionaries | Amount (₹/qt.) |
|---|---|---|
| A | Marketing costs at producer level | |
| 1. | Loading, unloading, weighing | 12 |
| 2. | Packaging | 40 |
| 3. | Transportation charge | 0 |
| 4. | Commission charge | 10 |
| 5. | Sub total | 62 |
| 6. | Producers’ sale price | 1900 |
| 7. | Net price received | 1838 |
| B | Cost incurred by FPO | |
| 1. | Loading, unloading, weighing | 14 |
| 2. | Transportation charge | 110 |
| 3. | Commission charge | 5 |
| 4. | Others | 30 |
| 5. | Sub total | 159 |
| 6. | FPO purchase price | 1900 |
| 7. | FPO sell price | 2200 |
| 8. | FPO margin | 141 |
| 9. | Producers share in consumer rupees (%) | 83.54 |
| 10. | Price Spread | 300 |
Table text extracted from the original PDF; superscript letters are shown inline. The original table image is below.
View original table image
| S. No. | Particulars/ Market functionaries | Amount (₹/qt.) |
|---|---|---|
| A | Marketing costs at producer level | |
| 1. | Loading, unloading, weighing | 12 |
| 2. | Packaging | 40 |
| 3. | Transportation charge | 0 |
| 4. | Commission charge | 20 |
| 5. | Sub total | 72 |
| 6. | Producers’ sale price | 1800 |
| 7. | Net price received | 1728 |
| B | Cost incurred by village merchant | |
| 1. | Loading, unloading, weighing | 12 |
| 2. | Transportation charge | 40 |
| 3. | Others including mandi fees | 10 |
| 4. | Subtotal | 62 |
| 5. | Village merchant Purchase price | 1800 |
| 6. | Village merchant sell price | 1900 |
| 7. | Village merchant margin | 38 |
| C | Cost incurred by Whole sellers | |
| 1. | Loading, unloading, weighing | 12 |
| 2. | Transportation charge | 160 |
| 3. | Others including mandi fees | 10 |
| 4. | Subtotal | 82 |
| 5. | Whole sellers purchase price | 1900 |
| 6. | Whole sellers sell price | 2100 |
| 7. | Whole sellers’ margin | 118 |
| 8. | Producers share in consumer rupees (%) | 82.28 |
| 9. | Price Spread | 300 |
Table text extracted from the original PDF; superscript letters are shown inline. The original table image is below.
View original table image
References
5 in the original paper- Kumar G, Sangode PK, Digambar BM. Analyses the consumption and marketing pattern of maize among tribal families in Surguja district. Journal of Pharmacognosy and Phytochemistry. 2020;9(2S):160-161.
- Singh KK, Sisodia B, Sengar VS, Ahmad R, Singh RA, Singh GP, et al. Maize: A study on marketing aspects in Auraiya district of western U.P. Journal of Pharmacognosy and Phytochemistry. 2018;7(6):626-628.
- Naveen B, Jayaram MS, Swamy PS, Dhananjaya R, Ramesh GB, Raghavendra DV, et al. Marketing channels and price spread of banana in Chikkaballapur district of Karnataka. International Research Journal of Agricultural Economics and Statistics. 2015;6(1):18-22.
- Venkannanvara MM, Gaddi GM, Gracy CP. Growth Performance and Marketing of Maize in Karnataka, India. International Journal of Current Microbiology and Applied Sciences. 2019;8(10):380-387.
- Thombare R, Tawale J, Shelke R, Kamble S. Marketing cost, margin and price spread of maize in Aurangabad district of Maharashtra, India. The Pharma Innovation Journal. 2022;11:2814-2816.
Cited by 1
From OpenAlex, OpenCitations and reference lists read by Scinovex
- Harnessing brassinolide signaling to fortify maize against nickel toxicity: An integrative perspective on stress alleviation and adaptive responses ↗
Sonia Torabi, Fatemeh Rahmani · Plant Stress · 2025
• Nickel (Ni) toxicity disrupts amino acid metabolism in Zea mays seedlings. • EBR enhances antioxidant enzyme activities under Ni stress. • EBR elevates the contents of Pro, Glu, Cys, His, and Met amino acids. • mRNA levels of CYP and MRP genes increases with EBR, supporting Ni detoxification. This study investigates how 24-epibrassinolide (EBR, 10⁻² µM) alleviates nickel (Ni)…
❝ 3PDF