
Research article · 2023 · Full text
International Journal of Advanced Chemistry ResearchQuantitative determination of heavy metals in water using ICP-MS
Volume 5(1) · Pages 115–116 · DOI: 10.33545/26646781.2023.v5.i1b.192 ↗
Research areasAnalytical chemistry methods development
Abstract
Author-writtenThis research article investigates the application of inductively coupled plasma mass spectrometry (ICP-MS) for the quantitative determination of heavy metals in water samples. The study focuses on optimizing sample preparation techniques, assessing the analytical performance of ICP-MS, and evaluating its effectiveness in detecting trace levels of heavy metals such as lead (Pb), mercury (Hg), cadmium (Cd), and arsenic (As). Our results demonstrate the high sensitivity, precision, and accuracy of ICP-MS, making it a reliable tool for environmental monitoring and ensuring water quality.
Summary
Source-checkedPlain-language reading of the full paper, prepared with AI and checked against the text. Each point links to the authors' own words.
Why it matters
- Heavy metals are persistent pollutants in the environment that can seriously threaten ecosystems and human health. View evidence ↗
- Common analysis methods like AAS and ICP-OES are limited by their sensitivity and their ability to detect multiple elements simultaneously. View evidence ↗
- ICP-MS is considered an ideal technique for water analysis because it provides lower detection limits, a broader dynamic range, and the ability to analyze multiple elements at once. View evidence ↗
The question
- The study aims to optimize ICP-MS to ensure the accurate and reliable measurement of heavy metals in water. View evidence ↗
What they did
- The researchers collected water samples from tap water, lakes, and rivers. View evidence ↗
- Sample preparation involved filtering through 0.45 µm membranes and using a microwave digestion system with nitric and hydrochloric acids to dissolve metal species. View evidence ↗
- The study used certified stock solutions diluted with 1% HNO₃ to create calibration standards for arsenic (As), cadmium (Cd), mercury (Hg), and lead (Pb). View evidence ↗
What they found
- The detection limits were in the low parts per trillion (ppt) range: 1 ppt for Cd, 2 ppt for Hg, 3 ppt for As, and 5 ppt for Pb. View evidence ↗
- Calibration curves for all tested elements demonstrated excellent linearity (R² > 0.999) across a concentration range from 0.1 to 100 µg/L. View evidence ↗
- The method showed high precision with RSD values between 1.8% (Hg) and 2.5% (Cd), and high accuracy with recoveries ranging from 97% (Cd) to 102% (Hg). View evidence ↗
- Environmental samples showed the highest metal concentrations in River A (Pb: 1.5 µg/L, Hg: 0.3 µg/L, Cd: 0.1 µg/L, As: 2.0 µg/L) and the lowest in Tap Water C (Pb: 0.5 µg/L, Hg: 0.1 µg/L, Cd: 0.02 µg/L, As: 1.0 µg/L). View evidence ↗
What it means
- The authors conclude that ICP-MS is a highly effective tool for the quantitative determination of heavy metals in water. View evidence ↗
- The authors suggest that future work should address matrix interferences and improve sample introduction techniques to expand the use of ICP-MS. View evidence ↗
Figures & tables
From the original paper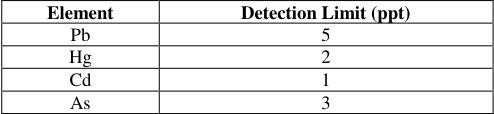 Table 1
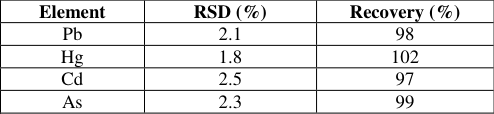 Table 2
 Table 3
Introduction
Heavy metals are persistent environmental pollutants that pose serious risks to human health and ecosystems. Monitoring their concentrations in water is essential for environmental protection and public health safety. Traditional methods for heavy metal analysis, such as atomic absorption spectroscopy (AAS) and inductively coupled plasma optical emission spectrometry (ICP-OES), have limitations in sensitivity and multi-element detection capabilities. Inductively coupled plasma mass spectrometry (ICP-MS) offers several advantages, including lower detection limits, broader dynamic range, and simultaneous multi-element analysis, making it an ideal technique for this purpose.
This study aims to optimize the use of ICP-MS for the accurate and reliable determination of heavy metals in water samples. Objective of paper The objective of this paper is to investigate the application and optimization of ICP-MS for the accurate and reliable quantitative determination of heavy metals in water samples.
Materials And Methods
Sample collection and preparation Water samples were collected from various sources, including rivers, lakes, and tap water. Samples were filtered through 0.45 µm membrane filters to remove particulate matter. Acid digestion was performed using a mixture of nitric acid (HNO₃) and hydrochloric acid (HCl) in a microwave digestion system to ensure complete dissolution of the metal species. Reagents and standards High-purity reagents and deionized water were used for all preparations.
Calibration standards for Pb, Hg, Cd, and as were prepared from certified stock solutions by serial dilution with 1% HNO₃. Internal standards (e.g., yttrium) were used to correct for matrix effects and instrumental drift. ICP-MS instrumentation An Agilent 7700x ICP-MS equipped with a Quadrupole mass spectrometer and a collision/reaction cell was used for the analysis. The instrument parameters were optimized for maximum sensitivity and minimal interference, including: IJACR 2023; 5(1): 115-116 Dr.
Osama Abdallah Department of Environmental Chemistry, University of Khartoum, Sudan Khalid Bashir Department of Environmental Chemistry, University of Khartoum, Sudan Dr. Osama Abdallah Department of Environmental Chemistry, University of Khartoum, Sudan https://www.chemistryjournals.net metals, with some samples exceeding the permissible limits set by environmental regulations.
Conclusion
Inductively coupled plasma mass spectrometry (ICP-MS) is a highly effective technique for the quantitative determination of heavy metals in water. The method offers superior sensitivity, precision, and accuracy, making it suitable for environmental monitoring and ensuring water quality. The optimization of sample preparation techniques and the analytical performance evaluation confirm the reliability of ICP-MS for detecting trace levels of heavy metals. Future research should focus on further improving sample introduction techniques and addressing challenges related to matrix interferences to enhance the applicability of ICP-MS in various environmental contexts.
Results And Discussion
Detection limits and sensitivity The detection limits for Pb, Hg, Cd, and as were found to be in the low parts per trillion (ppt) range, demonstrating the high sensitivity of ICP-MS. Table 1 summarizes the detection limits for each element. Table 1: Detection limits for heavy metals using ICP-MS Element Detection Limit (ppt) Pb 5 Hg 2 Cd 1 As 3 Linearity and calibration The calibration curves for all elements showed excellent linearity (R² > 0.999) over the concentration range of 0.1 to 100 µg/L. Figure 1 illustrates the calibration curves for Pb and As representative examples.
| Element | Detection Limit (ppt) |
|---|---|
| Pb | 5 |
| Hg | 2 |
| Cd | 1 |
| As | 3 |
Table text extracted from the original PDF; superscript letters are shown inline. The original table image is below.
View original table image
Precision and accuracy The precision of ICP-MS, expressed as RSD, was better than 3% for all elements. Accuracy was confirmed by analyzing certified reference materials, with recoveries ranging from 95% to 105%, indicating the reliability of the method. Table 2 presents the precision and accuracy data for each element. Table 2: Precision and accuracy of ICP-MS for heavy metal analysis Element RSD (%) Recovery (%) Pb 2.1 98 Hg 1.8 102 Cd 2.5 97 As 2.3 99 Table 3: Concentrations of heavy metals in environmental water samples Sample Source Pb (µg/L) Hg (µg/L) Cd (µg/L) As (µg/L) River A 1.5 0.3 0.1 2.0 Lake B 0.8 0.2 0.05 1.5 Tap Water C 0.5 0.1 0.02 1.0 Application to environmental samples ICP-MS was applied to the analysis of water samples from various sources.
| Sample Source | Pb (µg/L) | Hg (µg/L) | Cd (µg/L) | As (µg/L) |
|---|---|---|---|---|
| River A | 1.5 | 0.3 | 0.1 | 2.0 |
| Lake B | 0.8 | 0.2 | 0.05 | 1.5 |
| Tap Water C | 0.5 | 0.1 | 0.02 | 1.0 |
Table text extracted from the original PDF; superscript letters are shown inline. The original table image is below.
View original table image
| Element | RSD (%) | Recovery (%) |
|---|---|---|
| Pb | 2.1 | 98 |
| Hg | 1.8 | 102 |
| Cd | 2.5 | 97 |
| As | 2.3 | 99 |
Table text extracted from the original PDF; superscript letters are shown inline. The original table image is below.
View original table image
The concentrations of heavy metals detected in these samples are summarized in Table 3. The
Results
highlight the presence of trace levels of heavy
References
8 in the original paper- Feldmann J, Salaün P. Trace metal analysis with ICP- MS. Compr Anal Chem. 2012;59:285-302.
- Becker JS. Inorganic Mass Spectrometry: Principles and Applications. John Wiley & Sons; c2007.
- Thomas R. Practical Guide to ICP-MS: A Tutorial for Beginners. CRC Press; c2013.
- U.S. Environmental Protection Agency. Method 200.8: Determination of trace elements in waters and wastes by inductively coupled plasma-mass spectrometry. EPA; c1994.
- May TW, Wiedmeyer RH. A Table of Polyatomic Interferences in ICP-MS. At Spectrosc. 1998;19(5):150- 5.
- Hieftje GM, Vickers TJ. Fundamental aspects of plasma-based spectrochemical techniques. Spectrochim Acta B AT Spectrosc. 2008;63(6):478-96.
- Larsen EH, Hansen M, Gammelgaard B. Speciation analysis of arsenic and selenium compounds by coupling of HPLC to ICP-MS. Trends Anal Chem. 1997;16(9):466-79.
- Montaser A, Editor. Inductively Coupled Plasma Mass Spectrometry. Wiley-VCH; c1998. RF power: 1550 W Nebulizer gas flow rate: 1.05 L/min Collision gas (He) flow rate: 4.5 mL/min Integration time: 0.1 s per isotope Analytical performance evaluation The analytical performance of ICP-MS was assessed in terms of detection limits, linearity, precision, and accuracy. Detection limits were determined as three times the standard deviation of the blank signal. Linearity was evaluated using calibration curves over a concentration range of 0.1 to 100 µg/L. Precision was expressed as the relative standard deviation (RSD) of replicate measurements, and accuracy was verified using certified reference materials.
Cited by 7
From OpenAlex, OpenCitations and reference lists read by Scinovex
- Integrated Monitoring of Heavy Metals in Aquatic Environments: Pollution Indices, Analytical Techniques, Bioindicators and Real-Time Detection Platforms ↗
Jaspreet Singh Aulakh, Deepika P. Joshi, Gurvinder Kaur · Water Conservation Science and Engineering · 2026
❝ 0 - Heavy Metals and Metalloids in Food, Water, and Soil: Propagation Pathways Diagnostic Analytical Technique Practices ↗
Yetzin Rodríguez-Mejía, Josue Abraham Lara Zavala, Naveen Kumar Reddy Bogireddy, Victor Barba · Current Pollution Reports · 2026
Purpose of Review This review looks at how the chemical forms, movement, and availability of metal and metalloid contaminants affect food safety and public health. It brings together recent developments in detecting these contaminants in soil, water, and food, and points out the move from traditional lab methods to newer diagnostic tools. Recent Findings In the past five years, research…
❝ 0PDF - ICP AES assessment of lead, mercury and determination of impact on animal productivity
Sushant Sole, Kunal S Kambale, Rajiv V. Gaikwad, P. V. Meshram · International Journal of Biology Sciences · 2025
This study aims to assess the contamination of heavy metals (Arsenic, Mercury, Cadmium, and Lead) in buffalo milk and water from farms located near industrial areas in India, where pollution risks are higher due to nearby industrial developments. Agriculture, particularly the dairy sector, plays a significant role in sustaining poor farmers and the broader farming community in India, which is one of the largest and fastest-growing markets for milk and milk products. However, environmental pollution, including heavy metals, poses a potential threat to public health and animal well-being. Long-t
- Impact of cookware on nutritional security and sustainability: A scoping review ↗
Yashna Bawa, Anupreet Kaur Sobti · International Journal of Home Science · 2025
Nutritional security and sustainability are critical global issues, influenced by various factors including the type of cookware used in food preparation. Different cookware materials affect nutrient retention, food safety, and environmental sustainability in unique ways. This scoping review aims to examine the impact of traditional and modern cookware materials on nutritional security and sustainability, highlighting their advantages, disadvantages, and roles
- Study of the effect of the biological element lead on human brain cells: Cellular and molecular mechanisms ↗
Zainab J Kadhim, Ibtihaj Ahmed Kadhim, Azhar Saeed Mohammed, Shaimaa Kadhim Abd alhussen · International Journal of Research in Medical Science · 2025
Introduction: One of the most common harmful substances found in the environment is lead. Through the air, it penetrates the human body. water, and airborne contaminants and accumulates in vital tissues, especially the brain. Scientific research has demonstrated the serious cognitive and neurological disorders resulting from exposure to high levels of lead. Objective: With an emphasis on the environmental and
- AI-Driven optimization of nanoparticle synthesis for enhanced heavy metal removal from wastewater ↗
Andika Putra, Siti Rahmawati, Muhammad Rindu Fajar, Dwi Yuliana · International Journal of Computing and Artificial Intelligence · 2025
❝ 0Found by Scinovex - Bioaccumulation and histopathological alterations in Clarias batrachus exposed to heavy metals in the aquatic ecosystem of Durg district, Chhattisgarh ↗
Harsh Kumar, Ravinder Pal Singh · Acta Entomology and Zoology · 2024
The present study investigates the bioaccumulation of heavy metals and associated histopathological alterations in Clarias batrachus (walking catfish) from selected aquatic ecosystems in Durg District, Chhattisgarh. This region, characterized by increasing industrial and agricultural activities, presents potential sources of metal contamination in freshwater bodies. Water, sediment, and fish samples were collected from three sites (high, moderate, and low contamination zones)