
Research article · 2024 · Full text
International Journal of Geography Geology and EnvironmentAssessment of electromagnetic radiation on human brain at different regions in Al-Najaf city, Iraq
Volume 6(1) · Pages 478–486 · DOI: 10.22271/27067483.2024.v6.i1f.253 ↗
Research areasElectromagnetic Fields and Biological EffectsNoise Effects and Management
Abstract
Author-writtenThis work points to the study of the effects of Electromagnetic Radiation (Electric and magnetic fields) on human health (Brain) in fifteen different locations divided into three sections: north, middle, and south in Al-Najaf City, Iraq. The practical readings for each location were done using a JD-3001 Geiger counter, a type of dosimeter detector, a portable device from Dongguan Jinlide Electronic Technology Co., Ltd, China. Two times readings were taken morning and evening. So, the total reading was thirty readings grouped into two groups and continued for two months from September to November 2023. The data were transferred to the computer and stimulated with different programs Microsoft Excel, Geographic Information System (GIS), and Statistical Program for Social Science (SPSS), Then compared with the acceptable limit recommended by ICNIRP, IEEE, and ITU. The results show that according to the readings of electric and magnetic fields, the minimum values were in Al-Mkrama and Al-Madena for both morning and evening periods. Also, readings of electric and magnetic fields in the evening show that the maximum values were in Al-Ansar and Al-Judayda for the morning readings, and for the evening readings Al-Nidaa and Al-Ameer. For the power density, the minimum readings in the morning and evening were Al-Makrama and Al-Madena respectively, the main reason is that Power density is related to electric and magnetic fields which means the results conform with each other. On the other hand, the maximum readings of Power density are Al-Nasor and Al-Ameer. The values of Specific Absorption Radiation (Related to the human brain) at (σ = 0.3300 and σ = 0.0042) were the minimum values in the morning in Al-Makrama and the highest value was in Al-Ansaar. For the evening readings, the minimum value was in Al-Madena and the highest value was in Al-Ameer. The values of Power Density and Specific Absorption Radiation conform with each other, by the correlation relation between them. This means there is a significant relation at p
Summary
Source-checkedPlain-language reading of the full paper, prepared with AI and checked against the text. Each point links to the authors' own words.
Why it matters
- There are scientific concerns about how non-ionizing radiation from common electrical and wireless devices in homes and workplaces may negatively affect human and public health. View evidence ↗
- Many international organizations view electromagnetic radiation as a form of environmental pollution and have established laws and specifications to limit its harmful effects on human health. View evidence ↗
The question
- The study aims to assess the effects of electric and magnetic field radiation on the human brain across fifteen different locations in Al-Najaf City, Iraq. View evidence ↗
What they did
- The researchers used a portable JD-3001 Geiger counter dosimeter detector to collect radiation readings. View evidence ↗
- A total of thirty readings were taken across the locations, with measurements performed in both the morning and evening over a two-month period from September to November 2023. View evidence ↗
- The study focused on two key parameters to evaluate the effect on the brain: power density (PD) and specific absorption radiation (SAR). View evidence ↗
- Data were analyzed using Microsoft Excel, GIS, and SPSS, and then compared against safety limits recommended by ICNIRP, IEEE, and ITU. View evidence ↗
What they found
- Morning electric field values ranged from 28.25 V/m (Al-Makrama) to 39 V/m (Al-Ansaar), while evening values ranged from 24.5 V/m (Al-Madena) to 38.25 V/m (Al-Ameer). View evidence ↗
- Morning magnetic field values ranged from 2.49 µT (Al-Makrama) to 3.98 µT (Al-Judayda), and evening values ranged from 1.81 µT (Al-Madena) to 3.37 µT (Al-Nidaa). View evidence ↗
- For σ = 0.3300, morning SAR values ranged from 0.2532 W/kg (Al-Makrama) to 0.4862 W/kg (Al-Ansar), and evening values ranged from 0.1905 W/kg (Al-Madena) to 0.4642 W/kg (Al-Ameer). View evidence ↗
- Statistical analysis showed a significant relationship between humidity and the electric field (p < 0.05), but no significant relationship between humidity and the magnetic field (p < 0.05). View evidence ↗
What it means
- The authors conclude that all measured values for electric fields, magnetic fields, PD, and SAR were below the ICNIRP recommended limits (1 mW/m² and 2 W/kg) and do not pose a health risk to the human body. View evidence ↗
- The authors suggest that lower radiation levels in Al-Makrama and Al-Madena may be due to the open nature of the first location and the limited use of electronic communications in the second. View evidence ↗
Visual summary
3 visualsIllustrations explain the paper; charts are replotted from the paper's own table values.
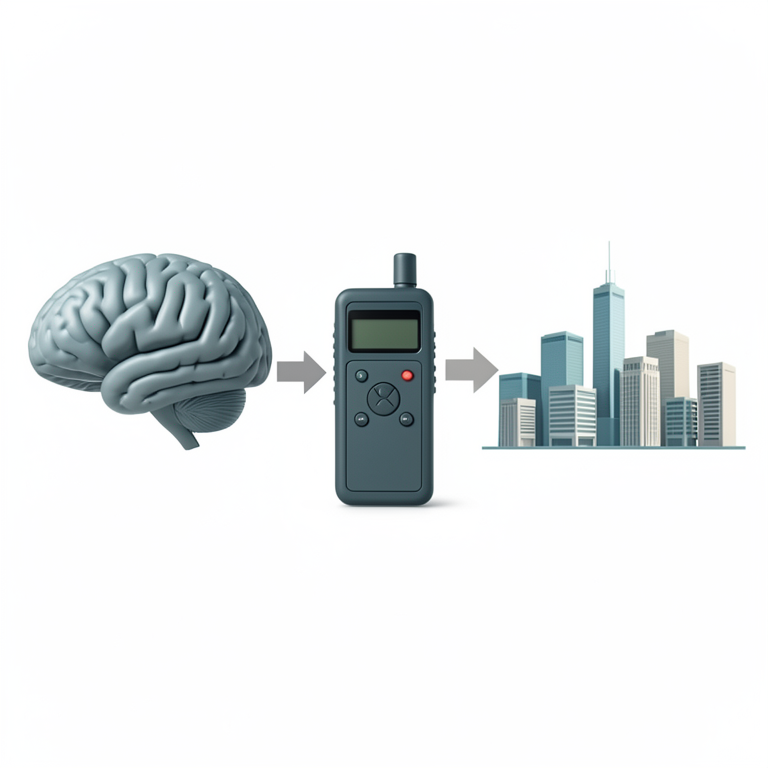
Study Design Workflow
AI-generated conceptual illustration (human brain and a portable Geiger counter dosimeter). It explains the idea and does not show study data.
View source evidence ↗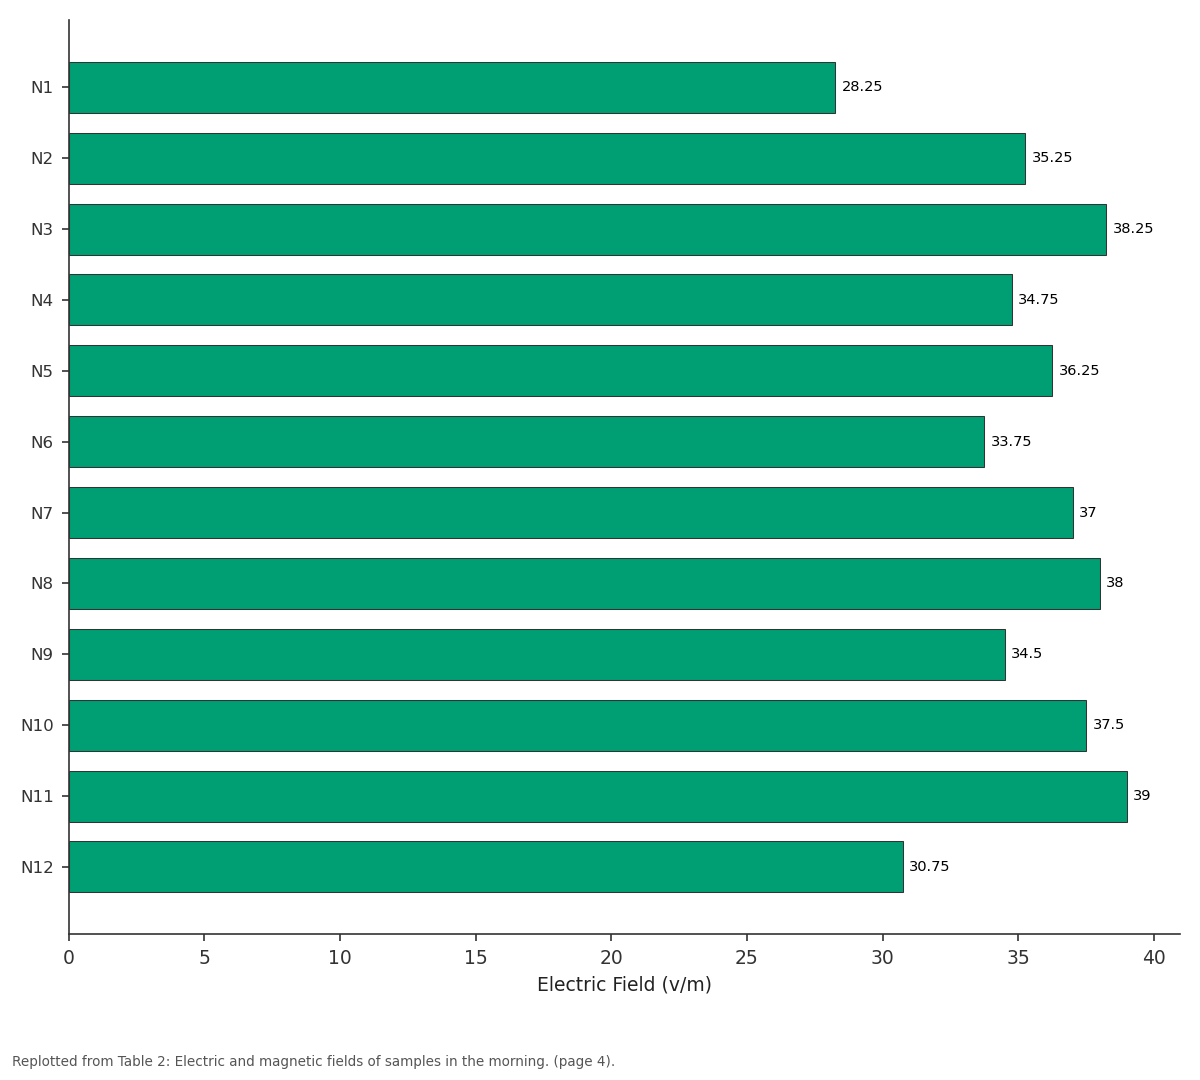
Electric Field (v/m): N1 vs N2 vs N3 vs N4 vs N5
Replotted from Table 2 (page 4) of the original paper. Every bar is the paper's own table value.
View source evidence ↗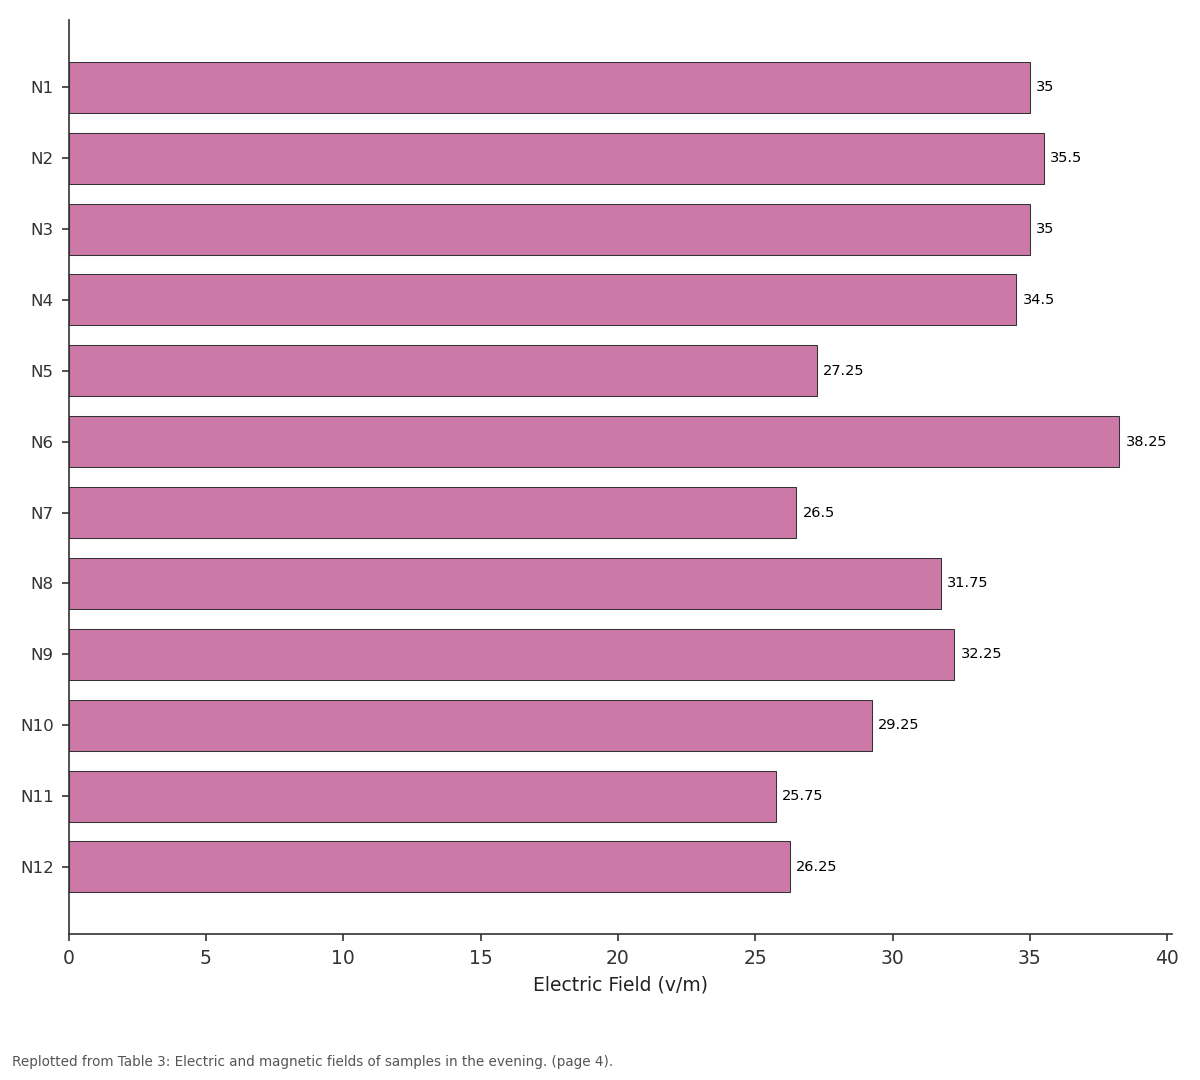
Electric Field (v/m): N1 vs N2 vs N3 vs N4 vs N5
Replotted from Table 3 (page 4) of the original paper. Every bar is the paper's own table value.
View source evidence ↗Figures & tables
From the original paper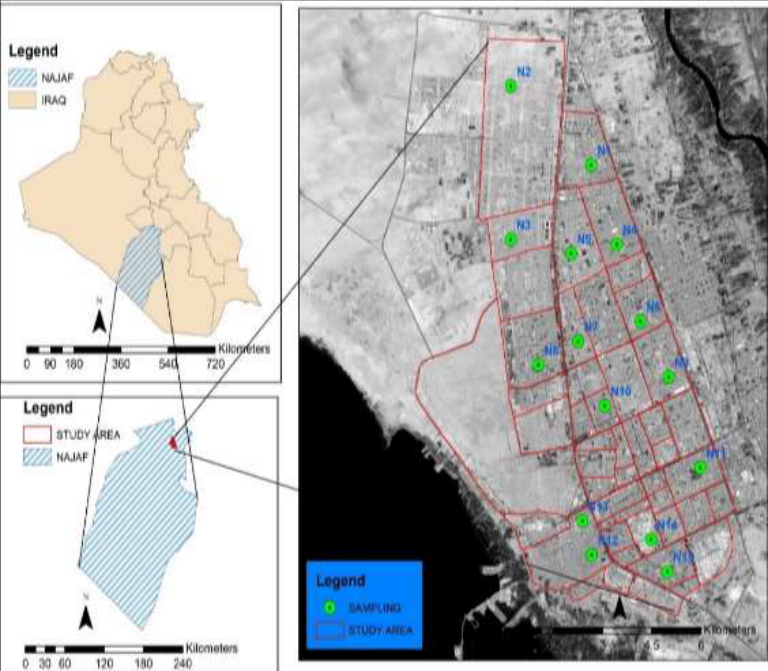 Figure 1
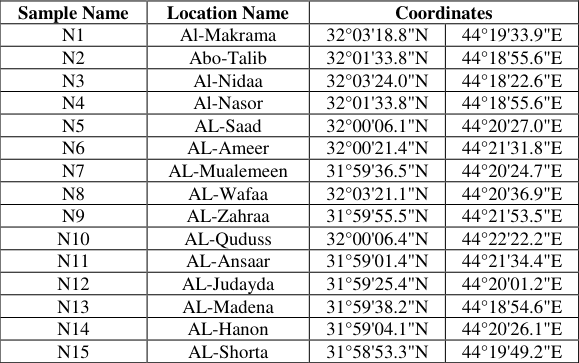 Table 1
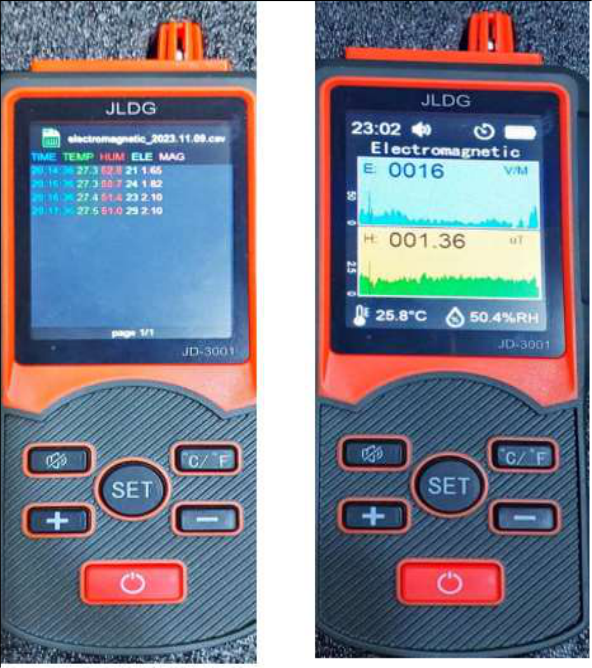 Figure 2
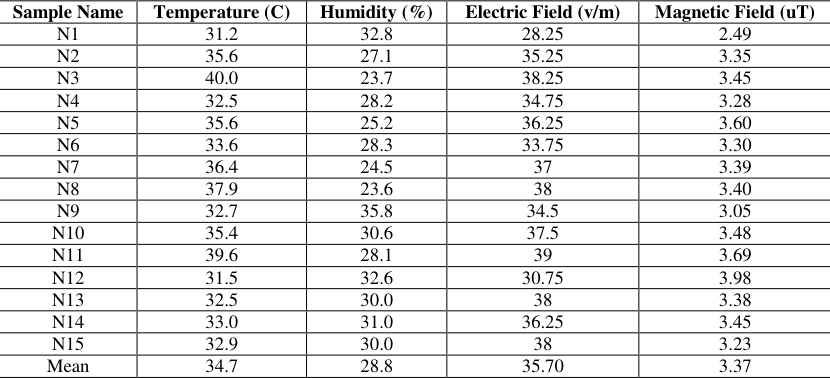 Table 2
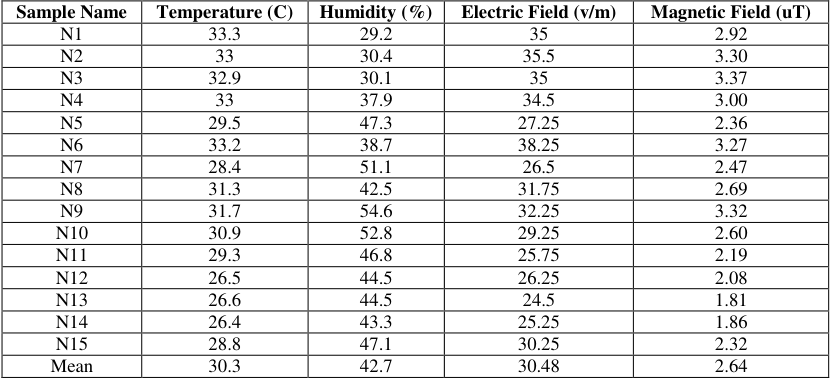 Table 3
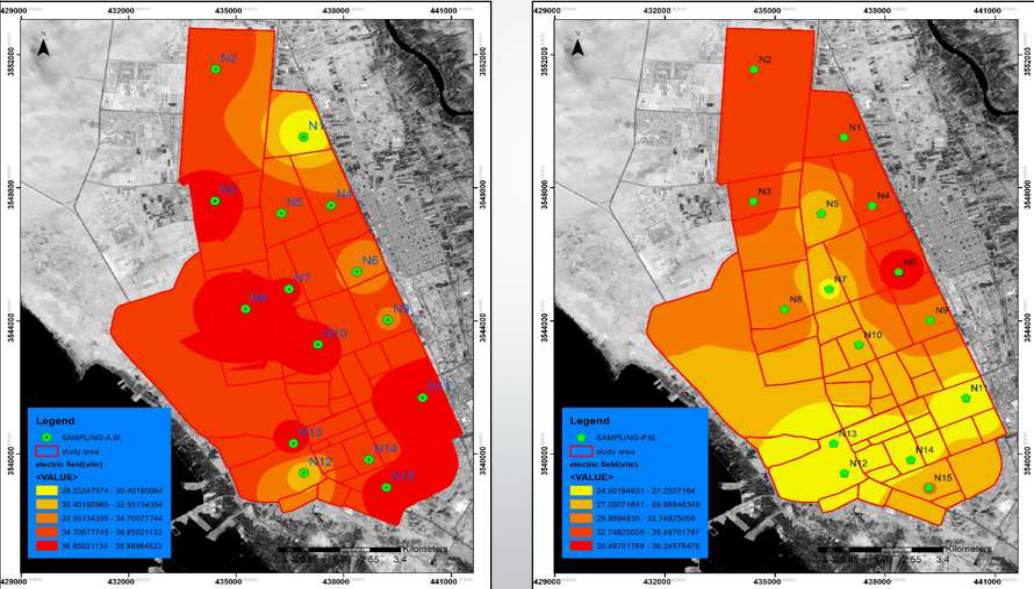 Figure 3
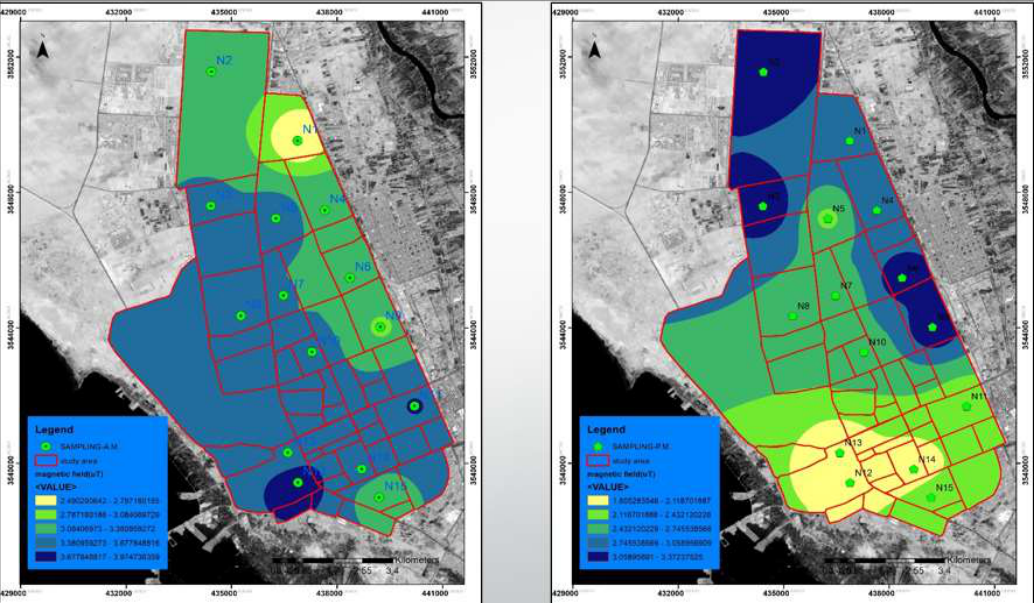 Figure 4
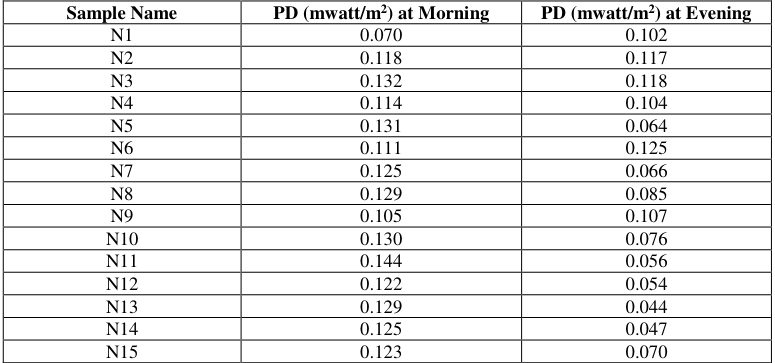 Table 4
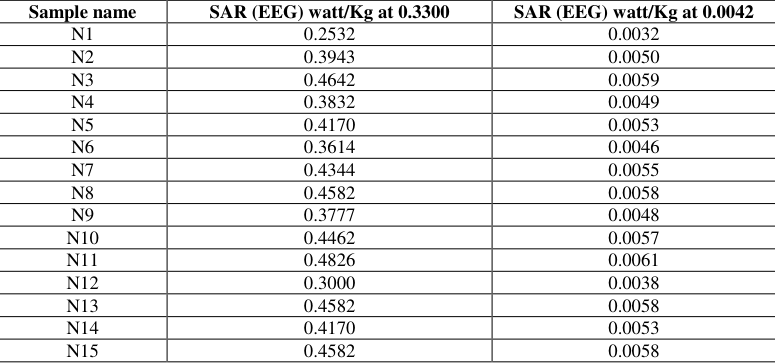 Table 5
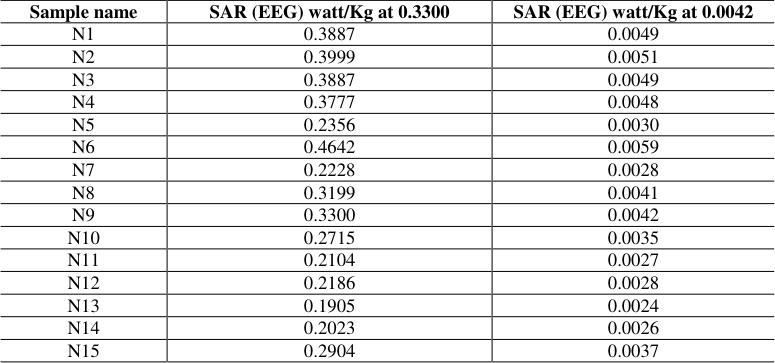 Table 6
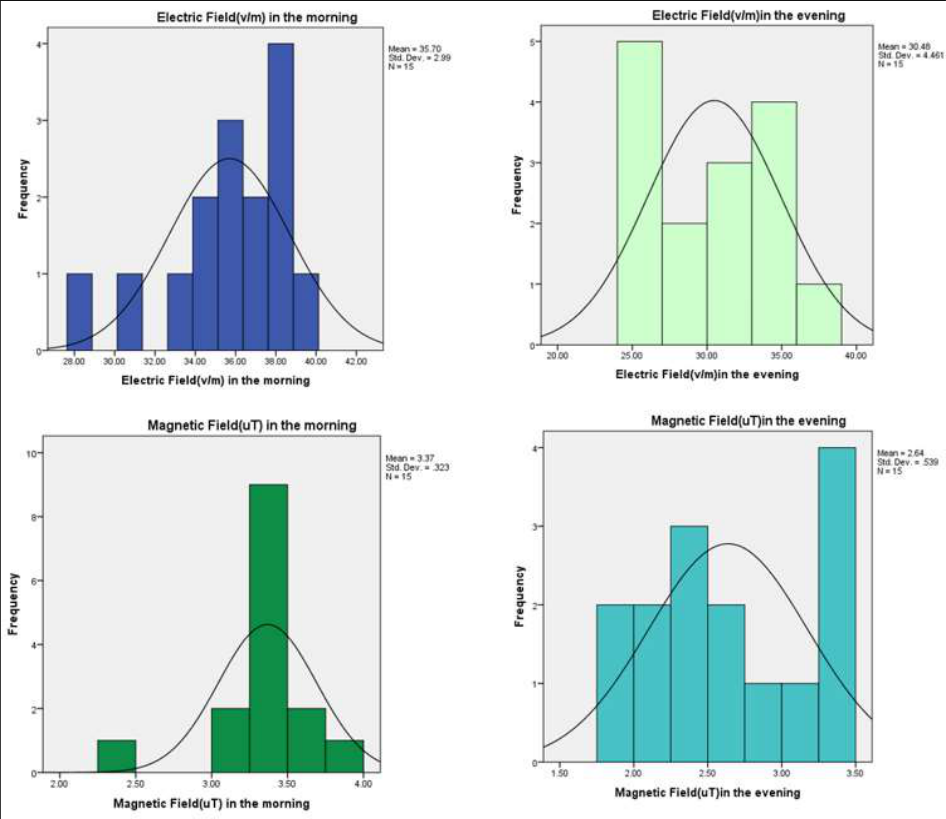 Figure 5
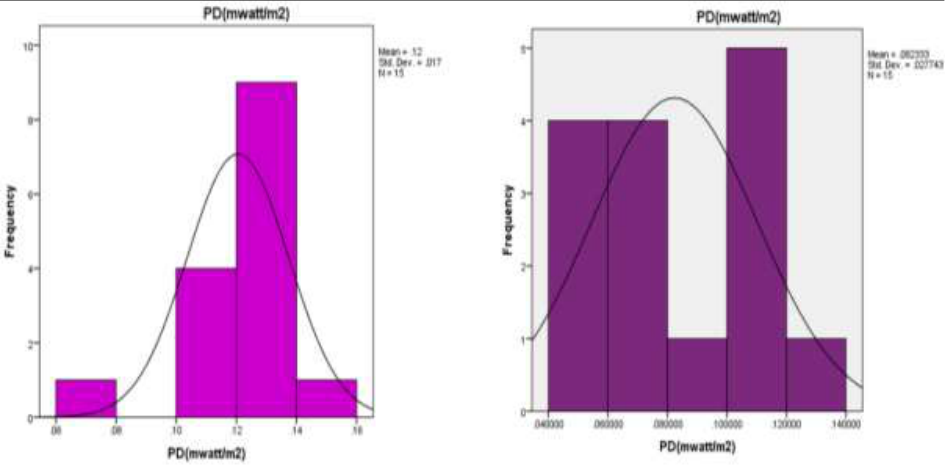 Figure 6
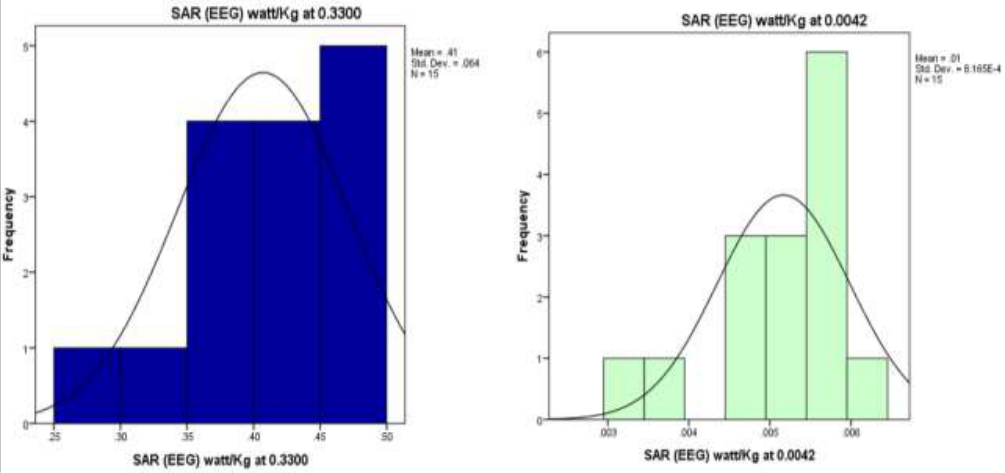 Figure 7
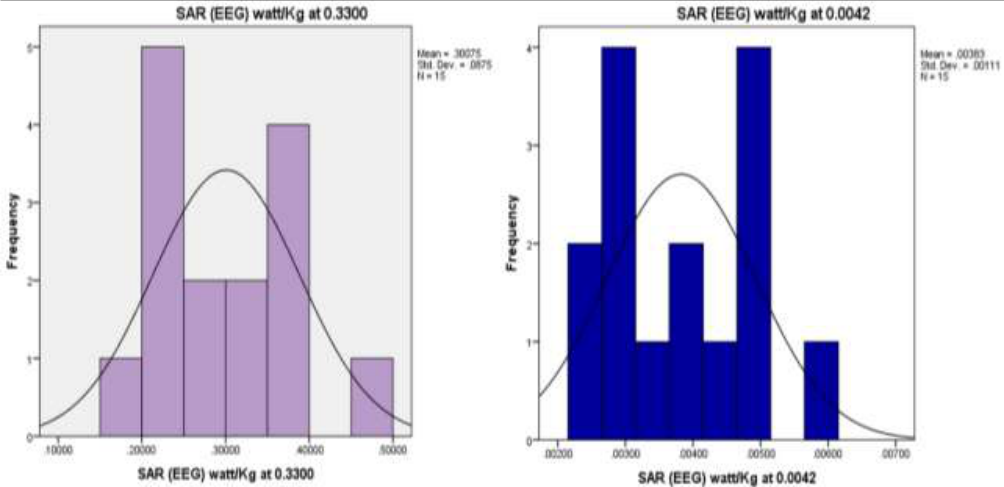 Figure 8
Introduction
Concerns regarding the detrimental effects of non-ionizing radiation on human and public health resulting from exposure to electromagnetic fields emitted by certain power, electrical, and wireless devices that are frequently found in homes, workplaces, schools, and communities have been expressed in a number of scientific publications (Mohammadreza Aghaei et al. 2012) [1] . Electromagnetic field (EMF) radiation, which is produced when energy-containing photons travel across space. Radiation may be classified into several categories depending on how much energy is present. Ionizing radiation and non-ionizing radiation (NIR) are the two categories into which electromagnetic field radiations fall. Ionizing radiations have enough energy to break the bond between electrons in atoms or molecules, forming ions in the process. X-rays and UV radiation are two types of ionizing radiation (Shashank Vijay 2017) [2] . A sort of energy that radiates or emits energy away from its source is known as non-ionizing radiation. Energy comes in a variety of forms, each having unique physical characteristics that may be quantified and expressed in wavelengths and frequencies. There are three different wave frequencies: high, medium, and low (Mann and Röschke 2004) [3] . The majority of studies on the detrimental effects of nonionizing radiation on health have focused on three main categories of anthropogenic non-ionizing radiation, which are as follows: First, power lines, electrical appliances, and electronic devices emit very low frequency electromagnetic radiation (EMR) (Mohammed et al. 2013) [4] . The second is electrical pollution, which arises from the operation of some electronic devices (like energy-efficient appliances, variable speed motors, plasma televisions, etc.) that can produce frequency signals in the 3-150 kHz range, which then travel through and radiate from the wiring in impacted houses and other structures (A. Sanyal and 2002) [5] . Third, wireless telecommunications equipment including cell towers, wireless phones, antennas, and broadcast transmission towers emit microwaves and radiofrequency waves (Leung et al. 2011) [6] . Previous studies have shown that the harmful effects of EMR include humans, animals, plants, and the entire ecosystem (Ziegelberger, Gunde 2020) [7] (Tsai and Hamblin 2017) [8] (Shivanagouda Mudigoudra, Kiran Ragi, Mahesh Kadennavar, Naveen Danashetty, Prashant Sajjanar, Arun Y Patil, Sridhar M 2020) [9] (Pournoori, Delavari H., and Madah 2023) [10] (Pooja Jangid, Umesh Rai and 2022) [11] (Manana Kachakhidze 2023) [12] . It is also clear that many international organizations concerned with environmental affairs and developed countries consider electromagnetic radiation as a type of environmental pollution (EP). Therefore, it established specifications and enacted laws to limit its harmful effects on humans health. The recenct study focuse on assessment of electromagnetic radiation in different regions in Al-Najaf City, Iraq.
Materials and Methods
Materials and Methods
Area of Study
Najaf is a city with a population of 1,500,522 people (According to 2017 statistics). Its geographical area is 28,824 square kilometers, and it lies within a longitude of 44º19' E and the latitude of 31º59' N and is 70 meters above the mean sea level (K. Abdulkareem 2018) [13] . The city of Najaf is one of the most important administrative centers in the holy city of Najaf. To its north lies the city of Al-Haydariyah at a distance of (40 km), and from its east is the city of Kufa, at a distance of (10 km), and adjacent to it from the southeast is located the city of Al-Manazira at a distance of (25 km), while the course of the Euphrates River lies on its western side (Hussein et al. 2020) [14] , as shown in figure (1).
Fig 1: Najaf City Area
Fig 1: Najaf City Area
Collection of Readings
Thiry recorded readings were collected to be studied in this research, fifteen were recorded in the morning and the other fifteen were in the evening for the same location for Najaf city using a dosimeter detector named JD-3001 Geiger counter, during September and November 2023, then took the average readings for each location (day and night) to estimate the electromagnetic radiation. The data in Table (1.1) is stimulated with GIS and SPSS programs to show the variations of electromagnetic radiation for the area under study.
"E
Detection System: There are several types of detectors such as a gaseous detector, solid-state nuclear track detectors, semiconductor detectors, etc. The factor that determines the most suitable type of detector depends on the type of sample and auxiliary equipment in the laboratory. In this study, a modern dosimeter detector called a Geiger counter was used with specific properties.
Geiger counter: JD-3001 Geiger counter is a type of dosimeter detector. It's a portable device from Dongguan Jinlide Electronic Technology Co., Ltd, China. The operating system of the device for temperature: (0 °C -50 °C), humidity: (RH 10% -RH 80%). The most important property of the device is that switching between nuclear radiation and electromagnetic radiation. In addition, the two types of radiations could be calculated at the same time according to the adjustment of the device, also the time adjusted for five minutes as shown in figure (2). The nuclear response time is three seconds, dose rate response: is < ± 20% (1 µSv/h -99.99 mSv /h), and energy response: is < ± 30% (48 Kev -1.3Mev). For electromagnetic radiation, the precision: (electric field: 1V/m; magnetic field: 0.01µT), the alarm threshold value: (electric field: 50 V/m; magnetic field: 0.3µT), the range:
(electric field: 1V/m -1999 V/m; magnetic field: 0.01µT-999.99µT). The power supply is built in a 3.7V lithium battery and it can be charged with cable or to the laptop device. It can detect electromagnetic waves emitted by general electrical appliances, such as computers, televisions, mobile phones, microwave ovens, and other commonly used electrical appliances. Anti-interference ability, capable of reliable operation in complex electromagnetic environments. Also, the device is provided with a cable to transfer data from the device to the computer as Excel data.
Mathematical Equations
To study the effect of electromagnetic radiation on human health two important parameters must be included which are power density (PD), and specific absorption radiation (SAR) these two parameters focus on the effect of electromagnetic radiation on the brain, that computed according to an international recommended values of 2 watt/Kg and BL of 0.001 (Dhami 2011, Union 2021) [15,16] , as follows (Admawi 2021) [17] :
(1) = Mass density of human brain tissue (kg/m 3 ).
Results
The current research focused on calculating PD and SAR by knowing the values of electric and magnetic fields to find the effect on the human brain, then copared these values with the biological limit (BL) and ICNIRP. Also, it uses GIS technical program and SPSS for mapping and drawing electromagnetic radiations and related parameters for all samples under studyAn important statistical calculation were found by using SPSS program (for both readings day and night) such as: Mean, Median, Mode, Standard Deviation, Variance, Range, Minimum, Maximum, Sum. This is connected with correlations between all variables which are: temperature, humidity, electric field and magnetic field.
Calculate of Electric and Magnetic Field
The values of the electric and magnetic field were taken directly from the JD-3001 Geiger counter and for all thirty readings (day and night), as shown in table (2) and table (3), as a set to find PD, SAR, and BL for each location under study, then compared with international values by (ICNIRP). Also, maps with GIS programs are drawn for electric and magnetic fields for the area under study as shown in figures ( 3) and ( 4).
Calculate of Power Density (PD)
The values of power density are found by using equation ( 1), as mentioned in chapter two, these values are for both electric and magnetic fields, as shown in table (4) below to find the maximum and minimum values and then compared with international health institutions (Union 2021) [16] .
Calculate Specific Annual Radiation (SAR)
The values of Specific Annual Radiation (SAR) is found by using equation ( 2), these values are for both of day and night, as shown in tables ( 5) and table (6) below to find the maximum and minimum values and then compared with international health institutions (ICNIRP 2022, Matthes et al. 1998) [18,19] .
Discussion
In this study, the values for all variables which are: Temperature, humidity, Electric field, Magnetic field, Power Density, and Specific Annual Radiation were used to find their values and study the relation between them, then compared with the acceptable limit recommended by ICNIRP. In the same time all values were drawn and described by SPSS, version 28.0. For electric and magnetic fields, from tables (2) and ( 3), the electric field in the morning the minimum value is 28.25 v/m which is N1 in (Al-Makrama) and the maximum value is 39 v/m in N11 for (Al-Ansaar), while in the evening the minimum value is 24.5 v/m which is N13 in (Al-Madena) and the maximum value is 38.25 v/m in N6 at (Al-Ameer). At the same time, for the magnetic field in the morning, the minimum value is 2.49µT in N1 for (Al-Makrama) and the maximum value is 3.98µT in N12 at (Al-Judayda), on the other hand for the magnetic field in the evening the minimum value is 1.81µT at N13 in (Al-Madena) and the maximum value is 3.37µT at N3 in (Al-Nidaa). Figure (5) shows the histogram distribution of Electric and Magnetic Fields at day and night for all areas under study.
Conclusion
During the work of the current study, the following conclusions were reached: 1. According to the readings of electric and magnetic fields, the minimum values were in Al-Mkrama and Al-Madena for both morning and evening periods, this may be for the first place is an opening place with less distortion of different types of electromagnetic radiation and the second place is old that people there did not use a lot of electronic communications. All values were below the international limit. 2. Also, readings of electric and magnetic fields in the evening show that the maximum values were in Al-Ansar and Al-Judayda for the morning readings, and for the evening readings Al-Nidaa and Al-ameer, this may be related to many reasons such as the first place is near the airport and the tawers of communications, and the second place is an old place with many schools and a large number of old buildings. All values were below the international limits.
3. The relation between temperature and humidity with electric and magnetic fields shows that according to the tables and correlation relations, humidity had an effect on the electric field which means there is a significant relation at p < 0.05, but no effect on the magnetic field which means there is no significant relation at p < 0.05. 4. For the power density, the minimum readings in the morning and evening were Al-Makrama and Al-Madena respectively, the main reason is that PD is related to electric and magnetic fields which means the results are conforming with each other. On the other hand, the maximum readings of PD are Al-Nasor and Al-Ameer, this is because the first place is conforming with maximum readings of electric and magnetic fields, but the second place is the variance between areas and using different communication devices. All values of PD are low the acceptable recommendation values of 1 mwatt/m 2 by ICNIRP and ITU. 5. The values of SAR at (σ = 0.3300 and σ = 0.0042) were the minimum values in the morning in al-Makrama and the highest value was in Al-Ansaar, and for the evening readings, the minimum value was in Al-Madena, and the highest value in Al-Ameer. 6. The values of PD and SAR conform with each other, this could be proved by the readings value from the table and drawings, and by the correlation relation between them. This means there is a significant relation at p< 0.05.
Finally, all values were under recommaned limits and did not poss a harmful to the people.
Figures and tables from the paper
| Sample Name | Location Name | Coordinates | — |
|---|---|---|---|
| N1 | Al-Makrama | 32°03'18.8"N | 44°19'33.9"E |
| N2 | Abo-Talib | 32°01'33.8"N | 44°18'55.6"E |
| N3 | Al-Nidaa | 32°03'24.0"N | 44°18'22.6"E |
| N4 | Al-Nasor | 32°01'33.8"N | 44°18'55.6"E |
| N5 | AL-Saad | 32°00'06.1"N | 44°20'27.0"E |
| N6 | AL-Ameer | 32°00'21.4"N | 44°21'31.8"E |
| N7 | AL-Mualemeen | 31°59'36.5"N | 44°20'24.7"E |
| N8 | AL-Wafaa | 32°03'21.1"N | 44°20'36.9"E |
| N9 | AL-Zahraa | 31°59'55.5"N | 44°21'53.5"E |
| N10 | AL-Quduss | 32°00'06.4"N | 44°22'22.2"E |
| N11 | AL-Ansaar | 31°59'01.4"N | 44°21'34.4"E |
| N12 | AL-Judayda | 31°59'25.4"N | 44°20'01.2"E |
| N13 | AL-Madena | 31°59'38.2"N | 44°18'54.6"E |
| N14 | AL-Hanon | 31°59'04.1"N | 44°20'26.1"E |
| N15 | AL-Shorta | 31°58'53.3"N | 44°19'49.2"E |
Table text extracted from the original PDF; superscript letters are shown inline. The original table image is below.
View original table image
| Sample Name | Temperature (C) | Humidity (%) | Electric Field (v/m) | Magnetic Field (uT) |
|---|---|---|---|---|
| N1 | 31.2 | 32.8 | 28.25 | 2.49 |
| N2 | 35.6 | 27.1 | 35.25 | 3.35 |
| N3 | 40.0 | 23.7 | 38.25 | 3.45 |
| N4 | 32.5 | 28.2 | 34.75 | 3.28 |
| N5 | 35.6 | 25.2 | 36.25 | 3.60 |
| N6 | 33.6 | 28.3 | 33.75 | 3.30 |
| N7 | 36.4 | 24.5 | 37 | 3.39 |
| N8 | 37.9 | 23.6 | 38 | 3.40 |
| N9 | 32.7 | 35.8 | 34.5 | 3.05 |
| N10 | 35.4 | 30.6 | 37.5 | 3.48 |
| N11 | 39.6 | 28.1 | 39 | 3.69 |
| N12 | 31.5 | 32.6 | 30.75 | 3.98 |
| N13 | 32.5 | 30.0 | 38 | 3.38 |
| N14 | 33.0 | 31.0 | 36.25 | 3.45 |
| N15 | 32.9 | 30.0 | 38 | 3.23 |
| Mean | 34.7 | 28.8 | 35.70 | 3.37 |
Table text extracted from the original PDF; superscript letters are shown inline. The original table image is below.
View original table image
| Sample Name | Temperature (C) | Humidity (%) | Electric Field (v/m) | Magnetic Field (uT) |
|---|---|---|---|---|
| N1 | 33.3 | 29.2 | 35 | 2.92 |
| N2 | 33 | 30.4 | 35.5 | 3.30 |
| N3 | 32.9 | 30.1 | 35 | 3.37 |
| N4 | 33 | 37.9 | 34.5 | 3.00 |
| N5 | 29.5 | 47.3 | 27.25 | 2.36 |
| N6 | 33.2 | 38.7 | 38.25 | 3.27 |
| N7 | 28.4 | 51.1 | 26.5 | 2.47 |
| N8 | 31.3 | 42.5 | 31.75 | 2.69 |
| N9 | 31.7 | 54.6 | 32.25 | 3.32 |
| N10 | 30.9 | 52.8 | 29.25 | 2.60 |
| N11 | 29.3 | 46.8 | 25.75 | 2.19 |
| N12 | 26.5 | 44.5 | 26.25 | 2.08 |
| N13 | 26.6 | 44.5 | 24.5 | 1.81 |
| N14 | 26.4 | 43.3 | 25.25 | 1.86 |
| N15 | 28.8 | 47.1 | 30.25 | 2.32 |
| Mean | 30.3 | 42.7 | 30.48 | 2.64 |
Table text extracted from the original PDF; superscript letters are shown inline. The original table image is below.
View original table image
| Sample Name | PD (mwatt/m2) at Morning | PD (mwatt/m2) at Evening |
|---|---|---|
| N1 | 0.070 | 0.102 |
| N2 | 0.118 | 0.117 |
| N3 | 0.132 | 0.118 |
| N4 | 0.114 | 0.104 |
| N5 | 0.131 | 0.064 |
| N6 | 0.111 | 0.125 |
| N7 | 0.125 | 0.066 |
| N8 | 0.129 | 0.085 |
| N9 | 0.105 | 0.107 |
| N10 | 0.130 | 0.076 |
| N11 | 0.144 | 0.056 |
| N12 | 0.122 | 0.054 |
| N13 | 0.129 | 0.044 |
| N14 | 0.125 | 0.047 |
| N15 | 0.123 | 0.070 |
Table text extracted from the original PDF; superscript letters are shown inline. The original table image is below.
View original table image
| Sample name | SAR (EEG) watt/Kg at 0.3300 | SAR (EEG) watt/Kg at 0.0042 |
|---|---|---|
| N1 | 0.2532 | 0.0032 |
| N2 | 0.3943 | 0.0050 |
| N3 | 0.4642 | 0.0059 |
| N4 | 0.3832 | 0.0049 |
| N5 | 0.4170 | 0.0053 |
| N6 | 0.3614 | 0.0046 |
| N7 | 0.4344 | 0.0055 |
| N8 | 0.4582 | 0.0058 |
| N9 | 0.3777 | 0.0048 |
| N10 | 0.4462 | 0.0057 |
| N11 | 0.4826 | 0.0061 |
| N12 | 0.3000 | 0.0038 |
| N13 | 0.4582 | 0.0058 |
| N14 | 0.4170 | 0.0053 |
| N15 | 0.4582 | 0.0058 |
Table text extracted from the original PDF; superscript letters are shown inline. The original table image is below.
View original table image
| Sample name | SAR (EEG) watt/Kg at 0.3300 | SAR (EEG) watt/Kg at 0.0042 |
|---|---|---|
| N1 | 0.3887 | 0.0049 |
| N2 | 0.3999 | 0.0051 |
| N3 | 0.3887 | 0.0049 |
| N4 | 0.3777 | 0.0048 |
| N5 | 0.2356 | 0.0030 |
| N6 | 0.4642 | 0.0059 |
| N7 | 0.2228 | 0.0028 |
| N8 | 0.3199 | 0.0041 |
| N9 | 0.3300 | 0.0042 |
| N10 | 0.2715 | 0.0035 |
| N11 | 0.2104 | 0.0027 |
| N12 | 0.2186 | 0.0028 |
| N13 | 0.1905 | 0.0024 |
| N14 | 0.2023 | 0.0026 |
| N15 | 0.2904 | 0.0037 |
Table text extracted from the original PDF; superscript letters are shown inline. The original table image is below.
View original table image
References
11 in the original paper- Admawi HK. Assessment of Electromagnetic Pollution in Some Hospitals and Schools in Al-Najaf City. Environmental Engineering and Chemical, Petroleum. 2021;27(3):1-14.
- Dhami AK. Study of Electromagnetic Radiation Pollution in an Indian City. Environ Monit Assess. 2011;184((11)):6507-6512.
- Abdulkareem HK. Evaluation of Noise Pollution Indicators in Najaf City. Kufa J Eng. 2018;9(4):258278.
- Leung S, Croft RJ, McKenzie RJ, Iskra S, Silber B, Cooper NR, et al. Effects of 2G and 3G Mobile Phones on Performance and Electrophysiology in Adolescents, Young Adults and Older Adults. Clin. Neurophysiol. 2011;122(11):2203-2216.
- Mann K, Röschke J. Sleep under Exposure to HighFrequency Electromagnetic Fields. Sleep Med Rev. 2004;8(2):95-107.
- Matthes R, Bernhardt JH, McKinlay AF, International Commission on Non-Ionizing Radiation Protection. Guidelines on Limiting Exposure to Non-Ionizing Radiation : A Reference Book Based on the Guidelines on Limiting Exposure to Non-Ionizing Radiation and Statements on Special Applications. Health Phys. 1998;74(4):375.
- Mohammed HS, Fahmy HM, Radwan NM, Elsayed AA. Non-Thermal Continuous and Modulated Electromagnetic Radiation Fields Effects on Sleep EEG of Rats. J Adv. Res. 2013;4(2):181-87.
- Jangid P, Rai U, Sharma RS, Singh R, To R. The Role of Non-Ionizing Electromagnetic Radiation on Female Fertility: A Review. Int. J Environ Health Res. 2022;33(3):1-13.
- Vijay S, Choudhary MPC. Study on Health Effects of Mobile Tower Radiation on Human Beings. Int. Res. J Eng. Technol. (IRJET). 2017;4(11):1548-1552.
- Tsai SR, Hamblin MR. Biological Effects and Medical Applications of Infrared Radiation. Physiol. Behav. 2017;176(10):139-148.
- Oberschleissheim. Guidelines for Limiting Exposure to Electromagnetic Fields (100 kHz to 300 GHz). Health Phys. 2020;118(5):483-524.