
Research article · 2024 · Full text
International Journal of Research in AgronomyGrowth, yield, quality and nutrient use efficiency of field bean as influence by planting geometry and nutrient levels
Volume 7(7) · Pages 105–114 · DOI: 10.33545/2618060x.2024.v7.i7b.989 ↗
Research areasAgronomic Practices and Intercropping SystemsAgricultural Science and Fertilization
Abstract
Author-writtenA field experiment was conducted to investigate performance of field bean with varying spacing and fertilizer levels at ZARS, UAS, GKVK, Bengaluru. The experiment consisted of two factors i.e., spacing and fertilizer each at four different levels. Among spacing levels, growth parameters such as plant height (85.61 cm) were recorded significantly higher in 45 cm × 15 cm spacing (S1) but number of branches (6.9), leaf area (906.5 cm2 plant-1) and dry matter production (31.1 g plant-1) were recorded significantly higher in 60 cm × 30 cm spacing (S4) at harvest. Similarly higher seed yield (848.7 kg ha-1) and harvest index (0.36) was recorded in 45 cm × 15 cm spacing (S1). Among different fertilizer levels higher plant height (85.38 cm), number of branches (6.8), leaf area (897.2 cm2 plant-1) and dry matter production (28.6 g plant-1) at harvest. Similarly higher seed yield (764.6 kg ha-1) and haulm yield (1760.34 kg ha-1) were recorded in 150% RDF application (F4). Among different fertilizer levels higher protein content (23.26%) was recorded in fertilizer application at 150% RDF and significantly higher partial factor productivity of nitrogen, phosphorus and potassium (35.06, 17.53 and 35.06 kg seed yield kg-1 nutrient applied, respectively) and Significantly higher internal utilization efficiency of nitrogen, phosphorus and potassium (16.42, 127.7 and 17.86 kg seed yield kg-1 nutrient uptake, respectively) were recorded in 75% RDF level of nutrient application.
Summary
Source-checkedPlain-language reading of the full paper, prepared with AI and checked against the text. Each point links to the authors' own words.
Why it matters
- Field bean (Dolichos lablab L.) is an ancient legume crop originating in India and is used globally for food, fodder, and soil management. View evidence ↗
- The crop is nutritionally significant, providing 20-25% protein along with essential vitamins and minerals. View evidence ↗
- Despite its adaptability and potential for food security, field bean remains an underutilized crop with low cultivation areas. View evidence ↗
The question
- The study aimed to investigate how different planting spacings and fertilizer levels affect the performance of field beans. View evidence ↗
What they did
- The research used a factorial design in a Randomized Complete Block Design (RCBD) at ZARS, UAS, GKVK, Bengaluru, testing four levels of spacing and four levels of fertilizer. View evidence ↗
- The Hebbel Avare-4 variety was used, and data were analyzed using ANOVA with a 5% probability level for significance. View evidence ↗
What they found
- Closer spacing (45 cm × 15 cm) resulted in significantly taller plants, reaching 85.61 cm at harvest. View evidence ↗
- Wider spacing (60 cm × 30 cm) significantly increased the number of branches (6.9), leaf area (906.5 cm²), and dry matter production (31.1 g) per plant at harvest. View evidence ↗
- The highest crude protein content (23.26%) was found in plants treated with 150% RDF. View evidence ↗
- The 75% RDF level showed the highest partial factor productivity for nitrogen (35.06), phosphorus (17.53), and potassium (35.06) kg seed yield per kg nutrient applied. View evidence ↗
- Internal utilization efficiency for nitrogen (16.42), phosphorus (127.7), and potassium (17.86) kg seed yield per kg nutrient uptake was highest at the 75% RDF level. View evidence ↗
What it means
- The authors conclude that optimizing both planting spacing and fertilizer application is key to enhancing the yield and quality of field beans for sustainable agriculture. View evidence ↗
Visual summary
3 visualsIllustrations explain the paper; charts are replotted from the paper's own table values.
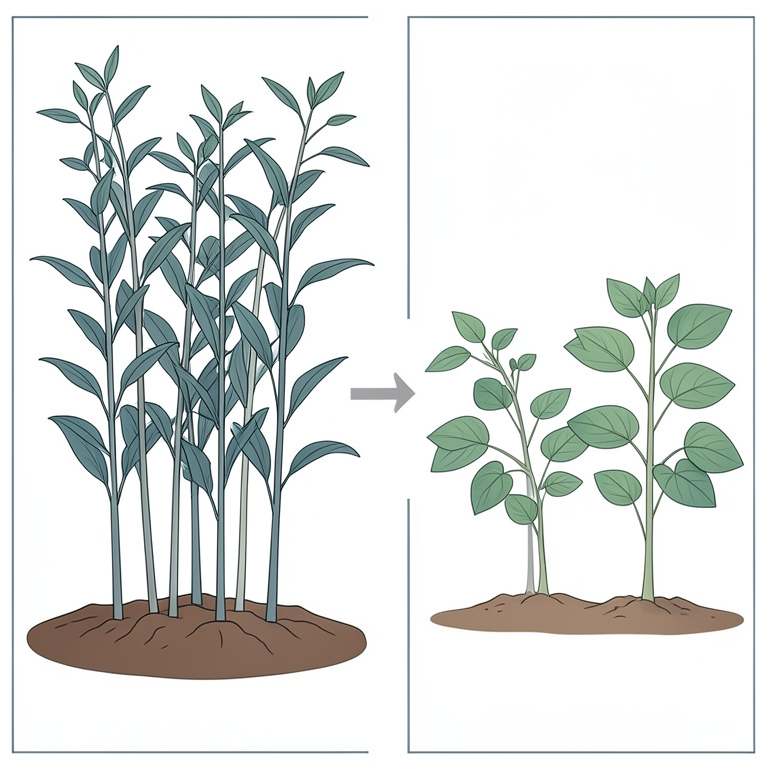
Spacing Trade-off
AI-generated conceptual illustration (field bean plants (Vicia faba)). It explains the idea and does not show study data.
View source evidence ↗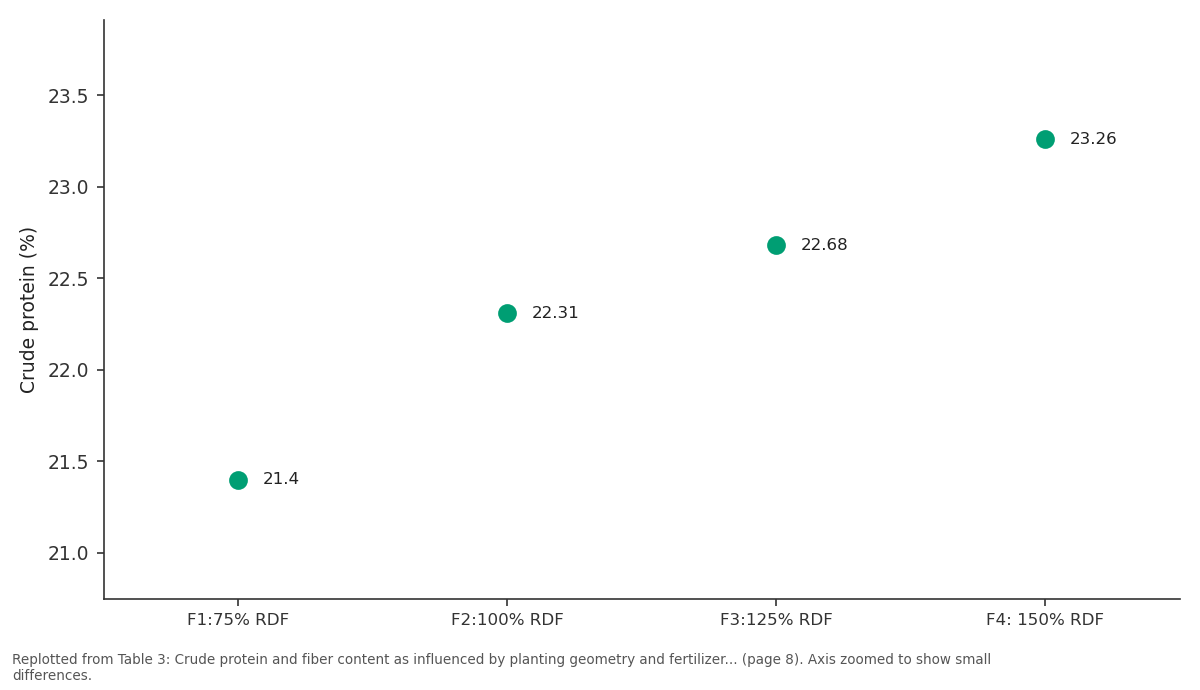
Crude protein (%): F1:75% RDF vs F2:100% RDF vs F3:125% RDF vs F4: 150% RDF
Replotted from Table 3 (page 8) of the original paper. Every bar is the paper's own table value.
View source evidence ↗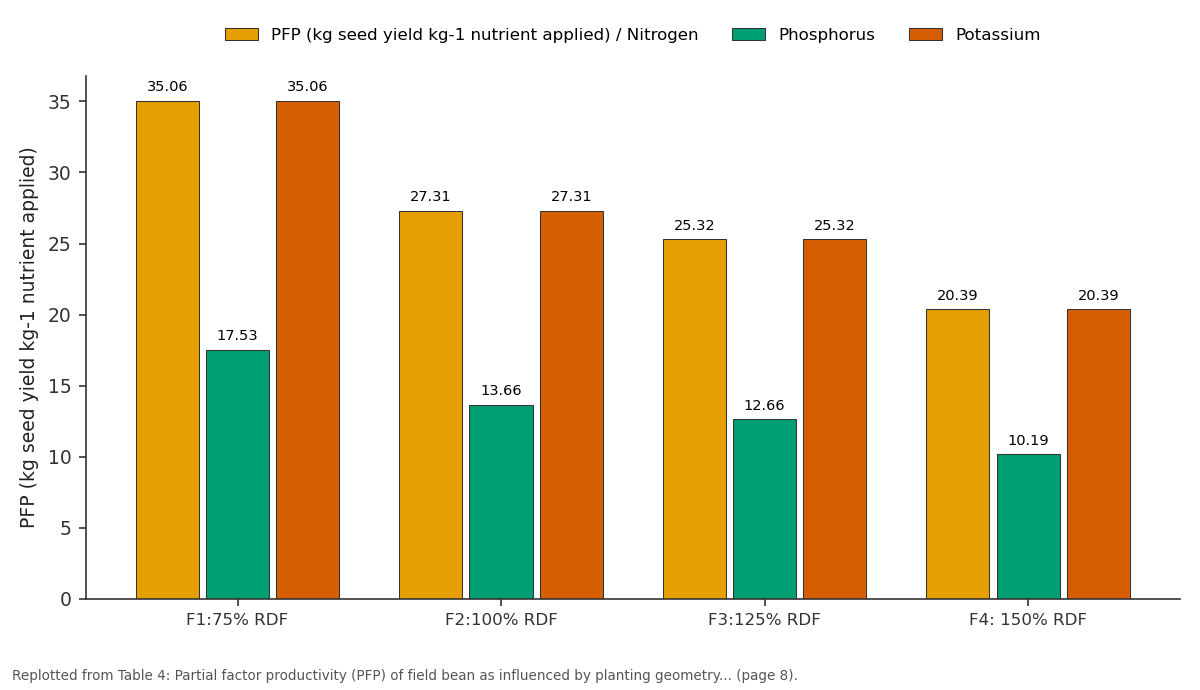
PFP (kg seed yield kg-1 nutrient applied) /... and Phosphorus and more: F1:75% RDF vs F2:100% RDF vs F3:125% RDF vs F4: 150% RDF
Replotted from Table 4 (page 8) of the original paper. Every bar is the paper's own table value.
View source evidence ↗Figures & tables
From the original paper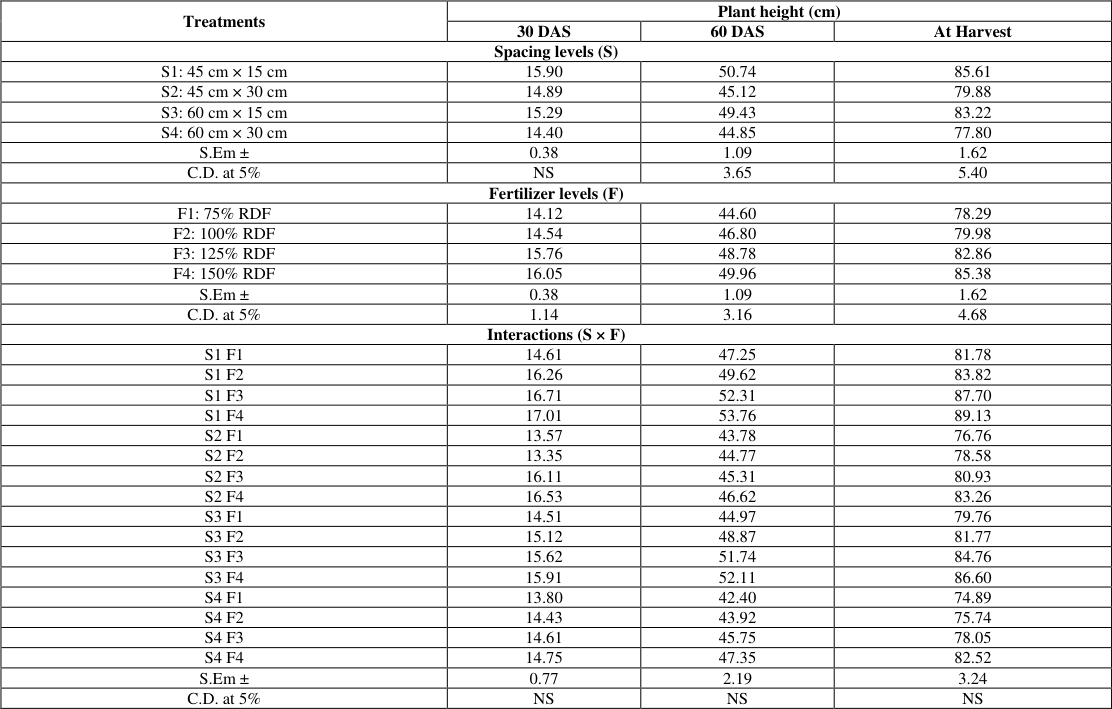 Table 1
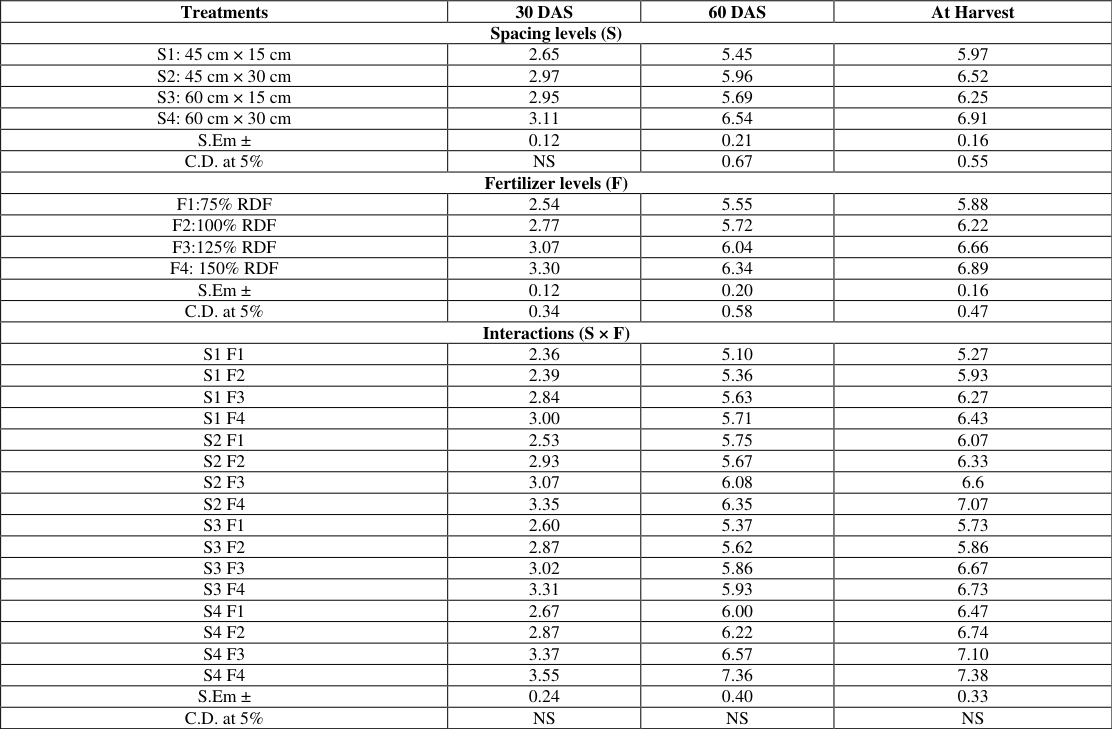 Table 2
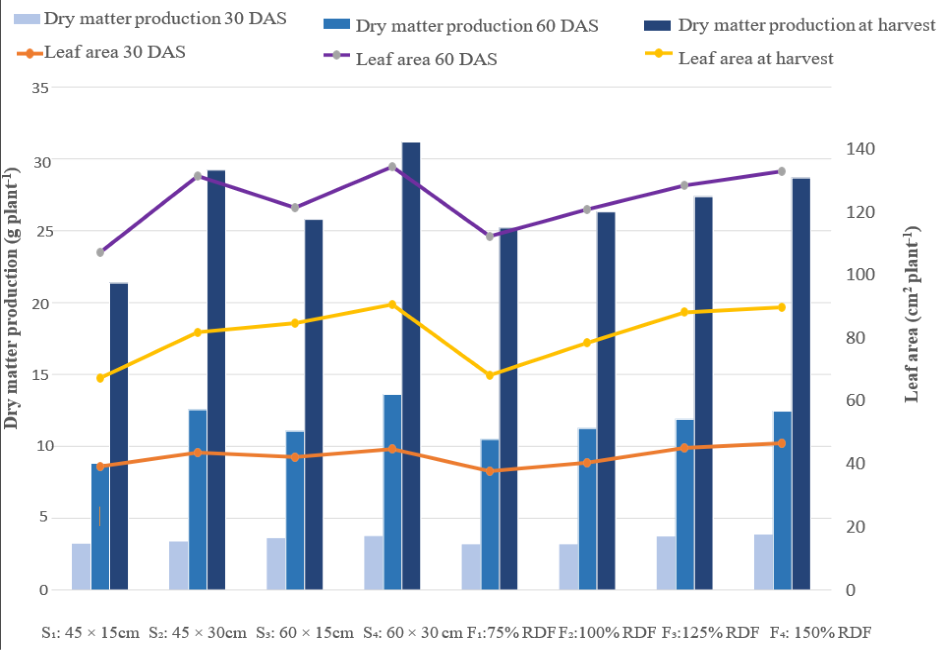 Figure 1
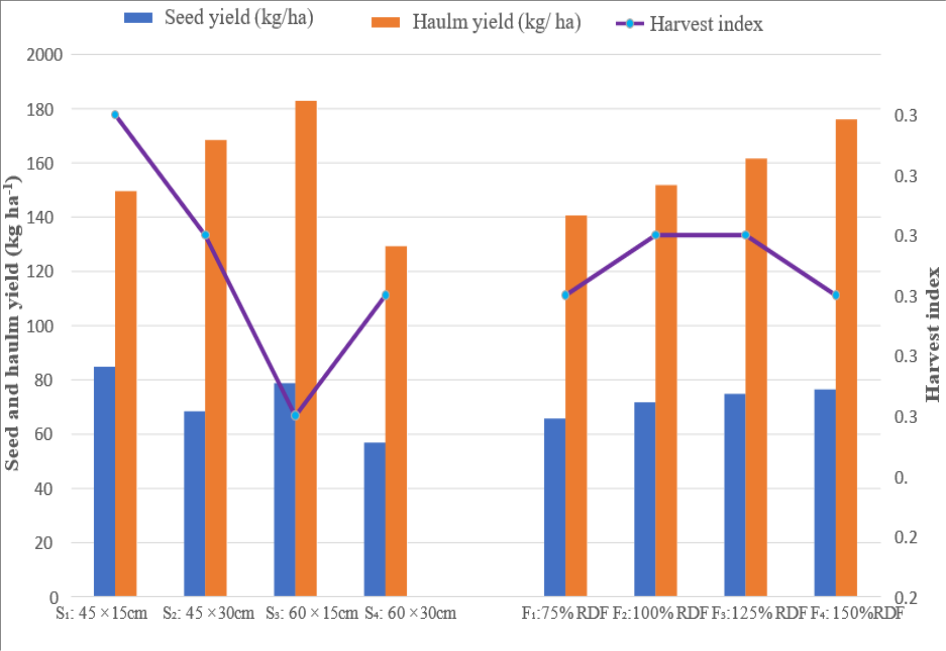 Figure 2
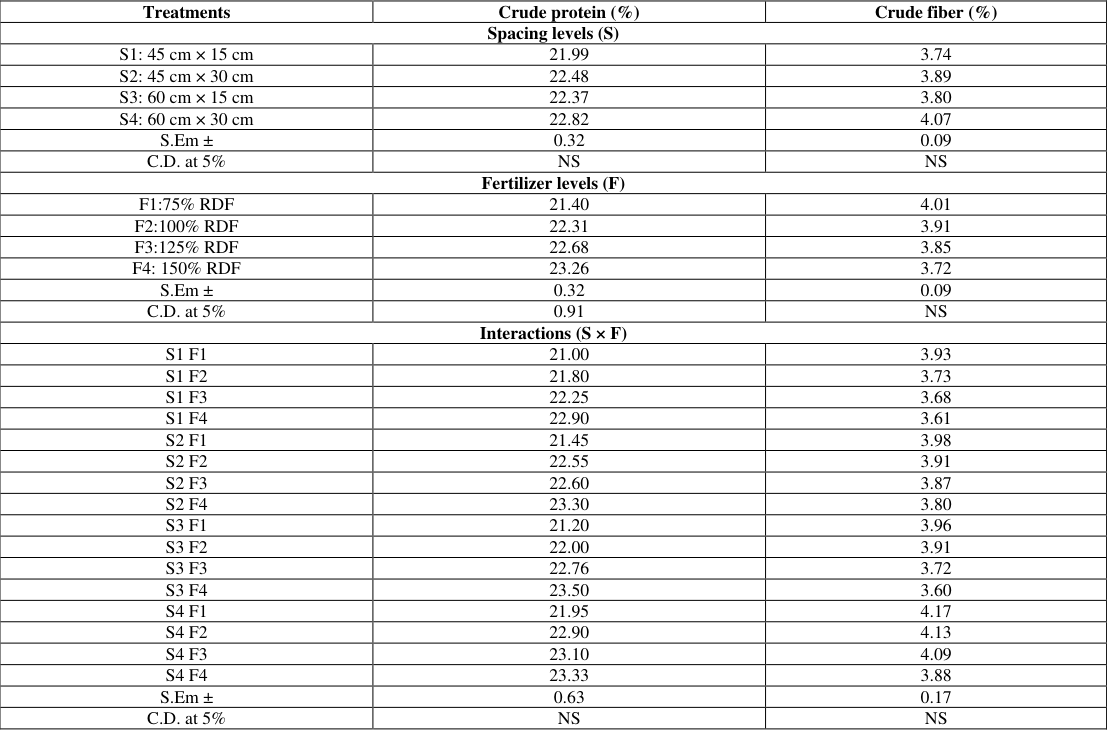 Table 3
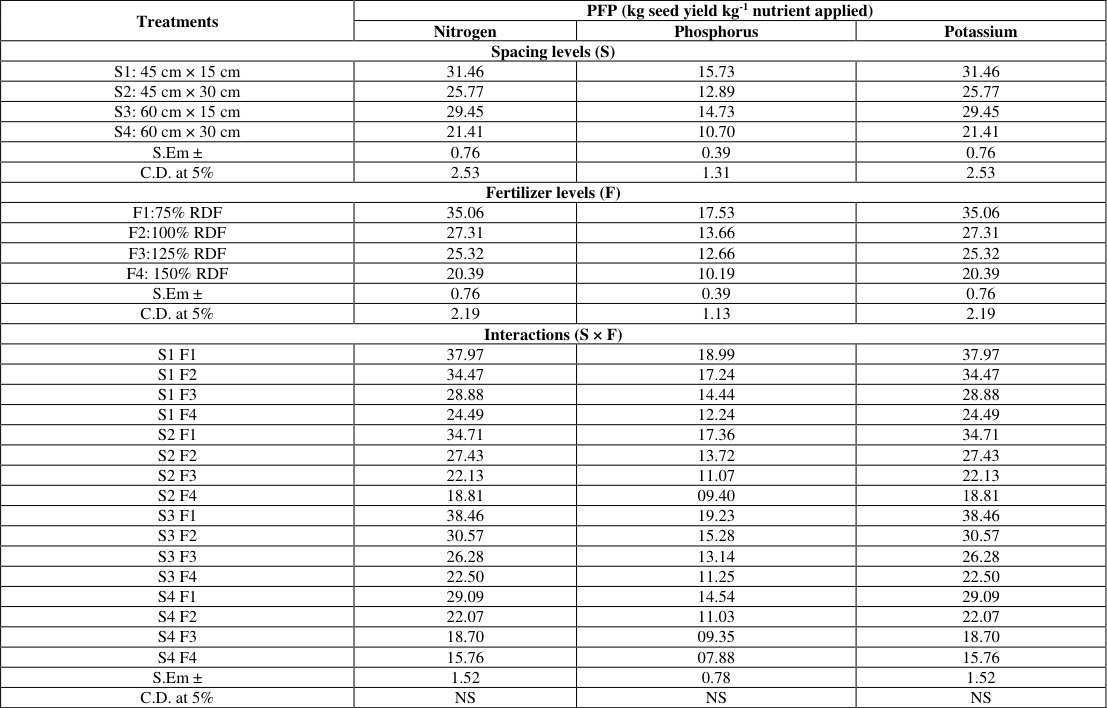 Table 4
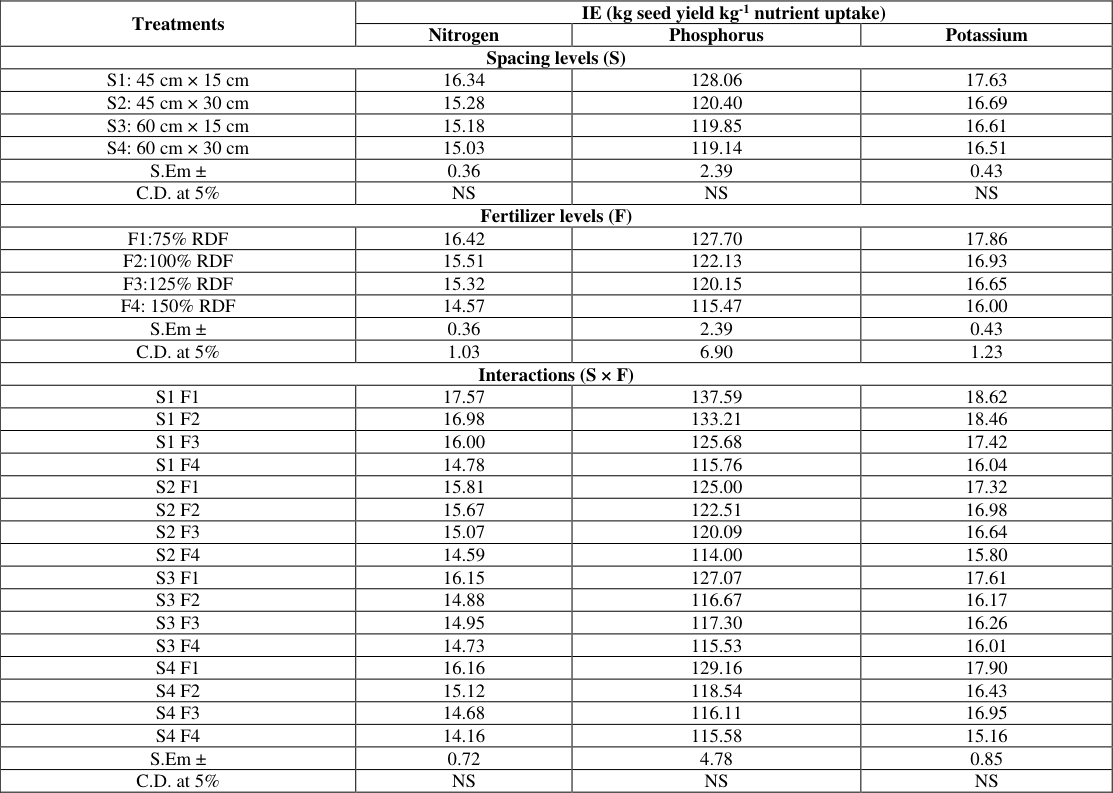 Table 5
Introduction
Field bean (Dolichos lablab L.) is bushy to spreading type and belongs to family Fabaceae with 2n=22. It is commonly known as Dolichos bean, Hyacinth bean, Indian bean, Egyptian bean, Sem, Avare etc., It is one of the most ancient crop among the cultivated legumes and is believed to be originated in India. Dolichos bean is cultivated widely across the world under diverse climatic conditions as high genetic diversity is noticed within crop. Around the world it is cultivated for various purposes such as for vegetable, pulse grain, fodder, as cover crop and also as green manure crop. In India, Dolichos bean, is primarily grown in Karnataka and bordering districts of Tamil Nadu, Andhra Pradesh, parts of Gujrat and Maharashtra as an intercrop and pure crop. In India, Karnataka has major area under field bean cultivation accounting about 80 per cent of total country's area. In Karnataka, field bean is grown in an area of 0.52 lakh ha and production of 0.28 lakh t of grain (raitamitra.karnataka.gov.in). It requires high temperatures to grow (18-30 °C). Field bean is a drought tolerant crop which has deep root system and can utilize available residual soil moisture. Field bean crop is sensitive to water logging, soils of deep sandy to clay soils with good drainage are suited for cultivation. Optimum range of pH is from 5 to 7.5. Field bean crop is nutritionally rich in terms of pod and seed characteristics. It is a very good source of protein (20-25%), amino acids, vitamins (A, C & Riboflavin) and minerals like Ca, P, K, Fe and Zn (Deka and Sarkar, 1990) [6] . Moreover, green pods and seeds are rich in dietary fiber, low carbohydrates and lipids. However, seeds to some extent also have antinutritional factors like other pulses. Field bean being a legume crop fixes nitrogen biologically, improves nutrient status of soil. It's bushy stature and deep root system enhances soil stability and reduces the adverse effects of soil erosion in dry land conditions. Being multi-purpose crop and grown under diverse conditions, its importance as pulse grain crop is often ignored. Despite with wide range of adaptability and diversity, it remains as an underutilized crop, as evidenced by low area under cultivation. However, it's potential as pulse, vegetable, forage, green manure and cover crops makes it suitable for tropical condition. However, it can contribute to food and nutritional security, increase income of rural poor, ecosystem stability and cultural diversity associated with local food habits (Ramesh and Byregowda, 2016) [23] . Pulse crops like field bean which can fix atmospheric nitrogen effectively also requires starter dose of nitrogen during initial stages. Moreover, in most pulse crops reduction in nitrogen fixation is noticed at pod formation and development stages. This may be due to competition between developing pods and root nodules for available photosynthates since N fixation is also an energy demanding process. Establishing compatible agronomic practices for achieving higher seed yield can contribute to increased crop productivity and food security. For effective utilization of environmental factors and management practices, optimum plant density per unit area has to be maintained. Maximum yield in a crop can be obtained by providing best optimum plant population along with balanced nutrient management under field conditions. Higher plant population per unit area causes competition within crop community for limiting factors such as moisture, nutrients, sunlight and other factors, while lower plant population results in underutilization of available inputs. Supply of balanced nutrients considering soil contribution is needed to meet the growth requirements and to exploit the full production potential of crops.
Materials and Methods
The experiment was conducted at Zonal Agricultural Research Station, Gandhi Krishi Vignana Kendra (GKVK), University of Agricultural Sciences, Bangalore (13̊ 07' North latitude, 77̊ 56' East longitude and 924 m above mean sea level altitude) under Eastern Dry Zone (ACZ-V) of Karnataka. The soil of experimental site is red sandy loam in texture with slightly acidic in pH (6.20), electric conductivity of 0.18 dS m -1 and organic content was 0.24 per cent. The soil is low in available nitrogen and medium in phosphorus and potassium availability. The experiment was laid in RCBD (factorial design) comprising of two factors spacing and fertilizers, each at four levels. All recommended package of practices followed during experimentation were as per UAS, Bangalore. The recommended spacing is 45 cm × 15 cm and dose of fertilizer (RDF) was 25:50:20 kg NPK ha -1 . Spacing levels comprised of S 1 -45 cm × 15 cm, S 2 -45 cm × 15 cm, S 3 -60 cm × 15 cm and S 4 -60 cm × 15 cm. Fertilizer levels comprised of F 1 -75% RDF, F 2 -100% RDF, F 3 -125% RDF and F 4 -150% RDF. The field was initially ploughed with disc plough followed by secondary tillage with rotavator at optimum condition and obtained weed free fine tilth. The experimental unit was differentiated as per layout into individual treatment plots of uniform shape and size by raising bunds. Individual plots were levelled thoroughly in all replications. Treatment combinations are randomly allocated to respective individual plots. FYM was applied as per recommendations four weeks before sowing. Fertilizers of different levels were applied to each treatment plot considering treatment combination allocated. Entire dose of these nutrients was applied as basal dose in the form of urea, DAP and MOP. Field bean seeds of Hebbel Avare-4 variety was used for sowing. Hebbal Avare-4 is a derivative of HA-3 and magadi local. It is a leading variety developed by University of Agricultural Sciences, Bangalore. Plants are photo insensitive, non-viny, compact with determinate growth habit. It matures in 95-100 days. Green pods can be harvested in 65-70 days for vegetable purpose. Pods are constricted and also have the characteristic odour (Sogadu). Weeding was done by passing bullock drawn harrow at 25 DAS. This was followed by manual hand weeding at 45 DAS to keep the experimental plots free from weeds. The data obtained was subjected to statistical analysis by analysis of variance (ANOVA) to test the significance of difference among the treatments by "F" test and a conclusion was drawn at 5 per cent probability level.
Results and Discussion
Results and Discussion
The plant height as influenced by different spacing and fertilizer levels at different growth stages of crop are presented in Table 1. Plant height was variedly influenced by different spacings at 30, 60 DAS and at harvest. At 30 DAS, plant height was found nonsignificant, however higher plant height recorded in 45 cm × 15 cm spacing (15.90 cm). At 60 DAS and at harvest stages, different spacing levels had significant influence on plant height. Significantly higher plant height (50.74 and 85.61 cm) was recorded in 45 cm × 15 cm spacing however, it was on par (49.43 and 83.22 cm, respectively) with spacing 60 cm × 15 cm. Whereas, lower plant height was recorded in 60 cm × 30 cm spacing at all the stages i.e., at 30, 60 DAS and at harvest (14.40, 44.85 and 77.80 cm, respectively). Higher plant height under closer spacing (S1) might be attributed due to more number of plant population per unit area would have influenced vertical growth of plant. This might be due to close encounter by plant in terms of spatial interaction with each other and lack of lateral space for optimum plant growth which has resulted in an increased plant height in order to intercept solar radiation for photosynthesis. Similar results were reported by Nimbargi (2005) [20] , Shrikanth (2008) [26] , Joshi and Rahevar (2015) [12] in field bean and Sabar (2021) [24] in rice bean. Fertilizer application also had significant influence on plant height. Significantly higher plant height at 30, 60 DAS and at harvest (16.05, 49.96 and 85.38 cm, respectively) was observed in 150% RDF (F4) level, which was on par (15.76, 48.78 and 82.86 cm, respectively) with 125% RDF application. The lower plant height was recorded in the treatments which received 75% RDF at all the stages of plant growth (14.12, 44.60 and 78.29 cm, respectively). Significant increase in plant height with higher levels of fertilizer application (F4) might be due to increased availability and uptake of all major nutrients mainly during early stages of plant growth. Further, the major nutrients such as nitrogen, phosphorus and potassium play a major role in both morphological and metabolic processes in plant, upon higher availability of these nutrients results in pronounced meristematic growth of the plants and might have resulted in higher plant height. Similar results were noticed by Jaisankar and Manivannan (2018) [11] , Sharma (2004) [25] and Kharbamon et al. (2016) [13] in field bean. Plant height did not vary significantly with interaction of spacing and fertilizer at different levels.
| Treatments | Plant height (cm) | — | — |
|---|---|---|---|
| 30 DAS | 60 DAS | At Harvest | |
| Spacing levels (S) | |||
| S1: 45 cm × 15 cm | 15.90 | 50.74 | 85.61 |
| S2: 45 cm × 30 cm | 14.89 | 45.12 | 79.88 |
| S3: 60 cm × 15 cm | 15.29 | 49.43 | 83.22 |
| S4: 60 cm × 30 cm | 14.40 | 44.85 | 77.80 |
| S.Em ± | 0.38 | 1.09 | 1.62 |
| C.D. at 5% | NS | 3.65 | 5.40 |
| Fertilizer levels (F) | |||
| F1: 75% RDF | 14.12 | 44.60 | 78.29 |
| F2: 100% RDF | 14.54 | 46.80 | 79.98 |
| F3: 125% RDF | 15.76 | 48.78 | 82.86 |
| F4: 150% RDF | 16.05 | 49.96 | 85.38 |
| S.Em ± | 0.38 | 1.09 | 1.62 |
| C.D. at 5% | 1.14 | 3.16 | 4.68 |
| Interactions (S × F) | |||
| S1 F1 | 14.61 | 47.25 | 81.78 |
| S1 F2 | 16.26 | 49.62 | 83.82 |
| S1 F3 | 16.71 | 52.31 | 87.70 |
| S1 F4 | 17.01 | 53.76 | 89.13 |
| S2 F1 | 13.57 | 43.78 | 76.76 |
| S2 F2 | 13.35 | 44.77 | 78.58 |
| S2 F3 | 16.11 | 45.31 | 80.93 |
| S2 F4 | 16.53 | 46.62 | 83.26 |
| S3 F1 | 14.51 | 44.97 | 79.76 |
| S3 F2 | 15.12 | 48.87 | 81.77 |
| S3 F3 | 15.62 | 51.74 | 84.76 |
| S3 F4 | 15.91 | 52.11 | 86.60 |
| S4 F1 | 13.80 | 42.40 | 74.89 |
| S4 F2 | 14.43 | 43.92 | 75.74 |
| S4 F3 | 14.61 | 45.75 | 78.05 |
| S4 F4 | 14.75 | 47.35 | 82.52 |
| S.Em ± | 0.77 | 2.19 | 3.24 |
| C.D. at 5% | NS | NS | NS |
Table text extracted from the original PDF; superscript letters are shown inline. The original table image is below.
View original table image
Number of branches plant -1
Number of branches plant -1 as influenced by different spacing, fertilizer levels and their interaction are present in Table 2.
| Treatments | 30 DAS | 60 DAS | At Harvest |
|---|---|---|---|
| Spacing levels (S) | |||
| S1: 45 cm × 15 cm | 2.65 | 5.45 | 5.97 |
| S2: 45 cm × 30 cm | 2.97 | 5.96 | 6.52 |
| S3: 60 cm × 15 cm | 2.95 | 5.69 | 6.25 |
| S4: 60 cm × 30 cm | 3.11 | 6.54 | 6.91 |
| S.Em ± | 0.12 | 0.21 | 0.16 |
| C.D. at 5% | NS | 0.67 | 0.55 |
| Fertilizer levels (F) | |||
| F1:75% RDF | 2.54 | 5.55 | 5.88 |
| F2:100% RDF | 2.77 | 5.72 | 6.22 |
| F3:125% RDF | 3.07 | 6.04 | 6.66 |
| F4: 150% RDF | 3.30 | 6.34 | 6.89 |
| S.Em ± | 0.12 | 0.20 | 0.16 |
| C.D. at 5% | 0.34 | 0.58 | 0.47 |
| Interactions (S × F) | |||
| S1 F1 | 2.36 | 5.10 | 5.27 |
| S1 F2 | 2.39 | 5.36 | 5.93 |
| S1 F3 | 2.84 | 5.63 | 6.27 |
| S1 F4 | 3.00 | 5.71 | 6.43 |
| S2 F1 | 2.53 | 5.75 | 6.07 |
| S2 F2 | 2.93 | 5.67 | 6.33 |
| S2 F3 | 3.07 | 6.08 | 6.6 |
| S2 F4 | 3.35 | 6.35 | 7.07 |
| S3 F1 | 2.60 | 5.37 | 5.73 |
| S3 F2 | 2.87 | 5.62 | 5.86 |
| S3 F3 | 3.02 | 5.86 | 6.67 |
| S3 F4 | 3.31 | 5.93 | 6.73 |
| S4 F1 | 2.67 | 6.00 | 6.47 |
| S4 F2 | 2.87 | 6.22 | 6.74 |
| S4 F3 | 3.37 | 6.57 | 7.10 |
| S4 F4 | 3.55 | 7.36 | 7.38 |
| S.Em ± | 0.24 | 0.40 | 0.33 |
| C.D. at 5% | NS | NS | NS |
Table text extracted from the original PDF; superscript letters are shown inline. The original table image is below.
View original table image
Number of branches plant -1 varied due to varying spacing levels. At 30 DAS the number of branches plant -1 were found nonsignificance within different spacing levels. Significantly higher number of branches plant -1 (6.54 and 6.91) were noticed in 60 cm × 30 cm spacing at 60 DAS and at harvest stages, respectively which was on par (5.96 and 6.52) with spacing 45 cm × 30 cm as compared to other spacing levels. Whereas, lower number of branches plant -1 (5.45 and 5.97, respectively) were observed in 45 cm × 15 cm plant spacing at 60 DAS and at harvest stages. The number of branches plant -1 were significantly higher in wider spacing (S4 : 60 cm × 30 cm) at different stages of crop. This may be due to lower plant population (55,555 plants ha -1 ) at wider spacing which had resulted in higher number of branches plant -1 . Increase in number of branches at wider spacing might be due to availability of space for lateral growth and also less shading effect by adjacent rows of plant during the crop growth period. Similar results of number of branches were also reported by Sabar (2021) [24] in rice bean, Venugopala (2014) [30] in field bean, Malagi (2005) [17] in Cowpea and Pinak (2018) [22] in long bean. The marked variation among number of branches plant -1 was noticed among different levels of fertilizers. Significantly higher number of branches plant -1 (3.30, 6.34 and 6.89, respectively) were observed in 150% RDF fertilizer application level at 30, 60 DAS and at harvest stages. These observations were found on par (3.07, 6.04 and 6.66 cm, respectively) with 125% RDF fertilizer application level at 30, 60 DAS and at harvest stages, respectively. However significantly lower number of branches plant -1 were observed in 75% RDF application at all the three plant growth stages (2.54, 5.55 and 5.88, respectively). The marked raise in the number of branches is observed in plants with higher level of fertilizer application (F4). The higher doses of nutrients application might have helped in maintaining overall growth of the plant in terms of assimilation of nutrients to all parts of plants. Nitrogen and phosphorus which play major role in enhancing vegetative and root growth which ultimately promoted a greater number of branches plant -1 . The above results are also in conformity with Patel et al. (2018) [21] in green gram, Kishor (2020) [15] in chia and Kharbamon et al. (2016) [13] in field bean. Interaction effect of spacing and fertilizer levels were found to be non-significant with respect to number of branches plant -1 at 30, 60 DAS and at harvest stages.
Leaf area (cm 2 ) plant -1 as influenced by different levels of spacing, fertilizer and their combinations are presented in Fig 1 . Leaf area (cm 2 ) plant -1 was found to be significantly influenced by different spacings. At 30 DAS leaf area plant -1 was found to be non-significant under different spacing levels. Significantly higher leaf area plant -1 (1344.74 and 906.54 cm 2 , respectively) was recorded in plant spacing of 60 cm × 30 cm at 60 DAS and harvest stages as compared to other spacings and these readings were found to be on par (1314.69 and 847.07 cm 2 plant -1 ) with 45 cm × 30 cm spacing. However, lower leaf area plant -1 (1070.56 and 673.25 cm 2 , respectively) was recorded in 45 cm × 15 cm spacing at 60 DAS and harvest stages. Significant increase in leaf area plant -1 was noticed in 60 cm × 30 cm spacing at 60 DAS and at harvest stages. The increase in leaf area per plant might be due to promoted growth of individual plants when accommodated under low density per unit area. This would have resulted due to optimum availability of resources for each plant with respect to intercept able solar radiation and moisture status due to low competition from companion plants. These results are in conformity with Jagadale et al. (2017) [10] in cowpea and Murade et al. (2014) [18] in black gram. Significant influence of fertilizer levels was found on leaf area plant -1 at different stages of plant. Significantly higher leaf area (465.70, 1329.01 and 897.28 cm 2 plant -1 , respectively) was found in 150% RDF application and followed by 125% RDF level (450.84, 1284.19 and 881.52 cm 2 plant -1 , respectively) compared to other fertilizer levels at 30, 60 DAS and at harvest stages. However, significantly lower leaf area plant -1 (376.45, 1121.94 and 681.71 cm 2 , respectively) was recorded in 75% RDF level compared to other fertilizer levels. The data regarding leaf area per plant revealed that application of 150% RDF (F4) has resulted in significantly higher leaf area plant -1 . This might be due to increased availability of nitrogen and phosphorus nutrients which would have promoted metabolic activities of plant such as cell division, differentiation and in turn higher leaf area of plant. These results are in accordance with results from Shrikanth (2008) [26] , Joshi and Rahevar (2015) [12] in field bean and Vyas and Jamliya (2017) [31] in soybean. Interaction between spacing and fertilizer levels were found non-significant influence on leaf area of field bean at all the growth stages of plant.
The data with respect to dry matter production (g plant -1 ) as influenced by different spacing, fertilizer levels and their interaction are present Fig. 1. Dry matter production (g plant -1 ) was recorded non-significant under different spacings at 30 DAS. Whereas, dry matter production (g plant -1 ) was found statistically higher (13.61 and 31.14 g, respectively) in spacing 60 cm × 30 cm at 60 DAS and at harvest stages and these observations were found to be on par (12.54 and 29.19 g, respectively) with spacing 45 cm × 30 cm at 60 DAS and at harvest stages of plant growth. Whereas, lower value of dry matter production (3.21, 8.82 and 21.33 g plant -1 , respectively) was recorded at closer spacing (45 cm × 30 cm) at 30, 60 DAS and at harvest stages. Dry matter production varied significantly with different levels of spacing at 60 DAS and at harvest stages. Higher dry matter production per plant was recorded at wider spacing (60 cm × 30 cm) which may be attributed due to pronounced vegetative growth of plant in terms of branches and leaf area of field bean. Plants under wider spacing have experienced optimum availability of growth resources and lower competition within plant community, which might have enhanced dry matter production per plant. Similar results were reported by Joshi and Rahevar (2015) [12] and Sabar (2021) [24] in rice bean. Different fertilizer levels had significant influence on dry matter production in field bean at 30, 60 DAS and at harvest stages. Significantly higher dry matter production (g plant -1 ) (3.85, 12.44 and 28.65 g, respectively) was recorded in 150% RDF level at 30, 60 DAS and at harvest stages and was followed by 125% RDF application (3.72, 11.88 and 27.34 g plant -1 , respectively). Whereas, lower dry matter production (g plant -1 ) (3.18, 10.47 and 25.16 g, respectively) was recorded in 75% RDF application at 30, 60 DAS and at harvest stages. Different levels of RDF applications resulted in significantly higher dry matter production plant -1 in F4 (150% RDF). Optimum availability of nutrients to plants under higher levels of RDF application would have resulted in higher uptake and effective assimilation of nutrients into various parts of plant. This further might have enhanced the vegetative growth and photosynthetic efficiency of plant and might have resulted in higher dry matter production per plant under higher levels of RDF application. These results are in conformity with Jaisankar and Manivannan (2018) [11] and Desai et al., (2020) [7] in field bean, Jagadale et al., (2017) [10] in cowpea and Vyas and Kushwaha (2015) [32] in soybean. Non-significant effect by interaction between spacing and fertilizer levels was observed in dry matter production (g plant -1 ) at 30, 60 DAS and at harvest stages.
Yield of field bean as influenced by planting geometry and fertilizer levels 1. Seed yield (kg ha -1 ) Seed yield of field bean as influenced by different spacing and fertilizer levels is presented in Fig. 2. Different levels of spacing imposed in field bean crop found to have significant influence on seed yield. Among the different spacings followed, significantly higher seed yield (848.70 kg ha -1 ) was recorded in 45 cm × 15 cm spacing as compared to other spacing levels. The above yield is on par with (767.54 kg ha -1 ) 60 cm × 15 cm spacing. However, lower seed yield (568.16 kg ha -1 ) was recorded in 60 cm × 30 cm spacing. The increased seed yield (kg ha -1 ) in closer spacing S1 (45 cm × 15 cm) may be due to establishment of optimum balance between source and sink aspects of individual plants and overall performance per unit area of land. Simultaneously plant population at optimum spacing attained minimum competition among plants which would have resulted in higher seed yield effectively utilizing existing resources. In case of wider spacing S4 (60 cm × 30 cm), though superior yield parameters were reported, this greater phenomenon did not compensate the reduced plant population per unit area. Similar results were also reported by Chaudary (2020) [4] in French bean, Shrikanth et al. (2008) [26] , Joshi and Rahevar (2015) [12] and Venugopala (2014) [30] in field bean, Malagi (2005) [17] in cowpea and Walchand (2016) [33] in soybean. Different fertilizer levels had significance influence on seed yield of field bean. Among different levels of nutrients applied, application of 150% RDF has resulted in significantly higher seed yield (764.61 kg ha -1 ) compared to other levels, which was on par (748.53 kg ha -1 ) with 125% RDF level. Whereas, lower seed yield (657.34 kg ha -1 ) was obtained in 75% RDF level of application as compared with other levels. This can be attributed to better growth of plants in terms of number of leaves, branches and dry matter production per plant under higher doses of fertilizer application, which in turn improved the photosynthesis and photosynthates assimilation for development of sink. Further, this increase would have led to an improved overall growth and development of plants under F4 (150% RDF level), thereby resulting in higher seed yield per unit area. The above results were in line with findings of Kisanlal (2007) [14] , Siddappa (2015) [27] , Dalai et al. (2021) [5] in field bean, Vyas and Jamliya (2017) [31] in soybean, Devaraj (2020) [8] and Suresh et al. (2021) [28] in pigeon pea, Murade et al. (2014) [18] in black gram and Patel et al. (2018) [21] in green gram. The interaction effect between different spacing and fertilizer levels recorded non-significant influence on seed yield per ha.
Spacing and fertilizers at different levels had significant influence on haulm yield of field bean. Among different spacings followed, significantly higher haulm yield was recorded (1829.22 kg ha -1 ) in 60 cm × 15 cm spacing, which is also on par (1683.83 kg ha -1 ) with 45 cm × 30 cm spacing upon other spacings. Whereas, lower haulm yield was recorded (1291.83 kg ha -1 ) in spacing 60 cm × 30 cm compared to other spacings. This might be due to effective utilization of available growth resources such as interception of solar radiation, moisture and nutrient uptake. Further planting at 60 cm × 15 cm would have increased overall individual growth parameters and also having ample plant population resulted an increase in haulm yield per unit area of land. Whereas, in wider spacing (S4) though superior growth parameters were recorded, due to low plant population in a unit area resulted in lower haulm yield per area. The above results are in conformity with findings of Walchand (2016) [33] in soybean, Patel et al. (2018) [21] in green gram, Kishor (2020) [15] in chia and Kharbamon et al. (2016) [13] in field bean. Different fertilizers levels had significant influence on haulm yield of field bean. Application of 150% RDF level has recorded (1760.34 kg ha -1 ) significantly higher haulm yield, which was on par with (1616.08 kg ha -1 ) application of 125% RDF level. Whereas, lower haulm yield was (1405.81 kg ha -1 ) recorded in 75% RDF application level when compared to other levels of fertilizers application. The increased haulm yield under 150% RDF might be due to optimum availability of major nutrients which increased both vegetative and root growth of plant. Further, this could be due to enhanced vegetative growth as a complimentary effect due to adequate and balanced availability of necessary nutrients during the crop growth period. Similar findings were reported by Nagamani et al. (2020) [19] and Suresh et al. (2021) [28] in red gram, Murade et al. (2014) [18] in black gram and Bedsur (2005) [3] and Desai et al. (2020) [7] in field bean. Interaction between spacing and fertilizer levels recorded non-significant effect on haulm yield in field bean.
Harvest index
Spacing at different levels had significant influence on harvest index of field bean. Significantly higher harvest index (0.36) was recorded in spacing 45 cm × 15 cm and followed by (0.34) in spacing 45 cm × 30 cm compared to other spacing levels. Whereas, lower harvest index (0.31) was observed in spacing at 60 cm × 15 cm. Harvest index significantly varied with different spacings followed, may be due to varied response of plant growth, in terms of seed, straw yield and overall biomass production. Harvest index, which is proportion between seed yield and total biomass, both components were found considerably varied with different spacings. Higher harvest index, which denotes ideal balance between economical yield and total biomass produced was noticed in 45 cm × 15 cm spacing. Similar results were reported by Nagamani et al. (2020) [19] in pigeonpea and Shrikanth et al. (2008) [26] in field bean. Different levels of fertilizer application had non-significant influence upon harvest index in field bean. However, higher harvest index (0.34) was recorded in 125% RDF level of application of NPK fertilizers. Whereas lower harvest index (0.33) was recorded in 75% RDF level of application of NPK fertilizers. Among different treatment combinations between spacing and fertilizer levels, effect on harvest index was found to be non-significant.
Quality parameters of field bean as influenced by spacing and fertilizer levels 1. Crude protein
Statistical analysis of data pertaining to protein content in grains was summarized in Table 3. Effect of different spacing levels was found to have non-significant influence on protein content. Numerically higher protein content (22.82%) was recorded in spacing S4 (60 cm × 30 cm) whereas, lower protein content (21.99%) was recorded in 45 cm × 15 cm spacing as compared to further levels of spacing. Different levels of fertilizers recorded significant effect on protein content in grains of field bean. Significantly higher protein content (23.26%) was recorded in fertilizer application at 150% RDF which was on par (22.68%) with 125% RDF application as compared to other levels. Whereas lower protein content (21.40%) was found with 75% RDF level. The progressive enzymatic activities at higher N and P status of plant would have enhanced protein metabolism. Since N being an essential component in photosynthesis mechanism and protein biosynthesis which might had resulted in more crude proteins in plants receiving more NPK fertilizer. Phosphorus which plays an important role in energy reactions, might have also enhanced protein content, since protein biosynthesis being high energy demanding process. The above results were also reported by Sabar (2021) [24] in rice bean and Siddappa (2015) [27] in field bean. Interaction between spacing and nutrient levels recorded non-significant influence with respect to protein content.
| Treatments | Crude protein (%) | Crude fiber (%) |
|---|---|---|
| Spacing levels (S) | ||
| S1: 45 cm × 15 cm | 21.99 | 3.74 |
| S2: 45 cm × 30 cm | 22.48 | 3.89 |
| S3: 60 cm × 15 cm | 22.37 | 3.80 |
| S4: 60 cm × 30 cm | 22.82 | 4.07 |
| S.Em ± | 0.32 | 0.09 |
| C.D. at 5% | NS | NS |
| Fertilizer levels (F) | ||
| F1:75% RDF | 21.40 | 4.01 |
| F2:100% RDF | 22.31 | 3.91 |
| F3:125% RDF | 22.68 | 3.85 |
| F4: 150% RDF | 23.26 | 3.72 |
| S.Em ± | 0.32 | 0.09 |
| C.D. at 5% | 0.91 | NS |
| Interactions (S × F) | ||
| S1 F1 | 21.00 | 3.93 |
| S1 F2 | 21.80 | 3.73 |
| S1 F3 | 22.25 | 3.68 |
| S1 F4 | 22.90 | 3.61 |
| S2 F1 | 21.45 | 3.98 |
| S2 F2 | 22.55 | 3.91 |
| S2 F3 | 22.60 | 3.87 |
| S2 F4 | 23.30 | 3.80 |
| S3 F1 | 21.20 | 3.96 |
| S3 F2 | 22.00 | 3.91 |
| S3 F3 | 22.76 | 3.72 |
| S3 F4 | 23.50 | 3.60 |
| S4 F1 | 21.95 | 4.17 |
| S4 F2 | 22.90 | 4.13 |
| S4 F3 | 23.10 | 4.09 |
| S4 F4 | 23.33 | 3.88 |
| S.Em ± | 0.63 | 0.17 |
| C.D. at 5% | NS | NS |
Table text extracted from the original PDF; superscript letters are shown inline. The original table image is below.
View original table image
Crude fiber
Crude fiber content was found non-significant with different levels of spacing and fertilizer application. However, higher fiber content (4.07%) was reported in plant spacing with S4 (60 cm × 30 cm) and it was lower (3.74%) with 45 cm × 15 cm spacing. Different levels of fertilizer application were recorded non-significant influence on fiber content of field bean. Among different levels of fertilizer application, higher fiber content (4.01%) was recorded with of 75% RDF level, and it was lower (3.72%) with 150% RDF level of application. Interaction between different levels of spacing and nutrient was found nonsignificant with respect to fiber content of field bean.
Nutrient use efficiency as influenced by spacing and fertilizer levels
Nutrient use efficiencies as influenced by different levels of spacing and fertilizers are presented in Table 4 and5. 1. Partial factor productivity (kg seed yield kg -1 nutrient applied) Partial factor productivity (kg seed yield kg -1 nutrient applied) as influenced by different factors was presented in Table 4. Different spacing levels had significant influence on partial factor productivity index. Significantly higher partial factor productivity for nitrogen, phosphorus and potassium was recorded (31.46, 15.73 and 31.47 kg seed yield kg -1 nutrient applied) with spacing level 45 cm × 15 cm compared to other levels, followed by (29.45, 14.73 and 29.45 kg seed yield kg -1 nutrient applied, respectively) 60 cm × 15 cm spacing and lower partial factor productivity for nitrogen, phosphorus and potassium was recorded (21.41, 10.70 and 21.41 kg seed yield kg -1 nutrient applied, respectively) in 60 cm × 30 cm spacing level. Different levels of nutrient application were found to have significant influence on partial factor productivity of field bean. Fertilizer application at 75% RDF level was found to have significantly higher partial factor productivity of nitrogen, phosphorus and potassium (35.06, 17.53 and 35.06 kg seed yield kg -1 nutrient applied, respectively) followed by (27.31, 13.66 and 27.31 kg seed yield kg -1 nutrient applied, respectively) 100% RDF level of application. Whereas, lower partial factor productivity (20.39, 10.19 and 20.39 kg seed yield kg -1 nutrient applied, respectively) was recorded in 150% RDF level. Partial factor productivity efficiency was observed to be higher in spacing with 45 cm × 15 cm as compared to other levels. This may be due to efficient utilization of applied nutrients under closer spacing compared with other levels. Also due to higher grain yield in S1 (45 cm × 15 cm) spacing with applied unit amount of nutrients, which was not reported in other spacing levels. The increase in partial factor productivity efficiency was also observed in lower levels of nutrients application (F1). Partial factor productivity which is division of yield per unit fertilizer applied, since F1 (75% RDF) resulted in higher seed yield per unit amount of fertilizer applied, this would have resulted in higher partial factor productivity. However, full production potential of crop was not attained in lower levels of fertilizer application (F1), which was evident in terms of seed yield compared to other levels of fertilizer applications. These results are in validation with Kumar et al. (2022) [16] in Lentil and Umoh and Osodeke (2016) [29] in green gram. Interaction between spacing and fertilizer application levels was found to have non-significant influence on partial factor productivity index.
| Treatments | PFP (kg seed yield kg-1 nutrient applied) | — | — |
|---|---|---|---|
| Nitrogen | Phosphorus | Potassium | |
| Spacing levels (S) | |||
| S1: 45 cm × 15 cm | 31.46 | 15.73 | 31.46 |
| S2: 45 cm × 30 cm | 25.77 | 12.89 | 25.77 |
| S3: 60 cm × 15 cm | 29.45 | 14.73 | 29.45 |
| S4: 60 cm × 30 cm | 21.41 | 10.70 | 21.41 |
| S.Em ± | 0.76 | 0.39 | 0.76 |
| C.D. at 5% | 2.53 | 1.31 | 2.53 |
| Fertilizer levels (F) | |||
| F1:75% RDF | 35.06 | 17.53 | 35.06 |
| F2:100% RDF | 27.31 | 13.66 | 27.31 |
| F3:125% RDF | 25.32 | 12.66 | 25.32 |
| F4: 150% RDF | 20.39 | 10.19 | 20.39 |
| S.Em ± | 0.76 | 0.39 | 0.76 |
| C.D. at 5% | 2.19 | 1.13 | 2.19 |
| Interactions (S × F) | |||
| S1 F1 | 37.97 | 18.99 | 37.97 |
| S1 F2 | 34.47 | 17.24 | 34.47 |
| S1 F3 | 28.88 | 14.44 | 28.88 |
| S1 F4 | 24.49 | 12.24 | 24.49 |
| S2 F1 | 34.71 | 17.36 | 34.71 |
| S2 F2 | 27.43 | 13.72 | 27.43 |
| S2 F3 | 22.13 | 11.07 | 22.13 |
| S2 F4 | 18.81 | 09.40 | 18.81 |
| S3 F1 | 38.46 | 19.23 | 38.46 |
| S3 F2 | 30.57 | 15.28 | 30.57 |
| S3 F3 | 26.28 | 13.14 | 26.28 |
| S3 F4 | 22.50 | 11.25 | 22.50 |
| S4 F1 | 29.09 | 14.54 | 29.09 |
| S4 F2 | 22.07 | 11.03 | 22.07 |
| S4 F3 | 18.70 | 09.35 | 18.70 |
| S4 F4 | 15.76 | 07.88 | 15.76 |
| S.Em ± | 1.52 | 0.78 | 1.52 |
| C.D. at 5% | NS | NS | NS |
Table text extracted from the original PDF; superscript letters are shown inline. The original table image is below.
View original table image
Internal utilization efficiency of field bean as influenced by different spacing and fertilizer levels was presented in Table 5. Different levels of spacing recorded non-significant influence on internal utilization efficiency (kg seed yield kg -1 nutrient uptake). In case of different levels of fertilizer application, internal utilization efficiency of field bean was found to be affected significantly. Significantly higher internal utilization efficiency (16.42, 127.7 and 17.86 kg seed yield kg -1 nutrient uptake) of nitrogen, phosphorus and potassium respectively were recorded in 75% RDF level of nutrient application, followed by (15.51, 122.13 and 16.93 kg seed yield kg -1 nutrient uptake, respectively) with application of 100% RDF level and lower internal utilization efficiency of nitrogen, phosphorus and potassium (14.57, 115.47 and 16.0 kg seed yield kg -1 nutrient uptake, respectively) was recorded with nutrients application at 150% RDF level. Internal utilization efficiency indicates the plant integral capacity to deliver yield per unit of nutrient present in its tissues (Dobermann 2007). It is the instantaneous capacity of plant to produce biomass with each unit of nutrient present in plant. Relatively higher internal utilization efficiency indicates a nutritional deficiency. Under lower levels of nutrients availability per unit biomass production has higher response to externally applied nutrients. However, this response may not be proportional to the rate of nutrients applied, which might reduce with each unit of applied nutrients. These results are in validation with findings of Win et al. (2010) [34] in soybean, Alene et al. (2020) [2] in green gram and Kumar et al. (2022) [16] in lentil. Interaction between spacing and fertilizer application levels was found to have non-significant influence on internal utilization efficiency index.
| Treatments | IE (kg seed yield kg-1 nutrient uptake) | — | — |
|---|---|---|---|
| Nitrogen | Phosphorus | Potassium | |
| Spacing levels (S) | |||
| S1: 45 cm × 15 cm | 16.34 | 128.06 | 17.63 |
| S2: 45 cm × 30 cm | 15.28 | 120.40 | 16.69 |
| S3: 60 cm × 15 cm | 15.18 | 119.85 | 16.61 |
| S4: 60 cm × 30 cm | 15.03 | 119.14 | 16.51 |
| S.Em ± | 0.36 | 2.39 | 0.43 |
| C.D. at 5% | NS | NS | NS |
| Fertilizer levels (F) | |||
| F1:75% RDF | 16.42 | 127.70 | 17.86 |
| F2:100% RDF | 15.51 | 122.13 | 16.93 |
| F3:125% RDF | 15.32 | 120.15 | 16.65 |
| F4: 150% RDF | 14.57 | 115.47 | 16.00 |
| S.Em ± | 0.36 | 2.39 | 0.43 |
| C.D. at 5% | 1.03 | 6.90 | 1.23 |
| Interactions (S × F) | |||
| S1 F1 | 17.57 | 137.59 | 18.62 |
| S1 F2 | 16.98 | 133.21 | 18.46 |
| S1 F3 | 16.00 | 125.68 | 17.42 |
| S1 F4 | 14.78 | 115.76 | 16.04 |
| S2 F1 | 15.81 | 125.00 | 17.32 |
| S2 F2 | 15.67 | 122.51 | 16.98 |
| S2 F3 | 15.07 | 120.09 | 16.64 |
| S2 F4 | 14.59 | 114.00 | 15.80 |
| S3 F1 | 16.15 | 127.07 | 17.61 |
| S3 F2 | 14.88 | 116.67 | 16.17 |
| S3 F3 | 14.95 | 117.30 | 16.26 |
| S3 F4 | 14.73 | 115.53 | 16.01 |
| S4 F1 | 16.16 | 129.16 | 17.90 |
| S4 F2 | 15.12 | 118.54 | 16.43 |
| S4 F3 | 14.68 | 116.11 | 16.95 |
| S4 F4 | 14.16 | 115.58 | 15.16 |
| S.Em ± | 0.72 | 4.78 | 0.85 |
| C.D. at 5% | NS | NS | NS |
Table text extracted from the original PDF; superscript letters are shown inline. The original table image is below.
View original table image
Conclusion
In conclusion, the study investigated the impact of spacing and fertilizer levels on the growth parameters, yield, and quality of field bean. The findings underscored significant effects of spacing on plant height, number of branches, leaf area, and dry matter production, with closer spacing generally promoting taller plants but wider spacing facilitating more branches and higher haulm yield. Fertilizer levels notably influenced these parameters as well as seed yield and protein content, with higher doses enhancing growth and yield metrics. Overall, optimizing spacing and fertilizer application can effectively enhance field bean production, providing crucial insights for sustainable agricultural practices aiming at improved crop yield and quality.
References
24 in the original paper- Narendra K, Prasad SR, Rakesh K, Hari OM. Effect of integrated nutrient management on the performance of sole and intercropped pigeonpea (Cajanus cajan) under rainfed conditions. Indian Journal of Agronomy. 2013;58(3):309315.
- Alene KA, Raffi MM, Tiruneh KJ. Phosphorus use efficiency, yield and nodulation of mung bean (Vigna radiata L.) as influenced by the rate of phosphorus and rhizobium strains inoculation in Metema district, Ethiopia. Journal of Plant Nutrition. 2020;44(9):130-133.
- M.Sc. (Agri.) Thesis, University of Agricultural Sciences, Dharwad, Karnataka, India. 2005.
- Dalai S, Evoor S, Mulge R, Hanchinamani CN. Effect of nutrient levels on growth, yield and economics of dolichos bean (Dolichos lablab L.) in Northern Dry Zone of Karnataka, India. Legume Research International Journal. 2021;1(3):573-579.
- Deka RK, Sarkar CR. Nutrient composition and antinutritional factors of Dolichos lablab L. seed. Food Chemistry. 1990;38(19):239-246.
- Desai NB, Leva RL, Khadadiya MB, Patel UJ. Integrated nutrient management in Rabi Indian bean (Dolichos lablab L.). Journal of Pharmacognosy and Phytochemistry. 2020;9(4):457-459.
- Devaraj A. Influence of spacing and nutrient levels on yield, physiological parameters and nutrient uptake in short duration varieties of red gram [Cajanus cajan (L.) Millsp.]. Journal of Pharmacognosy and Phytochemistry. 2020;9(5):1463-1467.
- Jagadale A, Lahane G, Bahure G, Mirza I, Ghungarde S. Influence of plant geometry and fertilizer levels on growth of cowpea (Vigna unguiculata L. Walp). Advances in Life Sciences. 2017;5(17):221-228.
- Jaisankar P, Manivannan K. Effect of different levels of nitrogen and phosphorus on growth and yield characters of bush bean (Dolichos lablab var. typicus). Plant Archives. 2018;18(2):294-298.
- Joshi SK, Rahevar H. Effect of dates of sowing, row spacings and varieties on growth and yield attributes of Rabi Indian bean (Dolichos lablab L.). Indian Journal of Agricultural Research. 2015;49(1):59-64.
- Kharbamon B, Jha AK, Verma VK, Choudhury BU, Amitnath, Deka BC. Response of planting time and phosphorus dosage on yield and nutrient uptake in dolichos bean (Lablab purpureus L.). Indian Journal of Hill Farming. 2016;30(1):29-34.
- Kumar S, Sharma SK, Thakral SK, Bhardwaj KK, Jhariya MK, Meena RS, Jangir CK, Bedwal S, Jat RD, Gaber A, Atta AA. Integrated nutrient management improves the productivity and nutrient use efficiency of Lens culinaris Medik. Sustainability. 2022;14(3):1284.
- Murade NB, Patil DB, Jagtap HD, More SM. Effect of spacing and fertilizer levels on growth and yield of urdbean. International Quarterly Journal of Life Sciences. 2014;9(4):1545-1547.
- Nagamani C, Sumathi V, Reddy GP. Yield and nutrient uptake of pigeonpea [Cajanus cajan (L.)] as influenced by sowing window, nutrient dose and foliar sprays. Agricultural Science Digest -A Research Journal. 2020;40(2):149-153.
- Nimbargi YA. Response of field bean (Dolichos lablab L.) genotypes to date of sowing and seed rate for fodder production and quality. M.Sc. (Agri.) Thesis, University of Agricultural Sciences, Dharwad, Karnataka, India. 2005.
- Patel TU, Patel AJ, Thanki JD, Arvadiya MK. Effect of land configuration and nutrient management on greengram (Vigna radiata). Indian Journal of Agronomy. 2018;63(4):472-475.
- Ramesh, Byregowda M. Dolichos bean (Lablab purpureus L. sweet, var. lignosus) genetics and breeding -present status and future prospects. Mysore Journal of Agricultural Sciences. 2016;50(3):481-500.
- Shrikanth S, Merwade MN, Channaveerswami AS, Tirakannanavar S, Mallapur CP, Hosamani RM. Effect of spacings and fertilizer levels on crop growth and seed yield in lablab bean (Lablab purpureus L.). Karnataka Journal of Agricultural Sciences. 2008;21(3):440-443.
- Suresh G, Nagavani AV, Sumathi V, Krishna TG, Sudhakar P, Sagar GK. Yield and nutrient uptake of pigeonpea (Cajanus cajan L.) as influenced by tillage, nutrient levels and foliar sprays. International Journal of Plant & Soil Science. 2021;33(21):92-106.
- Umoh FO, Osodeke VE. Estimation of phosphorus requirement of mung bean (Vigna radiata L.) Wilezek in the acid soils of South Eastern Nigerian using P-sorption isotherm. American-Eurasian Journal of Agricultural & Environmental Science. 2016;16(3):487-493.
- Venugopala NG, Prasanna KR, Channakeshava BC, Narayanaswamy S, Krishnamurthy N, Suresha HS. Influence of plant population and nutrition on seed yield and quality in field bean (Lablab purpureus L. Sweet.) cv. Hebbal Avare-3. Editorial Committee. 2014;48(4):534-540.
- Vyas MD, Jamliya GS. Effect of fertilizers with and without FYM on growth, yield attributes and yield of soybean [Glycine max (L) Merrill] varieties in medium black (vertisol) of Vindhyan Plateau of Madhya Pradesh, India. Plant Archives. 2017;17(2):1421-1424.
- Vyas MD, Kushwaha SS. Response of soybean [Glycine max (L.) Merrill] varieties to fertility levels in Vertisols of Vindhyan Plateau of Madhya Pradesh. Soybean Research. 2015;13(2):9-18.
- Win M, Nakasathien S, Sarobol E. Effects of phosphorus on seed oil and protein contents and phosphorus use efficiency in some soybean varieties. Agriculture and Natural Resources. 2010;44(1):1-9.
Cited by 1
From OpenAlex, OpenCitations and reference lists read by Scinovex
- Genetic variability and character association of common bean ( Phaseolus vulgaris L.) for yield and yield component traits at Wolaita, southern region of Ethiopia ↗
Adimasu Teferi Taddese, Daniel Hailegiorgis · Agrosystems Geosciences & Environment · 2026
Abstract Genetic variability plays a crucial role in plant breeding programs aimed at improving yield and yield‐related traits. The objective of this study was to assess the genetic variability and character association among common bean ( Phaseolus vulgaris L.) genotypes for yield and related agronomic traits. Thirty‐six genotypes were evaluated under field conditions at Wolaita, Southern Ethiopia, using a 6…
❝ 1PDF