
Research article · 2024 · Full text
International Journal of Geography Geology and EnvironmentRegional disparities in the socio-economic development of tribal communities in Nashik District: A geographical analysis
Volume 6(1) · Pages 473–477 · DOI: 10.22271/27067483.2024.v6.i1f.252 ↗
Research areasAgricultural Economics and PracticesLivestock Management and Performance ImprovementSouth Asian Studies and Conflicts
Abstract
Author-writtenThe present investigation studies the regional disparities in the socio-economic development of tribal communities in the Nashik district through a geographical analysis. It is based on primary data collected from 607 sample households across 48 sample villages of the 15 tehsils in the Nashik district. This study took into account a wide range of socio-economic development indicators, including the literacy rate, female literacy rate, sex ratio, percentage of the graduate population, percentage of pucca houses, percentage of house ownership, percentage of households with sufficient food, dependency ratio, percentage of households above the poverty line, percentage of working households, percentage of households with electricity, percentage of households with TV, percentage of households with sewerage facilities, and percentage of households with cooking gas. The Min-Max Normalization Index technique is applied to analyze the socio-economic development of tribal communities. The socio-economic development of tribal communities in the study region reflected the regional diversity under analysis. Niphad, Baglan, and Sinnar exhibited high levels of socio-economic development. The tahsils of Nandgaon, Nashik, Chandwad, Malegaon, Dindori, Deola, Kalwan, and Yeola recorded moderate socio-economic development. Triembak, Peint, Igatpuri, and Surgana Tahsil have recorded the lowest socio-economic development. Thus, the uneven socio-economic developments of tribal communities in the Nashik district affect physical features like topography and rainfall, as well as manmade features like population composition, education facilities, literacy level, infrastructural facilities, agriculture, and industrial developments. The present paper gives a geographical analysis of the socio-economic development of tribal communities in the Nashik district.
Summary
Source-checkedPlain-language reading of the full paper, prepared with AI and checked against the text. Each point links to the authors' own words.
Why it matters
- The socio-economic development of tribal communities in India is a critical issue because these groups have historically faced marginalization and economic vulnerability. View evidence ↗
- Prior research in Maharashtra indicates that poverty in most tribal villages limits access to essential services like health, education, and food. View evidence ↗
What they did
- The researchers collected primary data from 607 sample households across 48 villages within 15 tehsils of the Nashik district. View evidence ↗
- Villages were selected using stratified random sampling, focusing on those with over 50% tribal population based on 2011 census data, with 5% of tribal villages per tehsil chosen. View evidence ↗
- The Min-Max Normalization Index technique was used to calculate and analyze the socio-economic development levels. View evidence ↗
What they found
- Niphad (0.68), Baglan (0.64), and Sinnar (0.61) were identified as high-level development regions based on their Min-Max scores. View evidence ↗
- Eight tehsils, including Nandgaon (0.56) and Yeola (0.44), were categorized as having moderate socio-economic development. View evidence ↗
- Trimbakeshwar (0.39), Peint (0.38), Igatpuri (0.37), and Surgana (0.35) were found to be in the low development region. View evidence ↗
- High development in Niphad, Baglan, and Sinnar is attributed to plain topography, adequate rainfall, and strong agricultural and industrial growth. View evidence ↗
- Moderate development in certain tehsils is linked to poverty, population structure, uneven rainfall, and less developed industry and agriculture. View evidence ↗
What it means
- The authors conclude that socio-economic disparities in the district are influenced by both physical features (topography, rainfall) and man-made factors (education, infrastructure, industry). View evidence ↗
- The authors recommend urgently increasing literacy, infrastructure, and industrial/agricultural development in the less-developed regions to improve the quality of life for tribal people. View evidence ↗
Visual summary
2 visualsIllustrations explain the paper; charts are replotted from the paper's own table values.
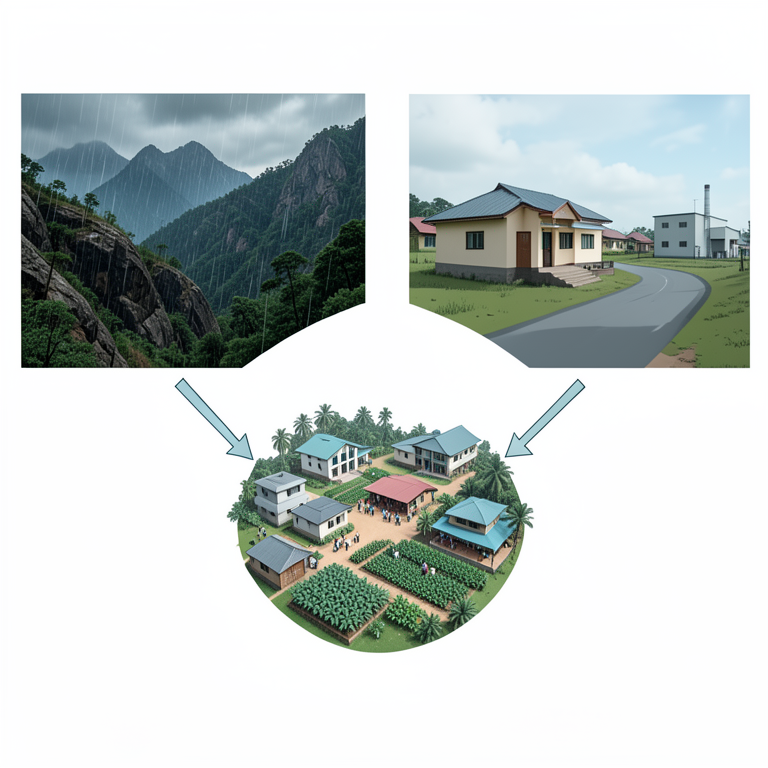
Drivers of Socio-Economic Disparity
AI-generated conceptual illustration (The landscape of Nashik District, India, featuring tribal settlements, hilly terrain, and rural infrastructure). It explains the idea and does not show study data.
View source evidence ↗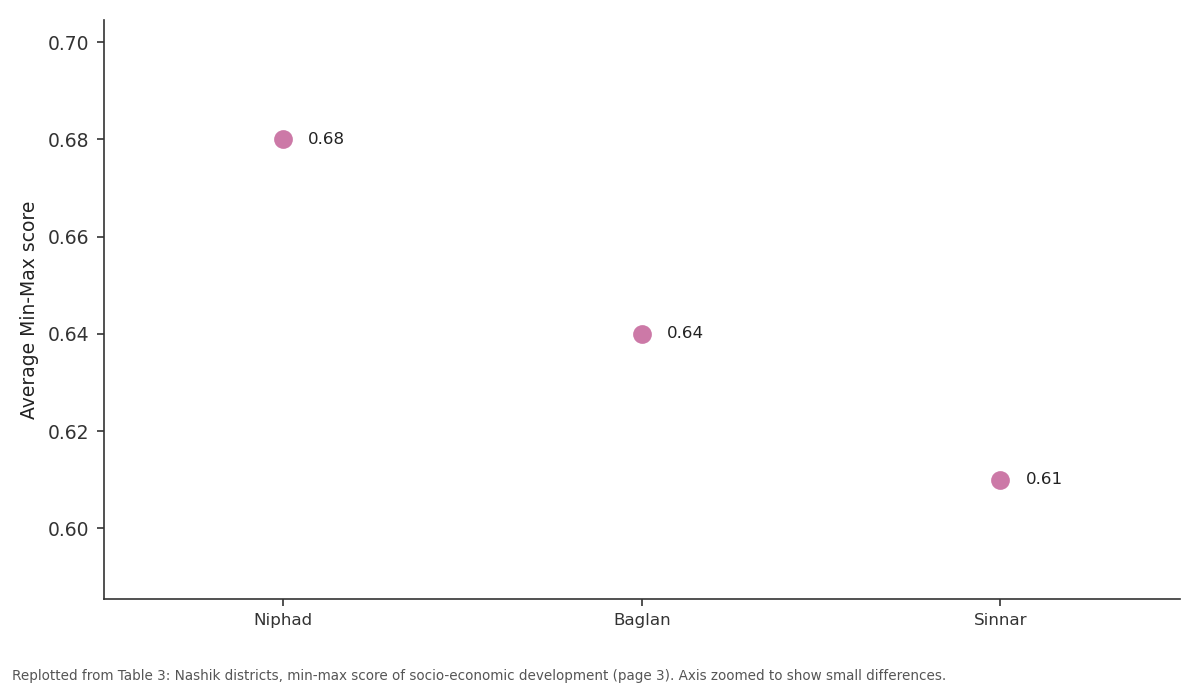
Average: Niphad vs Baglan vs Sinnar
Replotted from Table 3 (page 3) of the original paper. Every bar is the paper's own table value.
View source evidence ↗Figures & tables
From the original paper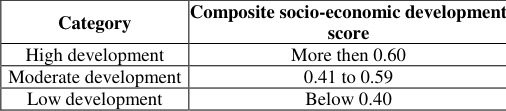 Table 1
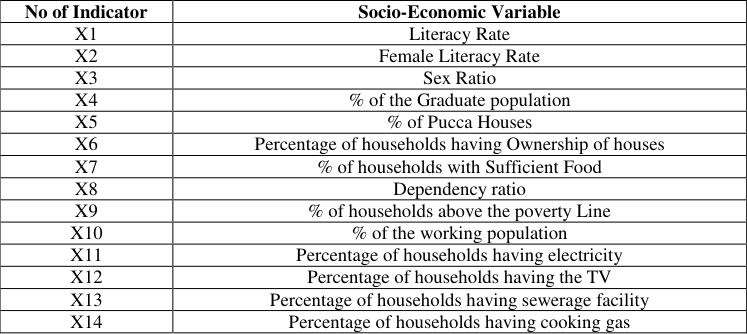 Table 1
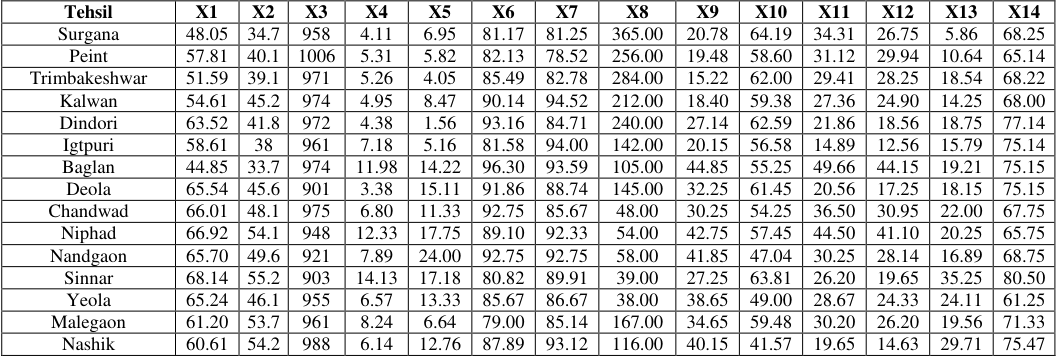 Table 2
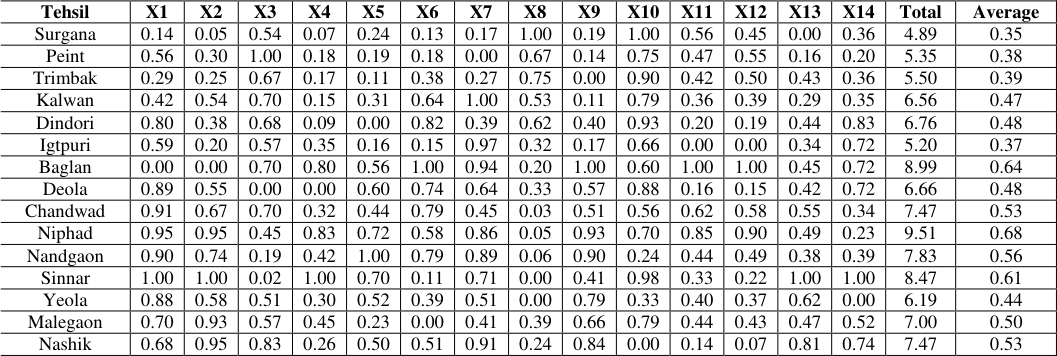 Table 3
Introduction
Numerous research papers and articles have been published about the level of economic development. Pawar SC, [1] has analyzed the socio-economic development of tribal populations in Maharashtra. The study revealed that poverty plagued nearly all tribal villages, except a small number, preventing them from accessing health, education, better employment opportunities, food, and other necessities. A. Jayakumar [2] studied the socioeconomic status of scheduled tribes in Kalrayan. He concluded that the socio-economic status of the tribal people in the Kalrayan Hills has only partially improved. Minati Sahoo [3] has studied the socio-economic development of tribals in Odisha: An inter-district analysis. He observed that a very high percentage of the tribal population still lives below the poverty line in Odisha, with a very high infant mortality rate and a low literacy rate, especially among women. N Chithra [4] stated that tribal groups, including particularly vulnerable tribal groups, exhibit varying levels of socio-economic and educational development, with some still at pre-agricultural technology levels and low literacy rates. Pradeep Panda [5] has stated that the socio-economic development of tribal communities in India is a crucial aspect that requires attention due to their historical marginalization and economic vulnerability. Tribal women, despite playing significant roles in economic activities, face obstacles such as lack of education, poor health status, and low wages, hindering their empowerment. Dr. Israr Ahmed and Jameel Ahmed [6] have written a research paper on the socio-economic and educational status of the tribal (Gujjar and Bakarwal) of Jammu and Kashmir.
Study area
The Nashik district is located within the upper Godavari basin and the partly Tapi river basin, spanning from 19°35' to 20°52' North latitudes and 73°16' to 75°56' East longitudes. It comprises a distinct geographical unit covering an area of 15,530 square kilometer. According to the 2011 census, the population of Nashik District was 6,107,187, with tribal people accounting for 1,564,369 (25.62%). The district, situated in the Khandesh and North Maharashtra regions, comprises 1,929 villages and 18 towns. Nashik District shares its borders with Jalgaon and Aurangabad Districts to the east, Dhule District to the north, Thane District to the south-west, Ahmadnagar District to the south, and Dang District to the North-West.
Location Map: Nashik District
Objectives 1. To find out the regional disparities in the socioeconomic development of tribal communities in Nashik district. 2. To find out the cause behind regional disparities in the socio-economic development of tribal communities in the Nashik district. 3. To suggest remedial suggestions for the balanced regional development of tribal communities in the Nashik district.
Materials and Methods
This study is based on primary data. The tribal tehsils were selected using a stratified random sampling method. A list of tribal villages was prepared based on villages with more than 50% tribal population selected for each tehsil of the district from the secondary data of the 2011 population census of Nashik district. For research, 5% of the tribal villages in each tehsil were selected. A list of tribal households for each sample village was obtained from the 2011 population census data. Out of the total tribal households in each respective sample village, an average of 10% of the sample households were selected for the interview. This research collected primary data from 607 sample households spread across 48 villages in the Nashik district's 15 tehsils. The collected data was processed and edited for analysis using various statistical methods presented in tables. Factors such as the literacy rate, female literacy rate, high sex ratio, graduate population, pucca houses, sufficient food availability, a high percentage of APL households, working population, electricity availability, and the percentage of TV-owning households contribute to the high level of development in tribal households in these tehsils
Moderate Level Development Region
The moderate level of development ranges between 0.41 and 0.59 min-max score. The sample tribal households in Nashik district categorise eight tehsils under the moderatelevel development region: Nandgaon (0.56), Nashik (0.53), Chandwad (0.53), Malegaon (0.50), Dindori (0.48), Deola (0.48), Kalwan (0.47), and Yeola (0.44). A detailed assessment of fourteen development indicators in Nandgaon Tehsil classifies six as high, three as moderate, Nashik Tehsil seven as high, two as moderate, Chandwad Tehsil five as high, seven as moderate, Malegaon Tehsil four as high, seven as moderate, Dindori Tehsil six as high, two as moderate, Deola Tehsil six as high, three as moderate, Kalwan Tehsil four as high, three as moderate, and Yeola Tehsil three as high, five as moderate, Tribal households in these tehsils exhibit a high and moderate literacy rate, female literacy rate, house ownership, adequate food availability, percentage of APL households, and working population. However, these tehsils do not observe sufficient levels of basic amenities such as electricity, television, cooking facilities, and sewerage services.
Low-Level Development Region
The low-development region ranges below 0.35 min-max scores. The sampled tribal households in Nashik district categorize four tehsils, Trimbakeshwar (0.39), Peint (0.38), Igatpuri (0.37), and Surgana (0.35), under the low development region. A detailed assessment of fourteen development indicators in Trimbakeshwar Tehsil classifies eight as the lowest level, Peint Tehsil classifies eight as the lowest level, Igatpuri Tehsil classifies eight as the lowest level; and Surgana Tehsil classifies eight as the lowest level. In these tehsils, only the dependency ratio, sex ratio, and working population demonstrate high levels. In contrast, other indicators, including the literacy rate, female literacy rate, graduate population, pucca houses, the percentage of house ownership, the percentage of households with sufficient food availability, the percentage of APL households, the availability of electricity, sewerage facilities, and the percentage of households with cooking gas availability, exhibit moderate and lowest levels.
Conclusion
The level of socio-economic development is not uniform for tribal households in the study region. It is low in highly tribal-concentration regions (Trimbakeshwar, Peint, Igatpuri, and Surgana). Uneven topography, high rainfall, low infrastructural facilities, less transport connectivity, traditional agriculture, and less industrial development contribute to these tehsils' low development. The moderately developed tehsils mostly concentrate on the north and eastern parts of the study region. The moderate development of these tehsils is influenced by factors such as uneven rainfall, less developed agriculture and industry, poverty, and population structure. These tehsils have also observed a significant lack of basic facilities such as electricity, television, cooking facilities, and sewerage systems at the household level have not observed at a sufficient level in these tehsils. Conversely, regions such as Niphad, Baglan, and Sinnar, known for their agriculture and industrial development, exhibit a high level of socioeconomic growth. Adequate rainfall, plain topography, infrastructural faculty, education, and transportation facilities play significant roles in the high development of these tehsils. Thus, the uneven socio-economic developments of tribal communities in the Nashik district affect physical features like topography and rainfall, as well as manmade features like population composition, education facilities, literacy level, infrastructural facilities, agriculture, and industrial growth.
Suggestions
There is an urgent need to increase literacy levels, agriculture and industrial development, and educational and infrastructural facilities to enhance the quality of life for tribal people where socio-economic development is less developed in the study region. Niphad, Baglan, and Sinnar tahsils have achieved good progress in the socioeconomic development of tribal communities, but the dependency ratio and sex ratio are still low compared to other tahsils of the study region. Therefore, this point needs to be considered in future planning, which requires special attention from planners when framing plans. In moderately developed regions, less developed infrastructural facilities like electricity, sewerage, and cooking gas are affected. In this region, it is required to develop infrastructural facilities for tribal households.
Figures and tables from the paper
| Category | Composite socio-economic development score |
|---|---|
| High development | More then 0.60 |
| Moderate development | 0.41 to 0.59 |
| Low development | Below 0.40 |
Table text extracted from the original PDF; superscript letters are shown inline. The original table image is below.
View original table image
| No of Indicator | Socio-Economic Variable |
|---|---|
| X1 | Literacy Rate |
| X2 | Female Literacy Rate |
| X3 | Sex Ratio |
| X4 | % of the Graduate population |
| X5 | % of Pucca Houses |
| X6 | Percentage of households having Ownership of houses |
| X7 | % of households with Sufficient Food |
| X8 | Dependency ratio |
| X9 | % of households above the poverty Line |
| X10 | % of the working population |
| X11 | Percentage of households having electricity |
| X12 | Percentage of households having the TV |
| X13 | Percentage of households having sewerage facility |
| X14 | Percentage of households having cooking gas |
Table text extracted from the original PDF; superscript letters are shown inline. The original table image is below.
View original table image
| Tehsil | X1 | X2 | X3 | X4 | X5 | X6 | X7 | X8 | X9 | X10 | X11 | X12 | X13 | X14 |
|---|---|---|---|---|---|---|---|---|---|---|---|---|---|---|
| Surgana | 48.05 | 34.7 | 958 | 4.11 | 6.95 | 81.17 | 81.25 | 365.00 | 20.78 | 64.19 | 34.31 | 26.75 | 5.86 | 68.25 |
| Peint | 57.81 | 40.1 | 1006 | 5.31 | 5.82 | 82.13 | 78.52 | 256.00 | 19.48 | 58.60 | 31.12 | 29.94 | 10.64 | 65.14 |
| Trimbakeshwar | 51.59 | 39.1 | 971 | 5.26 | 4.05 | 85.49 | 82.78 | 284.00 | 15.22 | 62.00 | 29.41 | 28.25 | 18.54 | 68.22 |
| Kalwan | 54.61 | 45.2 | 974 | 4.95 | 8.47 | 90.14 | 94.52 | 212.00 | 18.40 | 59.38 | 27.36 | 24.90 | 14.25 | 68.00 |
| Dindori | 63.52 | 41.8 | 972 | 4.38 | 1.56 | 93.16 | 84.71 | 240.00 | 27.14 | 62.59 | 21.86 | 18.56 | 18.75 | 77.14 |
| Igtpuri | 58.61 | 38 | 961 | 7.18 | 5.16 | 81.58 | 94.00 | 142.00 | 20.15 | 56.58 | 14.89 | 12.56 | 15.79 | 75.14 |
| Baglan | 44.85 | 33.7 | 974 | 11.98 | 14.22 | 96.30 | 93.59 | 105.00 | 44.85 | 55.25 | 49.66 | 44.15 | 19.21 | 75.15 |
| Deola | 65.54 | 45.6 | 901 | 3.38 | 15.11 | 91.86 | 88.74 | 145.00 | 32.25 | 61.45 | 20.56 | 17.25 | 18.15 | 75.15 |
| Chandwad | 66.01 | 48.1 | 975 | 6.80 | 11.33 | 92.75 | 85.67 | 48.00 | 30.25 | 54.25 | 36.50 | 30.95 | 22.00 | 67.75 |
| Niphad | 66.92 | 54.1 | 948 | 12.33 | 17.75 | 89.10 | 92.33 | 54.00 | 42.75 | 57.45 | 44.50 | 41.10 | 20.25 | 65.75 |
| Nandgaon | 65.70 | 49.6 | 921 | 7.89 | 24.00 | 92.75 | 92.75 | 58.00 | 41.85 | 47.04 | 30.25 | 28.14 | 16.89 | 68.75 |
| Sinnar | 68.14 | 55.2 | 903 | 14.13 | 17.18 | 80.82 | 89.91 | 39.00 | 27.25 | 63.81 | 26.20 | 19.65 | 35.25 | 80.50 |
| Yeola | 65.24 | 46.1 | 955 | 6.57 | 13.33 | 85.67 | 86.67 | 38.00 | 38.65 | 49.00 | 28.67 | 24.33 | 24.11 | 61.25 |
| Malegaon | 61.20 | 53.7 | 961 | 8.24 | 6.64 | 79.00 | 85.14 | 167.00 | 34.65 | 59.48 | 30.20 | 26.20 | 19.56 | 71.33 |
| Nashik | 60.61 | 54.2 | 988 | 6.14 | 12.76 | 87.89 | 93.12 | 116.00 | 40.15 | 41.57 | 19.65 | 14.63 | 29.71 | 75.47 |
Table text extracted from the original PDF; superscript letters are shown inline. The original table image is below.
View original table image
| Tehsil | X1 | X2 | X3 | X4 | X5 | X6 | X7 | X8 | X9 | X10 | X11 | X12 | X13 | X14 | Total | Average |
|---|---|---|---|---|---|---|---|---|---|---|---|---|---|---|---|---|
| Surgana | 0.14 | 0.05 | 0.54 | 0.07 | 0.24 | 0.13 | 0.17 | 1.00 | 0.19 | 1.00 | 0.56 | 0.45 | 0.00 | 0.36 | 4.89 | 0.35 |
| Peint | 0.56 | 0.30 | 1.00 | 0.18 | 0.19 | 0.18 | 0.00 | 0.67 | 0.14 | 0.75 | 0.47 | 0.55 | 0.16 | 0.20 | 5.35 | 0.38 |
| Trimbak | 0.29 | 0.25 | 0.67 | 0.17 | 0.11 | 0.38 | 0.27 | 0.75 | 0.00 | 0.90 | 0.42 | 0.50 | 0.43 | 0.36 | 5.50 | 0.39 |
| Kalwan | 0.42 | 0.54 | 0.70 | 0.15 | 0.31 | 0.64 | 1.00 | 0.53 | 0.11 | 0.79 | 0.36 | 0.39 | 0.29 | 0.35 | 6.56 | 0.47 |
| Dindori | 0.80 | 0.38 | 0.68 | 0.09 | 0.00 | 0.82 | 0.39 | 0.62 | 0.40 | 0.93 | 0.20 | 0.19 | 0.44 | 0.83 | 6.76 | 0.48 |
| Igtpuri | 0.59 | 0.20 | 0.57 | 0.35 | 0.16 | 0.15 | 0.97 | 0.32 | 0.17 | 0.66 | 0.00 | 0.00 | 0.34 | 0.72 | 5.20 | 0.37 |
| Baglan | 0.00 | 0.00 | 0.70 | 0.80 | 0.56 | 1.00 | 0.94 | 0.20 | 1.00 | 0.60 | 1.00 | 1.00 | 0.45 | 0.72 | 8.99 | 0.64 |
| Deola | 0.89 | 0.55 | 0.00 | 0.00 | 0.60 | 0.74 | 0.64 | 0.33 | 0.57 | 0.88 | 0.16 | 0.15 | 0.42 | 0.72 | 6.66 | 0.48 |
| Chandwad | 0.91 | 0.67 | 0.70 | 0.32 | 0.44 | 0.79 | 0.45 | 0.03 | 0.51 | 0.56 | 0.62 | 0.58 | 0.55 | 0.34 | 7.47 | 0.53 |
| Niphad | 0.95 | 0.95 | 0.45 | 0.83 | 0.72 | 0.58 | 0.86 | 0.05 | 0.93 | 0.70 | 0.85 | 0.90 | 0.49 | 0.23 | 9.51 | 0.68 |
| Nandgaon | 0.90 | 0.74 | 0.19 | 0.42 | 1.00 | 0.79 | 0.89 | 0.06 | 0.90 | 0.24 | 0.44 | 0.49 | 0.38 | 0.39 | 7.83 | 0.56 |
| Sinnar | 1.00 | 1.00 | 0.02 | 1.00 | 0.70 | 0.11 | 0.71 | 0.00 | 0.41 | 0.98 | 0.33 | 0.22 | 1.00 | 1.00 | 8.47 | 0.61 |
| Yeola | 0.88 | 0.58 | 0.51 | 0.30 | 0.52 | 0.39 | 0.51 | 0.00 | 0.79 | 0.33 | 0.40 | 0.37 | 0.62 | 0.00 | 6.19 | 0.44 |
| Malegaon | 0.70 | 0.93 | 0.57 | 0.45 | 0.23 | 0.00 | 0.41 | 0.39 | 0.66 | 0.79 | 0.44 | 0.43 | 0.47 | 0.52 | 7.00 | 0.50 |
| Nashik | 0.68 | 0.95 | 0.83 | 0.26 | 0.50 | 0.51 | 0.91 | 0.24 | 0.84 | 0.00 | 0.14 | 0.07 | 0.81 | 0.74 | 7.47 | 0.53 |
Table text extracted from the original PDF; superscript letters are shown inline. The original table image is below.
View original table image
References
9 in the original paper- Pagar SD, Suryawanshi DS. Spatial analysis of human resource development in the Nashik district, Maharashtra. Geo-Analyst. 2012;2(2):84-90. ISSN: 2249-2909.
- Jana NC, Ghoshal PK. Socio-economic conditions and quality of life in the tribal areas of Orissa with special reference to Mayurbhanj district. Int J Inf Res Rev. 2015;3(10):2951-2956.
- Chavan P. A study on socio-economic status of tribal people in Thane and Raigad districts, Maharashtra. Pragati: J Indian Econ. 2016;3(1):104-113.
- Lal BS, Devanna S. Socio-economic development of primitive tribes: An empirical study in Adilabad district. Int. J Inf. Res Rev. 2016;3(10):2951-2956.
- Sahoo DM. Socio-economic development of tribal in Odisha: An inter-district analysis. Desh Vikas. 2017;4(3):1-12.
- Puvvada VG. Tribal development in India, Status and strategies. Int J Afr Asian Stud. 2018;48(1):14-9.
- Ahmed I, Ahmed J. Socio-economic and educational status of tribal (Gujjar and Bakarwal) of Jammu and Kashmir: An overview. Int J Humanit Soc Stud. 2019;7(2):35-42.
- Chithra N. Tribal economy of India with special reference to Tiruchirappalli District of Tamil Nadu in India. Shanlax Int J. 2020;8(3):48-53.
- Kasare K. A study on socio-economic development of tribal people in Peth Taluka of Nashik district. Int J Res Cult Soc. 2020;4(1):117-20.