
Research article · 2024 · Full text
International Journal of Research in AgronomyGenetic divergence studies in okra (Abelmoschus esculentus (L.) Moench)
Volume 7(7S) · Pages 41–47 · DOI: 10.33545/2618060x.2024.v7.i7sa.982 ↗
Research areasAgricultural Practices and Plant GeneticsAgricultural pest management studiesAgricultural Science and Fertilization
Abstract
Author-writtenThe success of crop improvement programme is mainly based on genetic diversity available in the breeding material. Genetic diversity helps in selecting the suitable parents for hybridization. Genetic diversity is a key factor for crop improvement. Therefore, the present investigation was carried out to assess the genetic diversity present in 52 okra genotypes for yield and yield contributing traits. In the present study, 52 okra genotypes were grouped in six clusters on the basis of relative magnitude of D2 values. Cluster I contain maximum number of genotypes (24) followed by cluster II (17) and cluster III (8). The inter cluster distance was higher than the intra cluster distance indicating wide genetic diversity among the genotypes of different groups. The maximum genetic distance was observed between cluster II and VI followed by cluster I and VI, cluster IV and VI and cluster V and VI. The maximum intra cluster distance were expressed by cluster III followed by cluster I and cluster II. The genotypes which were in cluster I, III and VI exhibited significant performance for yield per plant, number of fruits per plant, fruit weight, fruit length, fruit girth, number of ridges per fruit, number of nodes per plant, plant height, number of branches per plant, internodal length, number of seeds per fruit and 100 seed weight. The relative contribution of studied characters indicated that yield per plant (54.00%) maximum contributed to total variation followed by number of ridges per fruit (15.69%), number of seeds per fruit (10.78%), 100 seed weight (4.52%) and days to 50 percent flowering (4.37%). Based on principal component analysis (PCA), these components explained 89.36% of total genetic variation. These characters are highly genetic variable and genotypes having these characters in different cluster could be used in breeding programme to develop high yielding cultivars in okra.
Summary
Source-checkedPlain-language reading of the full paper, prepared with AI and checked against the text. Each point links to the authors' own words.
Why it matters
- Okra, also known as Lady's finger or Bhindi, is a widely cultivated vegetable in tropical, sub-tropical, and warm temperate regions. View evidence ↗
- Okra is nutritionally significant, providing essential vitamins and minerals like calcium, and consists of 86.1% water, 9.7% carbohydrate, and 2.2% protein. View evidence ↗
- Because okra is often cross-pollinated, understanding genetic divergence is critical for selecting parents to develop superior hybrids through heterosis. View evidence ↗
The question
- The study aimed to evaluate the genetic diversity of 52 okra genotypes focusing on yield and traits that contribute to yield. View evidence ↗
What they did
- The researchers used 52 okra genotypes sourced from NBPGR New Delhi, which included two check varieties: Pusa Sawani and Parbhani Kranti. View evidence ↗
- The study was conducted during the kharif 2020 season at the VNMKV research farm in Parbhani using a randomized block design with two replications. View evidence ↗
- Fourteen characters were measured, including yield per plant, fruit weight, fruit length, fruit girth, and days to 50% flowering. View evidence ↗
What they found
- The 52 genotypes were divided into six clusters; Cluster I was the largest with 24 genotypes, followed by Cluster II (17) and Cluster III (8). View evidence ↗
- The greatest genetic distance between clusters occurred between Cluster II and VI (1079.84), indicating high divergence between these groups. View evidence ↗
- Cluster VI showed the highest mean yield per plant (295.81 g), while Cluster V showed the lowest (107.48 g). View evidence ↗
- Principal component analysis revealed that the studied components explained 89.36% of the total genetic variation among the genotypes. View evidence ↗
What it means
- The authors conclude that crossing genotypes from Clusters VI, I, and III is recommended to improve okra yield due to their high mean performance. View evidence ↗
- The authors suggest that using highly divergent parents in crosses will create the variability necessary to isolate superior segregants in future generations. View evidence ↗
Visual summary
2 visualsIllustrations explain the paper; charts are replotted from the paper's own table values.
Genotype Clustering Concept
AI-generated conceptual illustration (okra plants (Abelmoschus esculentus)). It explains the idea and does not show study data.
View source evidence ↗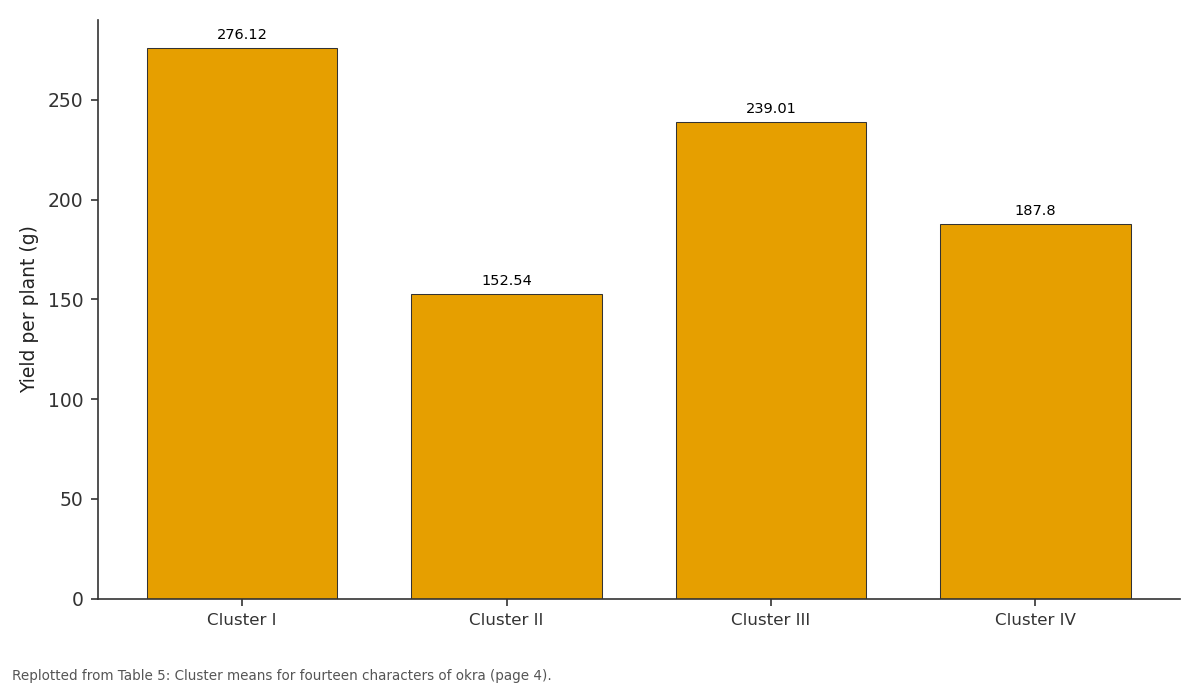
Yield per plant (g): Cluster I vs Cluster II vs Cluster III vs Cluster IV
Replotted from Table 5 (page 4) of the original paper. Every bar is the paper's own table value.
View source evidence ↗Figures & tables
From the original paper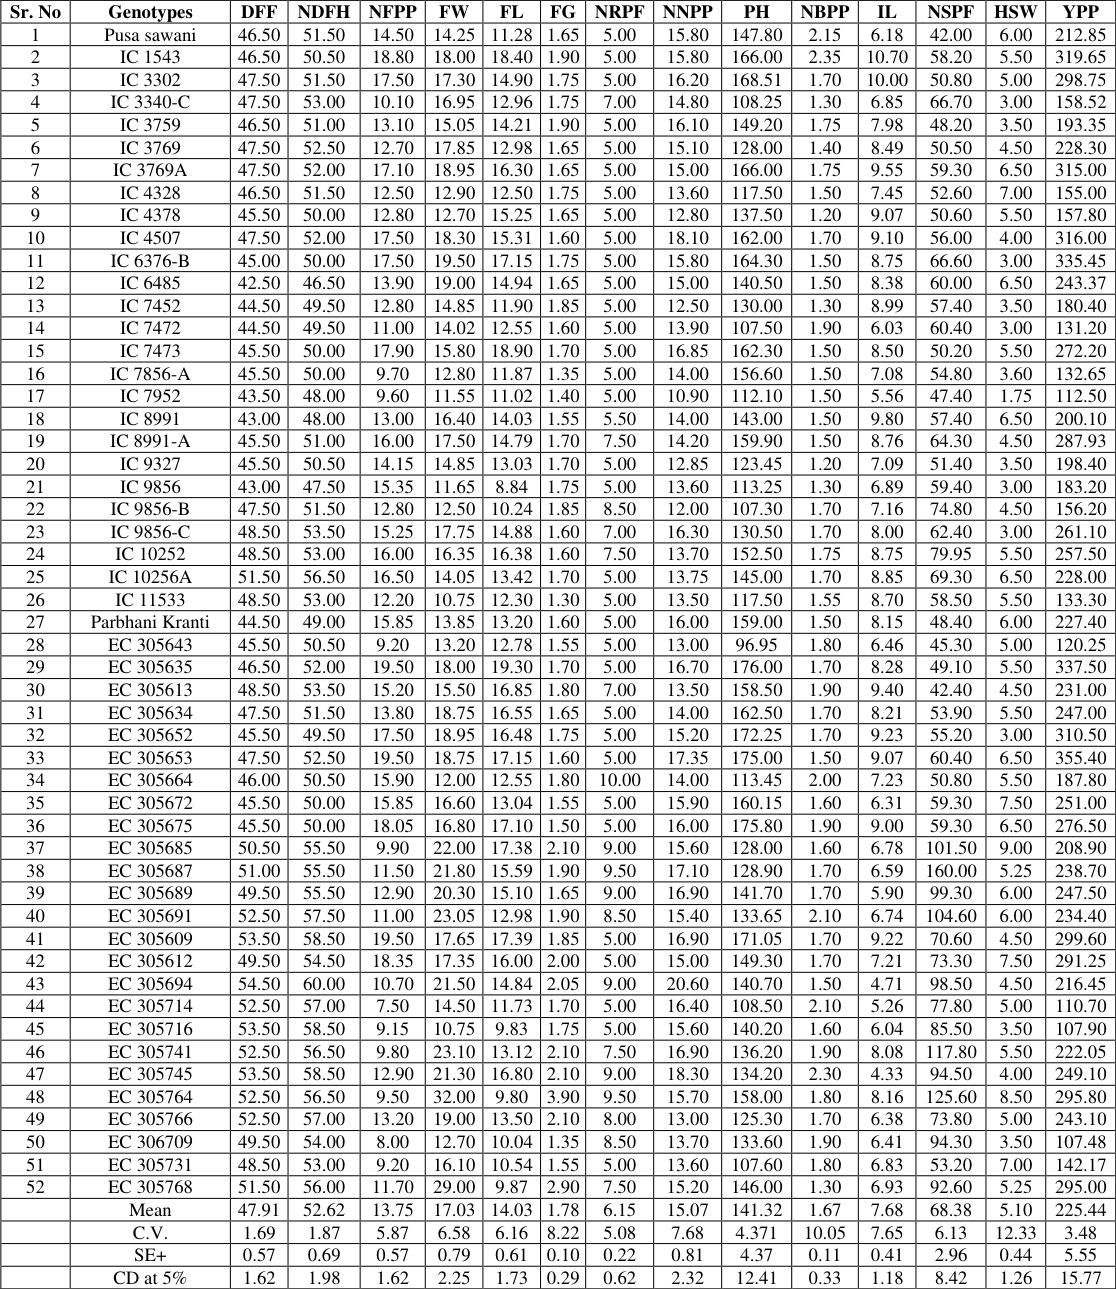 Table 1
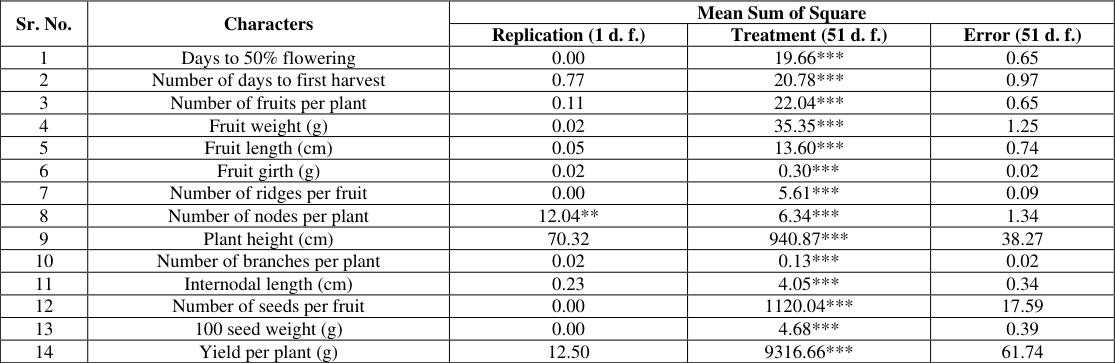 Table 2
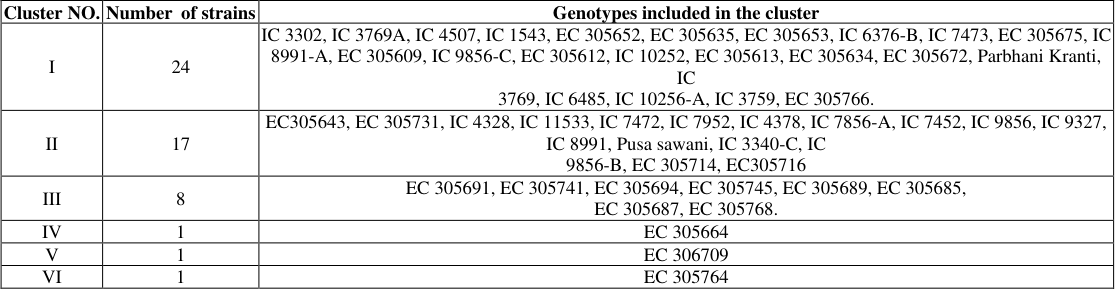 Table 3
 Table 4
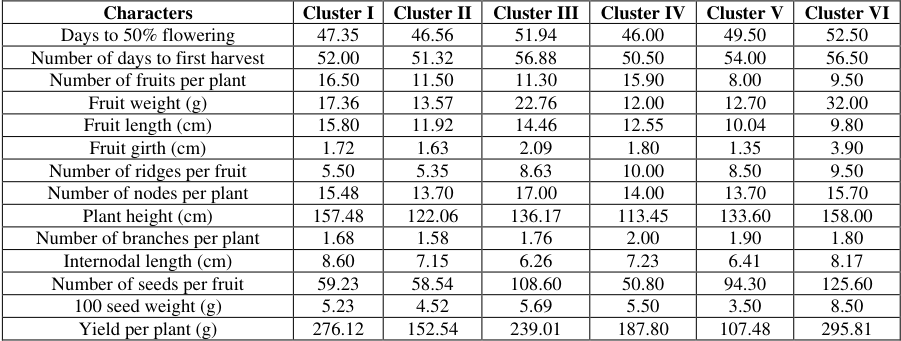 Table 5
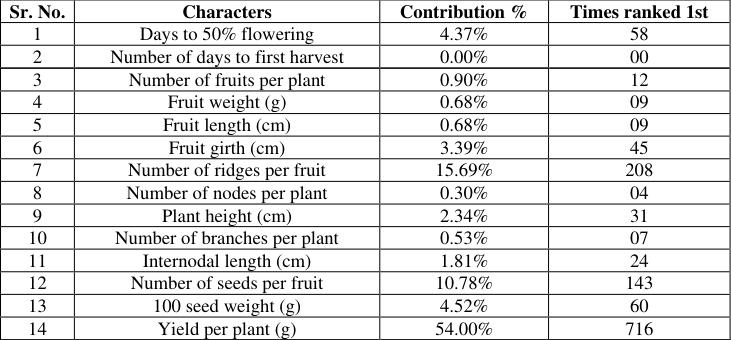 Table 6
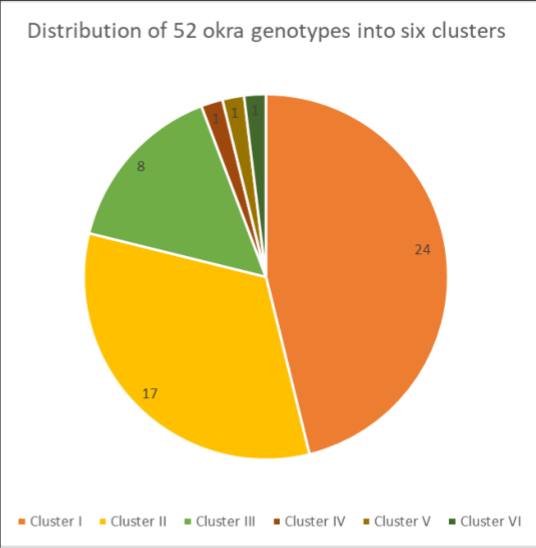 Figure 1
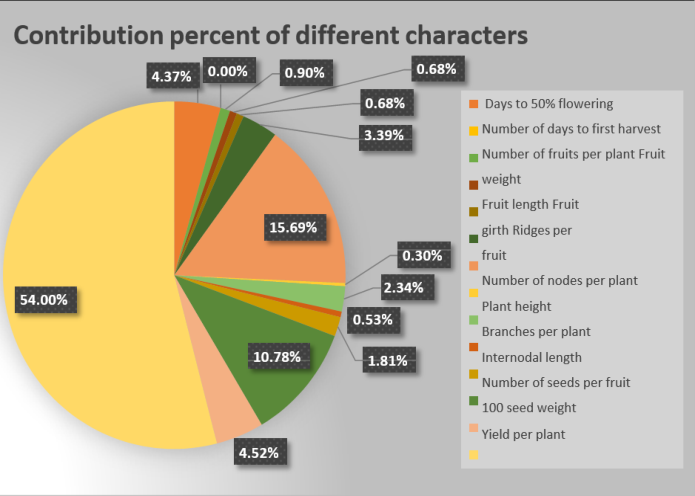 Figure 2
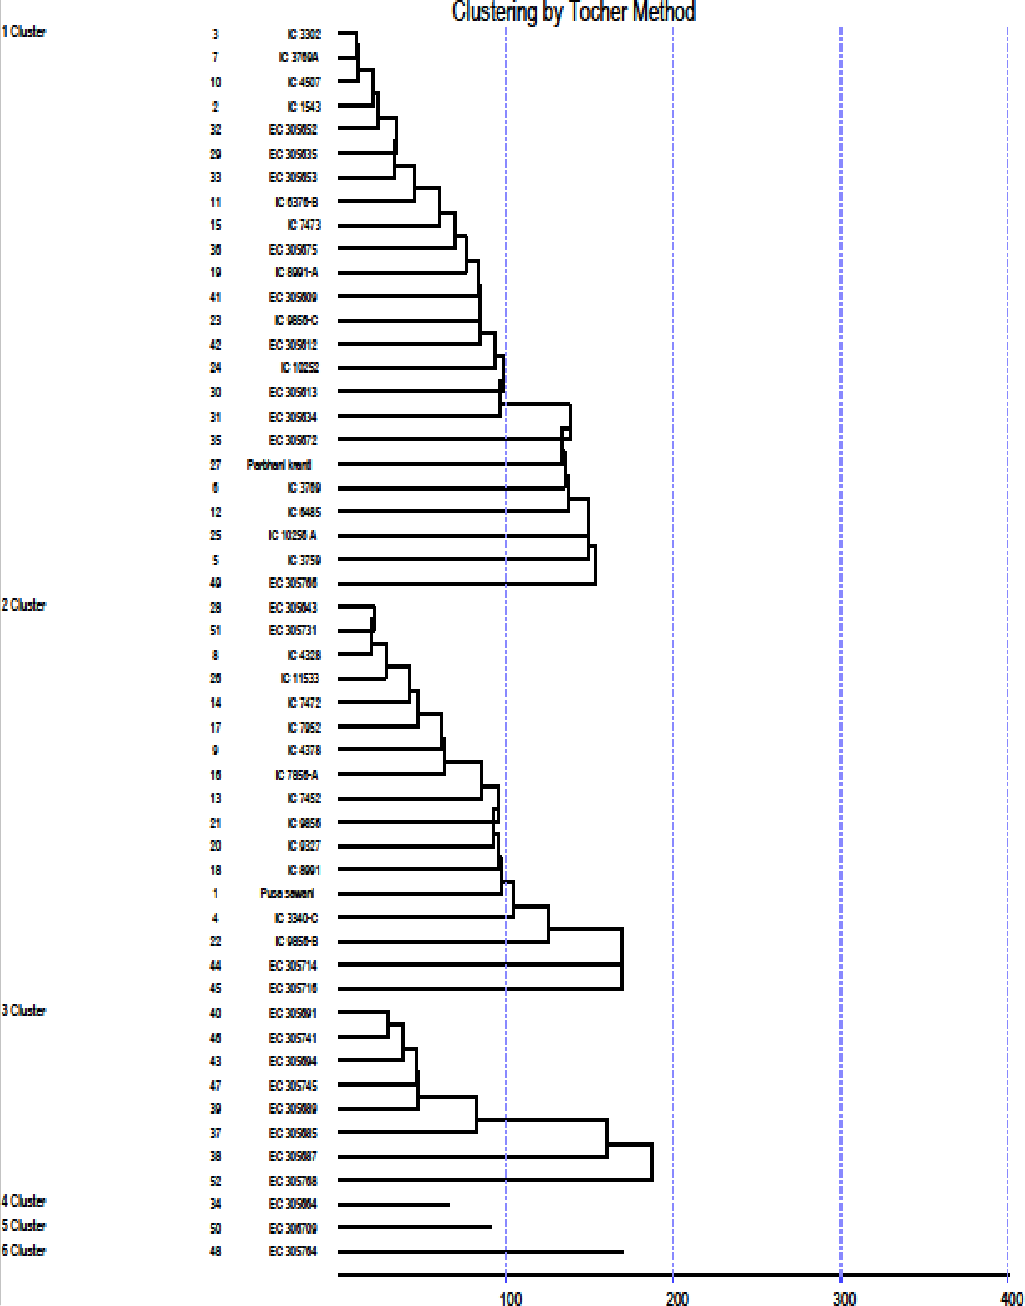 Figure 3
Introduction
Okra (Abelmoschus esculentus (L.) Moench) also known as Lady's finger, Bhindi etc. is belongs to family malvaceae. It is widely distributed and cultivated in the tropics, sub-tropics and warmer portions of the temperate region of the world. It is a vegetable rich in vitamins and mineral salt including calcium which are often lacking in diet further containing 86.1% water, 2.2% protein, 0.2% fat, 9.7% carbohydrate, 1.0% fiber and 0.8% ash. This nutritious fruit plays an important role to meet the demand of vegetables in the country. Okra is an often cross pollinated crop, heterosis is being exploited in form of development of hybrids. Hence, genetic divergence is an important tool while selecting the parents for hybrid breeding. Divergence analysis is more authentic and powerful tool for systematic identification of the diverse genotypes for hybridization purpose (Mahalanobis, 1936) [5] . The success of breeding programme depends to a large measure on the degree of genetic divergence. Genetic diversity is of paramount importance for heterosis. Hybridization between genetically divergent parents is expected to produce superior hybrids and desirable recombinants and more effective use of plant genetic resources is crucial fo the sustainable of the food of the country. Mahalanobis D 2 statistics appears to be a fruitful approach which is based on multivariate analysis and serves to be a good index of genetic diversity.
Materials and Methods
The material for the present experimental investigation contained 52 okra genotypes received from NBPGR New Delhi including 2 checks viz., Parbhani Kranti and Pusa Sawani, were evaluated to study the genetic diversity. The experiment was conducted at the research farm of Breeder Seed Production Unit, VNMKV, Parbhani during kharif 2020. The experiment was laid out in randomized block design with two replications. Rows were spaced at 60 cm, while plants were spaced at 30 cm in the rows. Recommended package of practices were followed to raise a healthy crop. The data on fourteen yield and yield contributing characters were recorded on five competitive plants of each genotype selected randomly in each replication. Data were collected on days to 50 percent flowering, number of days to first harvest, number of fruits per plant, fruit weight (g), fruit length (cm), fruit girth (cm), number of ridges per fruit, number of nodes per plant, plant height (cm), number of branches per plant, internodal length (cm), number of seeds per fruit, 100 seed weight (g) and yield per plant (g). The mean for each character over two replications was computed for each genotype and analyzed statistically. Genetic diversity between groups was estimated by using D 2 statistics given by Mahalanobis (1936) [5] following the procedure given by Rao (1952) [8] . The mean values were computed to calculate D 2 values between all possible pairs of genotypes. The grouping of genotypes was done using Tocher's method as described by Rao (1952) [8] .
Results and Discussion
The analysis of variance indicated significant variation among the fifty two okra genotypes for each of the fourteen characters. This suggested that large variability existed among genotypes and the analysis of genetic divergence is reasonable.
Cluster formation
As per Tocher's method the 52 genotypes were grouped into six cluster based on D 2 value such that the genotypes belonging to same cluster had an average smaller D 2 value than those belong to different cluster. Out of 6 cluster formed cluster I comprising maximum number of genotypes (24), followed by cluster II (17) and cluster III contains 8 genotypes. Cluster IV, V and VI were solitary cluster contains only one genotypes each. The formation of solitary cluster may be due to total isolation of preventing gene flow or natural / human selection for rigorous diverse adaptive complexes. These genotypes may be very unique and useful in breeding point of view.
Average intra cluster and inter cluster D2 values
The maximum inter cluster distance was observed between cluster II and VI (1079.84) followed by cluster I and VI (805.57), cluster IV and VI (760.33), cluster V and VI (750.43), cluster I and V (533.37), cluster II and III (484.52), cluster I and II (365.51), cluster I and III (356.48), cluster III and VI (324.36), cluster III and IV (314.21) and cluster III and V (304.69). The inter cluster distance was found to be least between cluster I and IV (277.23) followed by cluster IV and V (248.58), cluster II and IV (239.35) and cluster II and V (222.92). The maximum intra cluster distance were expressed by cluster III (131.38) followed by cluster I (115.72) and cluster II (115.17). Similar findings reported by Singh et al. (2017) [10] , Ranpise et al. (2018) [7] and Kumar et al. (2016) [4] .
Cluster means
Cluster mean indicated the variation for the traits among the clusters. The genotypes in cluster IV (46.00) were earliest to flowering followed by cluster II (46.56) and cluster I (47.35). The genotypes in cluster VI (52.50) followed by cluster III (51.94) and cluster V (49.50) were late in flowering. The genotypes in cluster IV (50.50), cluster II (51.32) and cluster I (52.00) required less number of days to first harvest. While genotypes in cluster III (56.88), cluster VI (56.50) and cluster V (54.00) required maximum number of days to first harvest. The cluster V (8.00) had lowest number of fruits per plant followed by cluster VI (9.50). The highest number of fruits were recorded for cluster I (16.50), cluster IV (15.90), cluster II (11.50) and cluster III (11.30). The cluster mean value of cluster VI (32.00) was highest for fruit weight followed by cluster III (22.76). Cluster IV (12.00) recorded the lowest fruit wight followed by cluster VI (12.70), cluster II (13.57) and cluster I (17.36). The genotypes in cluster VI (9.80) had smallest fruit length followed by cluster V (10.04). While genotypes in cluster I (15.80), cluster III (14.46), cluster IV (12.55) and cluster II (11.92) had largest fruit length. The genotypes in cluster VI (3.90) had maximum fruit girth followed by cluster III (2.09). Whereas genotypes in cluster V (1.35), cluster II (1.63), cluster I (1.72) and cluster IV (1.80) recorded lowest fruit girth. The cluster mean value of cluster IV (10.00) was highest for character number of ridges per fruit followed by cluster VI (9.50), cluster III (8.63) and cluster V (8.50). While genotypes in cluster II (5.35) and cluster I (5.50) had lowest number of ridges per fruit. The cluster mean value for number of nodes per plant was highest in cluster III (17.00) followed by cluster VI (15.70) and cluster I (15.48) and minimum number of nodes per plant recorded for cluster II (13.70), cluster V (13.70) and cluster IV (14.00). The genotypes in cluster VI (158.00) were tallest followed by cluster I (157.48). Whereas genotypes in cluster IV (113.45), cluster II (122.06), cluster V (133.60) and cluster III (136.17) were dwarf. The genotypes in cluster IV (2.00) had maximum number of branches per plant followed by cluster V (1.90) and cluster VI (1.80). While minimum number of branches were recorded for cluster II (1.58), cluster I (1.68) and cluster III (1.76). The cluster mean for internodal length was highest for cluster I (8.60) followed by cluster VI (8.17) and lowest internodal length was recorded in cluster III (6.26), cluster V (6.41), cluster II (7.15) and cluster IV (7.23). The cluster mean for number of seeds per fruit was highest in cluster VI (125.60) followed by cluster III (108.60). Genotypes in cluster IV (50.80) had minimum number of seeds per fruit followed by cluster II (58.54), cluster I (59.23) and cluster V (94.30). The genotypes in cluster VI (8.50) had highest 100 seed weight value followed by cluster III (5.69) and cluster IV (5.50). Whereas cluster V (3.50), cluster II (4.52) and cluster I (5.23) recorded lowest cluster mean for 100 seed weight. The cluster mean for yield per plant was highest in cluster VI (295.81) followed by cluster I (276.12) and cluster III (239.01). While lowest yield per plant was observed in genotypes of cluster V (107.48) followed by cluster II (152.54) and cluster IV (187.80). The cluster means showed high variance between the clusters for the characters days to 50 percent flowering, number of fruits per plant, fruit weight, number of ridges per fruit, number of nodes per plant, plant height, number of seeds per fruit and yield per plant. Similar findings reported by Ranpise et al. (2018) [7] , Balai et al. (2015) [3] .
Relative contribution of characters towards divergence
Among the characters studied yield per plant (54.00%) maximum contributed to total variation by 716 times ranked first followed by number of ridges per fruit (15.69%) ranked first by 208 times, number of seeds per fruit (10.78%) ranked first by 143 times, 100 seed weight (4.52%) ranked first by 60 times, days to 50 percent flowering (4.37%) ranked first by 58 times, fruit girth (3.39%) ranked first by 45 times, plant height (2.34%) ranked first by 31 times, internodal length (1.81%) ranked first by 24 times, fruit weight (0.68%) and fruit length (0.68%) both ranked by 9 times, number of branches per plant (0.53%) ranked first by 7times, number of fruits per plant (0.9%) ranked first by 12 times, number of nodes per plant (0.3%) ranked first by 4 times while, contribution of number of days to first harvest to genetic diversity was zero percentage. Similar results were observed by Ranpise et al. (2018) [7] , Ramgiry et al. (2017) [6] , Bashar et al. (2014) [2] , Shaikh et al. (2013) [9] and Akotkar et al. (2010) [1] .
Conclusion
Divergence study revealed that, highest cluster mean for yield per plant was observed in cluster VI, cluster I and cluster III. Hence, the crosses between the genotypes of these clusters can be tried for improvement of yield. Genetic diversity is largely contributed by yield per plant followed by number of ridges per fruit, number of seeds per fruit, 100 seed weight, days to 50 percent flowering, fruit girth, plant height and internodal length. Thus, these characters may be given high emphasis while selecting genotypes for hybridization programme to generate large variability and it will provide immense scope for improvement of yield through selection. Highly divergent parents can be crossed for creating variability and isolating better segregants in advanced generation.
Acknowledgement
AcknowledgmentAuthors are thankful to Director, ICAR-National Bureau of Plant Genetic Resources, New Delhi for providing germplasm for the study.
Figures and tables from the paper
| Sr. No | Genotypes | DFF | NDFH | NFPP | FW | FL | FG | NRPF | NNPP | PH | NBPP | IL | NSPF | HSW | YPP |
|---|---|---|---|---|---|---|---|---|---|---|---|---|---|---|---|
| 1 | Pusa sawani | 46.50 | 51.50 | 14.50 | 14.25 | 11.28 | 1.65 | 5.00 | 15.80 | 147.80 | 2.15 | 6.18 | 42.00 | 6.00 | 212.85 |
| 2 | IC 1543 | 46.50 | 50.50 | 18.80 | 18.00 | 18.40 | 1.90 | 5.00 | 15.80 | 166.00 | 2.35 | 10.70 | 58.20 | 5.50 | 319.65 |
| 3 | IC 3302 | 47.50 | 51.50 | 17.50 | 17.30 | 14.90 | 1.75 | 5.00 | 16.20 | 168.51 | 1.70 | 10.00 | 50.80 | 5.00 | 298.75 |
| 4 | IC 3340-C | 47.50 | 53.00 | 10.10 | 16.95 | 12.96 | 1.75 | 7.00 | 14.80 | 108.25 | 1.30 | 6.85 | 66.70 | 3.00 | 158.52 |
| 5 | IC 3759 | 46.50 | 51.00 | 13.10 | 15.05 | 14.21 | 1.90 | 5.00 | 16.10 | 149.20 | 1.75 | 7.98 | 48.20 | 3.50 | 193.35 |
| 6 | IC 3769 | 47.50 | 52.50 | 12.70 | 17.85 | 12.98 | 1.65 | 5.00 | 15.10 | 128.00 | 1.40 | 8.49 | 50.50 | 4.50 | 228.30 |
| 7 | IC 3769A | 47.50 | 52.00 | 17.10 | 18.95 | 16.30 | 1.65 | 5.00 | 15.00 | 166.00 | 1.75 | 9.55 | 59.30 | 6.50 | 315.00 |
| 8 | IC 4328 | 46.50 | 51.50 | 12.50 | 12.90 | 12.50 | 1.75 | 5.00 | 13.60 | 117.50 | 1.50 | 7.45 | 52.60 | 7.00 | 155.00 |
| 9 | IC 4378 | 45.50 | 50.00 | 12.80 | 12.70 | 15.25 | 1.65 | 5.00 | 12.80 | 137.50 | 1.20 | 9.07 | 50.60 | 5.50 | 157.80 |
| 10 | IC 4507 | 47.50 | 52.00 | 17.50 | 18.30 | 15.31 | 1.60 | 5.00 | 18.10 | 162.00 | 1.70 | 9.10 | 56.00 | 4.00 | 316.00 |
| 11 | IC 6376-B | 45.00 | 50.00 | 17.50 | 19.50 | 17.15 | 1.75 | 5.00 | 15.80 | 164.30 | 1.50 | 8.75 | 66.60 | 3.00 | 335.45 |
| 12 | IC 6485 | 42.50 | 46.50 | 13.90 | 19.00 | 14.94 | 1.65 | 5.00 | 15.00 | 140.50 | 1.50 | 8.38 | 60.00 | 6.50 | 243.37 |
| 13 | IC 7452 | 44.50 | 49.50 | 12.80 | 14.85 | 11.90 | 1.85 | 5.00 | 12.50 | 130.00 | 1.30 | 8.99 | 57.40 | 3.50 | 180.40 |
| 14 | IC 7472 | 44.50 | 49.50 | 11.00 | 14.02 | 12.55 | 1.60 | 5.00 | 13.90 | 107.50 | 1.90 | 6.03 | 60.40 | 3.00 | 131.20 |
| 15 | IC 7473 | 45.50 | 50.00 | 17.90 | 15.80 | 18.90 | 1.70 | 5.00 | 16.85 | 162.30 | 1.50 | 8.50 | 50.20 | 5.50 | 272.20 |
| 16 | IC 7856-A | 45.50 | 50.00 | 9.70 | 12.80 | 11.87 | 1.35 | 5.00 | 14.00 | 156.60 | 1.50 | 7.08 | 54.80 | 3.60 | 132.65 |
| 17 | IC 7952 | 43.50 | 48.00 | 9.60 | 11.55 | 11.02 | 1.40 | 5.00 | 10.90 | 112.10 | 1.50 | 5.56 | 47.40 | 1.75 | 112.50 |
| 18 | IC 8991 | 43.00 | 48.00 | 13.00 | 16.40 | 14.03 | 1.55 | 5.50 | 14.00 | 143.00 | 1.50 | 9.80 | 57.40 | 6.50 | 200.10 |
| 19 | IC 8991-A | 45.50 | 51.00 | 16.00 | 17.50 | 14.79 | 1.70 | 7.50 | 14.20 | 159.90 | 1.50 | 8.76 | 64.30 | 4.50 | 287.93 |
| 20 | IC 9327 | 45.50 | 50.50 | 14.15 | 14.85 | 13.03 | 1.70 | 5.00 | 12.85 | 123.45 | 1.20 | 7.09 | 51.40 | 3.50 | 198.40 |
| 21 | IC 9856 | 43.00 | 47.50 | 15.35 | 11.65 | 8.84 | 1.75 | 5.00 | 13.60 | 113.25 | 1.30 | 6.89 | 59.40 | 3.00 | 183.20 |
| 22 | IC 9856-B | 47.50 | 51.50 | 12.80 | 12.50 | 10.24 | 1.85 | 8.50 | 12.00 | 107.30 | 1.70 | 7.16 | 74.80 | 4.50 | 156.20 |
| 23 | IC 9856-C | 48.50 | 53.50 | 15.25 | 17.75 | 14.88 | 1.60 | 7.00 | 16.30 | 130.50 | 1.70 | 8.00 | 62.40 | 3.00 | 261.10 |
| 24 | IC 10252 | 48.50 | 53.00 | 16.00 | 16.35 | 16.38 | 1.60 | 7.50 | 13.70 | 152.50 | 1.75 | 8.75 | 79.95 | 5.50 | 257.50 |
| 25 | IC 10256A | 51.50 | 56.50 | 16.50 | 14.05 | 13.42 | 1.70 | 5.00 | 13.75 | 145.00 | 1.70 | 8.85 | 69.30 | 6.50 | 228.00 |
| 26 | IC 11533 | 48.50 | 53.00 | 12.20 | 10.75 | 12.30 | 1.30 | 5.00 | 13.50 | 117.50 | 1.55 | 8.70 | 58.50 | 5.50 | 133.30 |
| 27 | Parbhani Kranti | 44.50 | 49.00 | 15.85 | 13.85 | 13.20 | 1.60 | 5.00 | 16.00 | 159.00 | 1.50 | 8.15 | 48.40 | 6.00 | 227.40 |
| 28 | EC 305643 | 45.50 | 50.50 | 9.20 | 13.20 | 12.78 | 1.55 | 5.00 | 13.00 | 96.95 | 1.80 | 6.46 | 45.30 | 5.00 | 120.25 |
| 29 | EC 305635 | 46.50 | 52.00 | 19.50 | 18.00 | 19.30 | 1.70 | 5.00 | 16.70 | 176.00 | 1.70 | 8.28 | 49.10 | 5.50 | 337.50 |
| 30 | EC 305613 | 48.50 | 53.50 | 15.20 | 15.50 | 16.85 | 1.80 | 7.00 | 13.50 | 158.50 | 1.90 | 9.40 | 42.40 | 4.50 | 231.00 |
| 31 | EC 305634 | 47.50 | 51.50 | 13.80 | 18.75 | 16.55 | 1.65 | 5.00 | 14.00 | 162.50 | 1.70 | 8.21 | 53.90 | 5.50 | 247.00 |
| 32 | EC 305652 | 45.50 | 49.50 | 17.50 | 18.95 | 16.48 | 1.75 | 5.00 | 15.20 | 172.25 | 1.70 | 9.23 | 55.20 | 3.00 | 310.50 |
| 33 | EC 305653 | 47.50 | 52.50 | 19.50 | 18.75 | 17.15 | 1.60 | 5.00 | 17.35 | 175.00 | 1.50 | 9.07 | 60.40 | 6.50 | 355.40 |
| 34 | EC 305664 | 46.00 | 50.50 | 15.90 | 12.00 | 12.55 | 1.80 | 10.00 | 14.00 | 113.45 | 2.00 | 7.23 | 50.80 | 5.50 | 187.80 |
| 35 | EC 305672 | 45.50 | 50.00 | 15.85 | 16.60 | 13.04 | 1.55 | 5.00 | 15.90 | 160.15 | 1.60 | 6.31 | 59.30 | 7.50 | 251.00 |
| 36 | EC 305675 | 45.50 | 50.00 | 18.05 | 16.80 | 17.10 | 1.50 | 5.00 | 16.00 | 175.80 | 1.90 | 9.00 | 59.30 | 6.50 | 276.50 |
| 37 | EC 305685 | 50.50 | 55.50 | 9.90 | 22.00 | 17.38 | 2.10 | 9.00 | 15.60 | 128.00 | 1.60 | 6.78 | 101.50 | 9.00 | 208.90 |
| 38 | EC 305687 | 51.00 | 55.50 | 11.50 | 21.80 | 15.59 | 1.90 | 9.50 | 17.10 | 128.90 | 1.70 | 6.59 | 160.00 | 5.25 | 238.70 |
| 39 | EC 305689 | 49.50 | 55.50 | 12.90 | 20.30 | 15.10 | 1.65 | 9.00 | 16.90 | 141.70 | 1.70 | 5.90 | 99.30 | 6.00 | 247.50 |
| 40 | EC 305691 | 52.50 | 57.50 | 11.00 | 23.05 | 12.98 | 1.90 | 8.50 | 15.40 | 133.65 | 2.10 | 6.74 | 104.60 | 6.00 | 234.40 |
| 41 | EC 305609 | 53.50 | 58.50 | 19.50 | 17.65 | 17.39 | 1.85 | 5.00 | 16.90 | 171.05 | 1.70 | 9.22 | 70.60 | 4.50 | 299.60 |
| 42 | EC 305612 | 49.50 | 54.50 | 18.35 | 17.35 | 16.00 | 2.00 | 5.00 | 15.00 | 149.30 | 1.70 | 7.21 | 73.30 | 7.50 | 291.25 |
| 43 | EC 305694 | 54.50 | 60.00 | 10.70 | 21.50 | 14.84 | 2.05 | 9.00 | 20.60 | 140.70 | 1.50 | 4.71 | 98.50 | 4.50 | 216.45 |
| 44 | EC 305714 | 52.50 | 57.00 | 7.50 | 14.50 | 11.73 | 1.70 | 5.00 | 16.40 | 108.50 | 2.10 | 5.26 | 77.80 | 5.00 | 110.70 |
| 45 | EC 305716 | 53.50 | 58.50 | 9.15 | 10.75 | 9.83 | 1.75 | 5.00 | 15.60 | 140.20 | 1.60 | 6.04 | 85.50 | 3.50 | 107.90 |
| 46 | EC 305741 | 52.50 | 56.50 | 9.80 | 23.10 | 13.12 | 2.10 | 7.50 | 16.90 | 136.20 | 1.90 | 8.08 | 117.80 | 5.50 | 222.05 |
| 47 | EC 305745 | 53.50 | 58.50 | 12.90 | 21.30 | 16.80 | 2.10 | 9.00 | 18.30 | 134.20 | 2.30 | 4.33 | 94.50 | 4.00 | 249.10 |
| 48 | EC 305764 | 52.50 | 56.50 | 9.50 | 32.00 | 9.80 | 3.90 | 9.50 | 15.70 | 158.00 | 1.80 | 8.16 | 125.60 | 8.50 | 295.80 |
| 49 | EC 305766 | 52.50 | 57.00 | 13.20 | 19.00 | 13.50 | 2.10 | 8.00 | 13.00 | 125.30 | 1.70 | 6.38 | 73.80 | 5.00 | 243.10 |
| 50 | EC 306709 | 49.50 | 54.00 | 8.00 | 12.70 | 10.04 | 1.35 | 8.50 | 13.70 | 133.60 | 1.90 | 6.41 | 94.30 | 3.50 | 107.48 |
| 51 | EC 305731 | 48.50 | 53.00 | 9.20 | 16.10 | 10.54 | 1.55 | 5.00 | 13.60 | 107.60 | 1.80 | 6.83 | 53.20 | 7.00 | 142.17 |
| 52 | EC 305768 | 51.50 | 56.00 | 11.70 | 29.00 | 9.87 | 2.90 | 7.50 | 15.20 | 146.00 | 1.30 | 6.93 | 92.60 | 5.25 | 295.00 |
| Mean | 47.91 | 52.62 | 13.75 | 17.03 | 14.03 | 1.78 | 6.15 | 15.07 | 141.32 | 1.67 | 7.68 | 68.38 | 5.10 | 225.44 | |
| C.V. | 1.69 | 1.87 | 5.87 | 6.58 | 6.16 | 8.22 | 5.08 | 7.68 | 4.371 | 10.05 | 7.65 | 6.13 | 12.33 | 3.48 | |
| SE+ | 0.57 | 0.69 | 0.57 | 0.79 | 0.61 | 0.10 | 0.22 | 0.81 | 4.37 | 0.11 | 0.41 | 2.96 | 0.44 | 5.55 | |
| CD at 5% | 1.62 | 1.98 | 1.62 | 2.25 | 1.73 | 0.29 | 0.62 | 2.32 | 12.41 | 0.33 | 1.18 | 8.42 | 1.26 | 15.77 |
Table text extracted from the original PDF; superscript letters are shown inline. The original table image is below.
View original table image
| Sr. No. | Characters | Mean Sum of Square | — | — |
|---|---|---|---|---|
| Replication (1 d. f.) | Treatment (51 d. f.) | Error (51 d. f.) | ||
| 1 | Days to 50% flowering | 0.00 | 19.66*** | 0.65 |
| 2 | Number of days to first harvest | 0.77 | 20.78*** | 0.97 |
| 3 | Number of fruits per plant | 0.11 | 22.04*** | 0.65 |
| 4 | Fruit weight (g) | 0.02 | 35.35*** | 1.25 |
| 5 | Fruit length (cm) | 0.05 | 13.60*** | 0.74 |
| 6 | Fruit girth (g) | 0.02 | 0.30*** | 0.02 |
| 7 | Number of ridges per fruit | 0.00 | 5.61*** | 0.09 |
| 8 | Number of nodes per plant | 12.04** | 6.34*** | 1.34 |
| 9 | Plant height (cm) | 70.32 | 940.87*** | 38.27 |
| 10 | Number of branches per plant | 0.02 | 0.13*** | 0.02 |
| 11 | Internodal length (cm) | 0.23 | 4.05*** | 0.34 |
| 12 | Number of seeds per fruit | 0.00 | 1120.04*** | 17.59 |
| 13 | 100 seed weight (g) | 0.00 | 4.68*** | 0.39 |
| 14 | Yield per plant (g) | 12.50 | 9316.66*** | 61.74 |
Table text extracted from the original PDF; superscript letters are shown inline. The original table image is below.
View original table image
| Cluster | I | II | III | IV | V | VI |
|---|---|---|---|---|---|---|
| I | 115.72 | 365.51 | 356.48 | 277.23 | 533.37 | 805.57 |
| II | 115.17 | 484.52 | 239.35 | 222.92 | 1079.84 | |
| III | 131.38 | 314.21 | 304.69 | 324.36 | ||
| IV | 0.00 | 248.58 | 760.33 | |||
| V | 0.00 | 750.43 | ||||
| VI | 0.00 |
Table text extracted from the original PDF; superscript letters are shown inline. The original table image is below.
View original table image
| Characters | Cluster I | Cluster II | Cluster III | Cluster IV | Cluster V | Cluster VI |
|---|---|---|---|---|---|---|
| Days to 50% flowering | 47.35 | 46.56 | 51.94 | 46.00 | 49.50 | 52.50 |
| Number of days to first harvest | 52.00 | 51.32 | 56.88 | 50.50 | 54.00 | 56.50 |
| Number of fruits per plant | 16.50 | 11.50 | 11.30 | 15.90 | 8.00 | 9.50 |
| Fruit weight (g) | 17.36 | 13.57 | 22.76 | 12.00 | 12.70 | 32.00 |
| Fruit length (cm) | 15.80 | 11.92 | 14.46 | 12.55 | 10.04 | 9.80 |
| Fruit girth (cm) | 1.72 | 1.63 | 2.09 | 1.80 | 1.35 | 3.90 |
| Number of ridges per fruit | 5.50 | 5.35 | 8.63 | 10.00 | 8.50 | 9.50 |
| Number of nodes per plant | 15.48 | 13.70 | 17.00 | 14.00 | 13.70 | 15.70 |
| Plant height (cm) | 157.48 | 122.06 | 136.17 | 113.45 | 133.60 | 158.00 |
| Number of branches per plant | 1.68 | 1.58 | 1.76 | 2.00 | 1.90 | 1.80 |
| Internodal length (cm) | 8.60 | 7.15 | 6.26 | 7.23 | 6.41 | 8.17 |
| Number of seeds per fruit | 59.23 | 58.54 | 108.60 | 50.80 | 94.30 | 125.60 |
| 100 seed weight (g) | 5.23 | 4.52 | 5.69 | 5.50 | 3.50 | 8.50 |
| Yield per plant (g) | 276.12 | 152.54 | 239.01 | 187.80 | 107.48 | 295.81 |
Table text extracted from the original PDF; superscript letters are shown inline. The original table image is below.
View original table image
| Sr. No. | Characters | Contribution % | Times ranked 1st |
|---|---|---|---|
| 1 | Days to 50% flowering | 4.37% | 58 |
| 2 | Number of days to first harvest | 0.00% | 00 |
| 3 | Number of fruits per plant | 0.90% | 12 |
| 4 | Fruit weight (g) | 0.68% | 09 |
| 5 | Fruit length (cm) | 0.68% | 09 |
| 6 | Fruit girth (cm) | 3.39% | 45 |
| 7 | Number of ridges per fruit | 15.69% | 208 |
| 8 | Number of nodes per plant | 0.30% | 04 |
| 9 | Plant height (cm) | 2.34% | 31 |
| 10 | Number of branches per plant | 0.53% | 07 |
| 11 | Internodal length (cm) | 1.81% | 24 |
| 12 | Number of seeds per fruit | 10.78% | 143 |
| 13 | 100 seed weight (g) | 4.52% | 60 |
| 14 | Yield per plant (g) | 54.00% | 716 |
Table text extracted from the original PDF; superscript letters are shown inline. The original table image is below.
View original table image
References
9 in the original paper- Electronic Journal of Plant Breeding. 2010;1(4):393-398.
- Bashar A, Hossain MK, Alam N, Ahmed FA, Hasan R, Islam S. Genetic diversity in nine commercial okra [Abelmoschus esculentus (L.) Moench] genotypes. Jahangirnagar University J Biol. Sci. 2014;3(2):25-32.
- Moench.] genotypes. Electronic Journal of Plant Breeding. 2015;6(2):619-624.
- Kumar A, Solankey SS, Nand N, Adarsh A, Verma RB. Assessment of genetic diversity in okra [Abelmoschus esculentus (L.) Moench] for yield and yellow vein mosaic virus incidence. International Journal of Agriculture, Environment Biotechnology. 2016;9(4):485-491.
- Mahalanobis PC. On the generalized distance in statistics. Proc. Nat. Inst. Sci., India. 1936;2(1):49-55.
- Ramgiry M, Singh S. Genetic divergence analysis in okra [Abelmoschus esculentus (L.) Moench). Int. J Pure App. Biosci. 2017;5(2):981-986.
- Ranpise PS, Joshi VR, Patil BT. Diversity studies in okra [Abelmoschus esculentus (L.) Moench]. Journal of Pharmacognosy and Phytochemistry. 2018;7(1):1412-1414.
- Electronic Journal of Plant Breeding. 2013;4(3):1258-1260.
- Singh D, Dudi BS, Dhankhar SK, Rajkumar. Genetic diversity analysis of okra Genotypes using morphological markers. Int. J Curr. Microbiol. App. Sci. 2018;7(1):16671675.
Cited by 2
From OpenAlex, OpenCitations and reference lists read by Scinovex
- Genetic Divergence Analysis of Inbred Lines of Okra [Abelmoschus esculentus (L.) Moench] ↗
D. Vishnu Priyanka, Medagam Thirupathi Reddy, Husna Begum, N. Sunil, Mudduluru Jayaprada · International Journal of Current Microbiology and Applied Sciences · 2017
Genetic divergence analysis following Mahalanobis D2 statistics revealed considerable genetic diversity among 29 genotypes of okra [Abelmoschus esculentus (L.) Moench] for all the eighteen characters which pertaining to the growth, earliness and yield. Twenty nine genotypes were grouped into 5 distinct clusters depending upon the similarities of their D2 values following Tocher’s method. The characters YVMV infestation, fruit length and…
❝ 7PDF - Estimation of genetic divergence in okra [Abelmoschus esculentus (L.) Moench] ↗
Vipin Kumar Maurya, GC Yadav · Vegetable Science · 2021
Okra [Abelmoschus esculentus (L.) Moench 2n =2x=130] is one of the important members of the familyMalvaceae and is well-known by many regional namesas Bhindi in India, lady’s finger in England, Gumbo inUSA, Dherosh in Bangladesh, Huang GiuKui in Chinaand Quingombo in Spanish. It is a summer and rainyseason crop and is widely cultivated from tropics to subtropics (Kochar 1986). In…
❝ 6PDF