
Research article · 2024 · Full text
International Journal of Research in AgronomyEffect of integrated nutrient management on baby corn (Zea mays L.) in new alluvial zone of West Bengal, India in rabi season
Volume 7(7) · Pages 01–06 · DOI: 10.33545/2618060x.2024.v7.i7a.967 ↗
Research areasCrop Yield and Soil Fertility
Abstract
Author-writtenA field experiment was conducted in the rabi season of 2021-2022 at the District Seed Farm (AB) of Bidhan Chandra Krishi Viswavidyalaya (B.C.K.V.), Kalyani, Nadia, West Bengal, India with the objectives of to study the effect of Integrated Nutrient Management (INM) on the growth, yield attributes, yield, and economics of baby corn, and to evaluate the nutrient uptake and residual soil fertility under different INM treatments. The analysis was carried out by using a Randomized Block Design (RBD) with 3 replications and 7 treatments, namely, T1 [Farmers' Fertilizer Practice (120:60:40 kg N:P2O5:K2O ha-1)], T2 [Recommended Dose of Fertilizer (RDF) (150:60:40 kg N:P2O5:K2O ha-1)], T3 [RDF + Green Manuring (Dhaincha)], T4 (RDF + 5 t ha-1 FYM), T5 (RDF + 10 t ha-1 FYM), T6 (RDF + 15 t ha-1 FYM), and T7 (RDF + 20 t ha-1 FYM). Other cultivation practices were kept according to standard recommendations. Plant height (cm), leaf area index (LAI), dry matter accumulation, and crop growth rate (g.m-2.day-1) were all recorded under the T7 treatment, which was statistically at par with T6 at all stages of crop growth. The T7 treatment had a 50.4% higher average cob yield without husk than the T1 treatment (Farmers' Fertilizer Practice) as well as the highest gross return (Rs. 3,78,938.52 ha-1) and net return (Rs. 2,77,588.52 ha-1),but the T6 treatment had the highest benefit-cost ratio (4.02). As a result, from the findings it can be concluded that cultivating baby corn in the new alluvial zone of West Bengal with RDF + 15 t ha-1 FYM is a suitable option for increasing yield, income and nutrients absorption during the rabi season.
Summary
Source-checkedPlain-language reading of the full paper, prepared with AI and checked against the text. Each point links to the authors' own words.
Why it matters
- Maize is a critical crop in India for food, feed, and industry, and baby corn is used in West Bengal to increase the value and diversity of its production. View evidence ↗
- Baby corn is nutritionally similar to other non-legume vegetables such as cabbage, cucumber, tomato, and cauliflower. View evidence ↗
- There is a critical need for sustainable nutrient management in maize to reduce reliance on inorganic fertilizers and maintain soil productivity and health. View evidence ↗
The question
- The study aimed to evaluate how Integrated Nutrient Management (INM) affects the growth, yield, economics, nutrient uptake, and residual soil fertility of baby corn. View evidence ↗
What they did
- The field experiment took place during the 2021-2022 rabi season at the District Seed Farm of Bidhan Chandra Krishi Viswavidyalaya in Nadia, West Bengal, India. View evidence ↗
- The study used a Randomized Block Design with three replications and seven treatments, ranging from farmers' practices (T1) and recommended fertilizer doses (T2) to combinations of RDF with green manuring (T3) or varying levels of Farm Yard Manure (FYM) from 5 to 20 t ha-1 (T4-T7). View evidence ↗
- Researchers measured biometric data (plant height, leaf area index, dry matter), yield components (cob number, length, and girth), nutrient uptake, and residual soil fertility. View evidence ↗
What they found
- Plant height was highest in T7 (RDF + 20 t ha-1 FYM) at 46.81 cm, 141.02 cm, and 231.11 cm at 20, 40, and 60 days after sowing (DAS), compared to the lowest in T1 (Farmers' Practice) at 30.71 cm, 119.08 cm, and 209.53 cm. View evidence ↗
- The number of cobs per plant was highest in T7 (2.06) and T6 (2.04), and lowest in T1 (1.52). View evidence ↗
- Cob yield with husk was highest in T7 (6.01 t ha-1) and T6 (5.85 t ha-1), and lowest in T1 (4.31 t ha-1). View evidence ↗
- Cob yield without husk was highest in T7 (2.56 t ha-1) and T6 (2.48 t ha-1), and lowest in T1 (1.29 t ha-1). View evidence ↗
- The highest benefit-cost ratio was 4.02 in T6 (RDF + 15 t ha-1 FYM), and the lowest was 3.36 in T1. View evidence ↗
What it means
- The authors conclude that using RDF combined with 15 t ha-1 of FYM is a suitable option for increasing baby corn yield, income, and nutrient absorption in the new alluvial zone of West Bengal. View evidence ↗
Visual summary
3 visualsIllustrations explain the paper; charts are replotted from the paper's own table values.
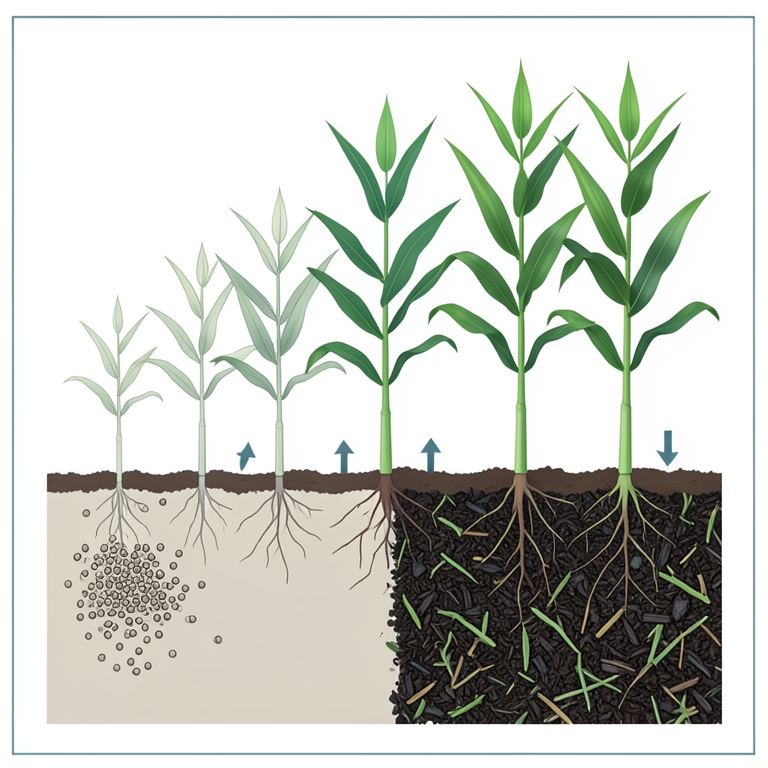
Nutrient Treatment Comparison
AI-generated conceptual illustration (baby corn (Zea mays L.) plants). It explains the idea and does not show study data.
View source evidence ↗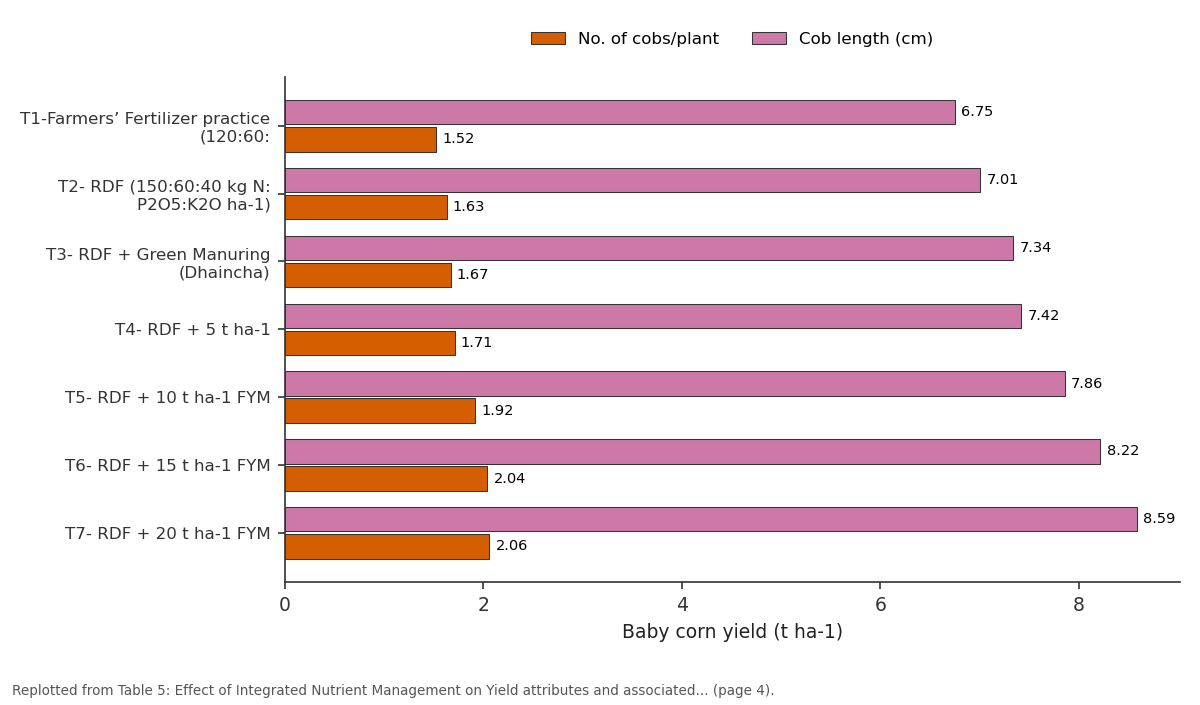
No. of cobs/plant and Cob length (cm): T1-Farmers’ Fertilizer... vs T2- RDF (150:60:40 kg... vs T3- RDF + Green... vs T4- RDF + 5 t ha-1 vs T5- RDF + 10 t ha-1 FYM
Replotted from Table 5 (page 4) of the original paper. Every bar is the paper's own table value.
View source evidence ↗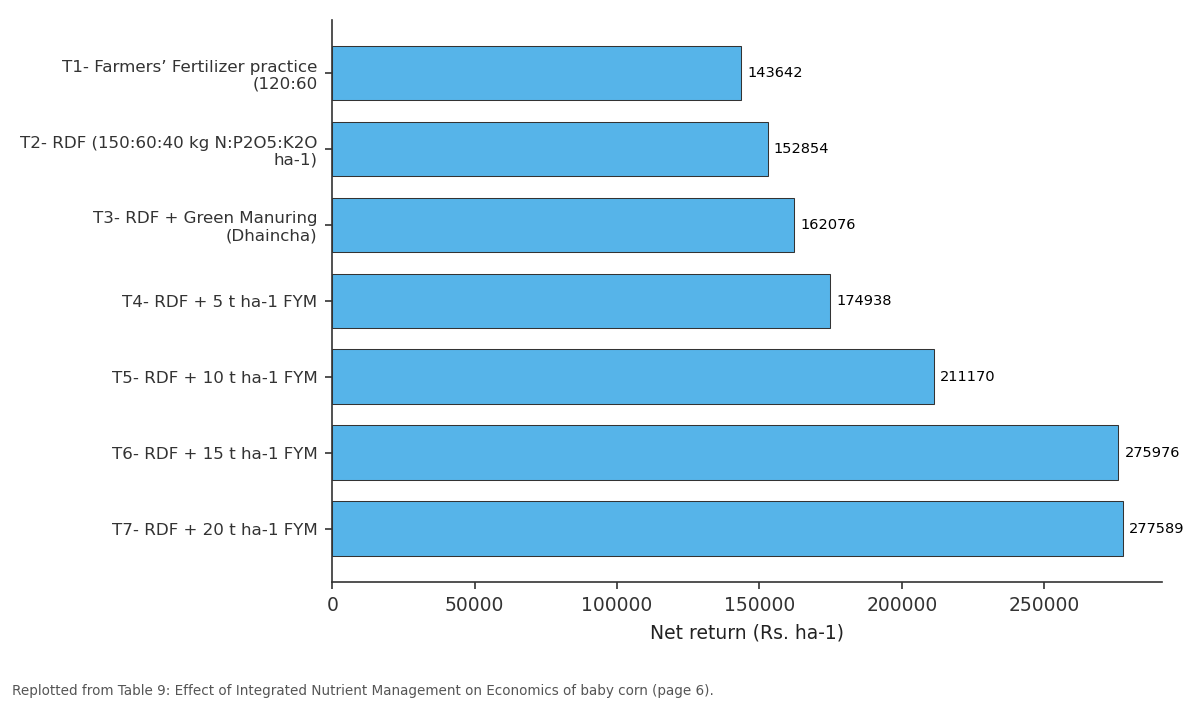
Net return (Rs. ha-1): T1- Farmers’ Fertilizer... vs T2- RDF (150:60:40 kg... vs T3- RDF + Green... vs T4- RDF + 5 t ha-1 FYM vs T5- RDF + 10 t ha-1 FYM
Replotted from Table 9 (page 6) of the original paper. Every bar is the paper's own table value.
View source evidence ↗Figures & tables
From the original paper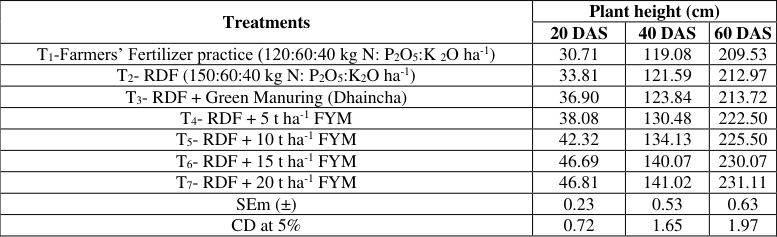 Table 1
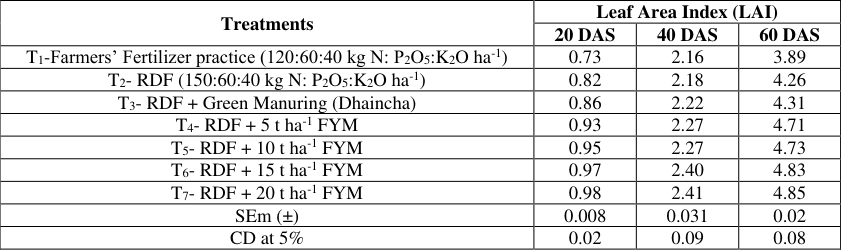 Table 2
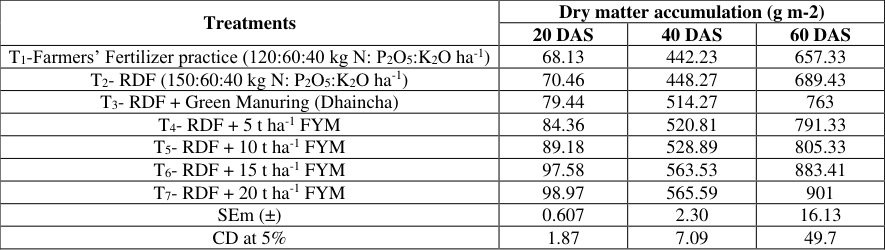 Table 3
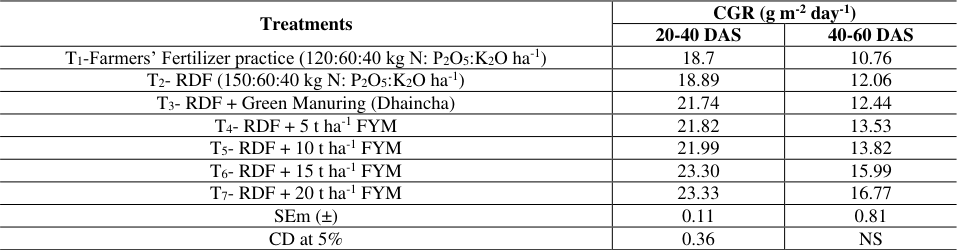 Table 4
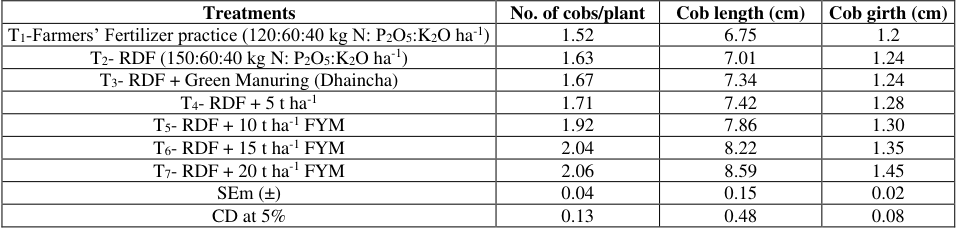 Table 5
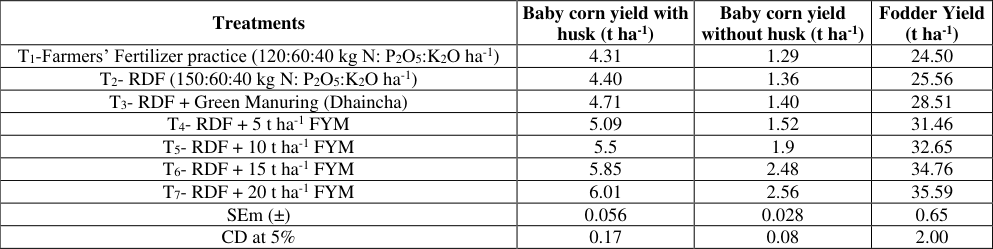 Table 6
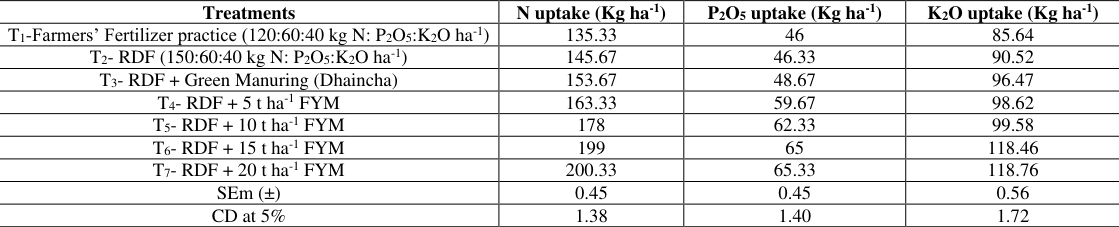 Table 7
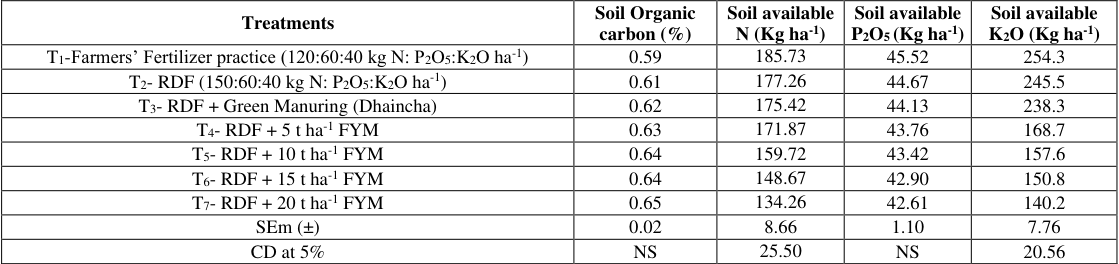 Table 8
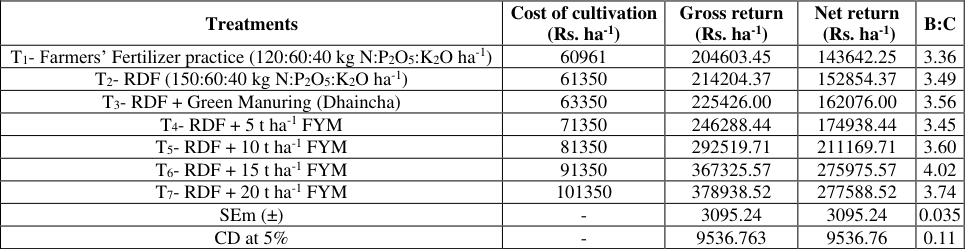 Table 9
Introduction
Maize, a term derived from the Haitian Arawak language and the Spanish word "mahiz" is widely recognized as a staple food crop, ranking third in global production behind rice and wheat. In India, maize holds extraordinary importance due to its diverse uses in food, feed, and industrial sectors. Baby corn cultivation has emerged as an effective method for increasing the value and diversity of maize production, especially in West Bengal. Baby corn, harvested before fertilization, offers lucrative domestic and international market opportunities. Well-established in Chinese culinary practices, baby corn has gained prominence across various Asian regions, finding its way into diverse dishes. Nutritionally, it is comparable to other non-legume vegetables like cauliflower, tomato, cucumber, and cabbage. A 100-gram serving of baby corn typically contains 89.1% moisture, 0.2 grams of fat, 1.9 grams of protein, 8.2 grams of carbohydrates, 0.06 grams of ash, 28.0 milligrams of calcium, 86.0 milligrams of phosphorus, and 11.0 milligrams of ascorbic acid (Thavaprakash et al., 2005; Das et al., 2008) [16, 3] . The development of baby corn has been notably successful in countries like Thailand and Taiwan. In India, there is a growing interest in exploring its potential to boost farmers' economic returns and foreign exchange earnings. Its cultivation is increasingly popular in various regions, including Meghalaya, western Uttar Pradesh, Haryana, Maharashtra, Karnataka, and Andhra Pradesh (Ramachandrappa et al., 2004) [13] .
Baby corn has emerged as a lucrative crop providing opportunities for increased income, value accumulation, and production diversification (Pandey et al., 2002) [12] . It has gained favor among producers in peri-urban areas due to its flexibility and promising returns. According to research (Barik et al., 2016) [2] , cultivating baby corn as a standalone crop, compared to other intercropping systems, significantly increases corn yield per hectare, baby corn production, gross returns, and return on investment. The agronomic requirements for growing baby corn are very similar to those for growing grain maize, with a few exceptions, such as choosing the right varieties, adjusting the density of the plant population, applying more nitrogen, and most importantly, harvesting early. The application of fertilizer and other cultural management practices profoundly impacts baby corn yield and quality. Maize yield and quality are significantly influenced by the nutritional levels provided to the plants ( Kunushi et al., 1986) [9] . The goal of this study is to find out how Integrated Nutrient Management (INM) affects baby corn production in the new alluvial zone of West Bengal during the rabi season. The study specifically examines growth attributes, yield, economics, nutrient uptake, and soil fertility under various INM practices. The research addresses the critical need for sustainable nutrient management practices in maize cultivation, considering the challenges posed by reliance on inorganic fertilizers and the imperative to maintain soil health and productivity. This study aims to improve maize crop yield, economic viability, and soil sustainability through a balanced approach that incorporates both chemical and organic fertilizers.
Materials and Methods
The main goal of the study was to determine how integrated nutrient management affects baby corn (Zea mays L.) in the new alluvial zone of West Bengal, India, during the Rabi season. The trial was carried out at the District Seed Farm of Bidhan Chandra Krishi Viswavidyalaya during the rabi season of 2021-2022. The area had a subtropical climate characterized by hot summers, variable rainfall, and high humidity. The pH of the sandy loam soil was neutral, and it was medium-fertile. 7 treatments were replicated 3 times in the experiment, which used a Randomized Block Design with a total of 21 plots. Plot dimensions were 5 m x 5 m, bund width was 0.5 m, and irrigation channel width was 1.0 m. The seed rate was 25 kg/ha, and spacing was 50 cm x 20 cm. The hybrid baby corn variety G-5414 was utilized in the experiment. These crops typically ranged in height from 180 to 220 cm. Fertilizer application varied throughout the treatments, utilizing organic sources such as Farm Yard Manure (FYM) and Green Manuring (Dhaincha). In the T 1 treatment [Farmers' Fertilizer Practice (120:60:40 kg N:P 2 O 5 :K 2 O ha -1 )], 1/3 of the nitrogen was applied as the basal dosage, 1/3 as the first top dressing three weeks after sowing, and the remaining 1/3 as the second top dressing at 50 DAS. In T 2 [RDF (150:60:40 kg N:P 2 O 5 :K 2 O ha -1 )] and T 3 [RDF + Green Manuring (Dhaincha)], the nutrient application was the same as T 1 , and green manuring was carried out at least 15 days prior to sowing in T 3 . In T 4 (RDF + 5 t ha -1 FYM), the nutrient application was the same as T 1 , and FYM was applied 15 days before sowing. In T 5 (RDF + 10 t ha -1 FYM), T 6 (RDF + 15 t ha - 1 FYM), and T 7 (RDF + 20 t ha -1 FYM), the nutrient and FYM application was the same as in T 4 . The nutritional contents of the organic sources employed in the experiment were as follows: Farm Yard Manure (FYM) contained 0.5% nitrogen (N), 0.2% phosphorus pentoxide (P 2 O 5 ), and 0.5% potassium oxide (K 2 O), whereas Green Manure (Dhaincha) had 3.50% N, 0.60% P 2 O 5 , and 1.20% K 2 O. Field activities were carefully planned, encompassing weeding, irrigation, fertilizing, seeding, harvesting, and land preparation. Several biometric observations, including plant height, leaf area index, and dry matter accumulation at distinct growth phases, were recorded. Yield components such as the number of cobs per plant, cob length, and cob girth were also recorded. To assess changes in soil fertility, nutrient uptake by baby corn and residual soil fertility analysis after harvest of baby corn were carried out. Estimating the cost of cultivation, gross return, net return, and benefit-cost ratio were all part of the economic analysis. Analysis of Variance was used in the statistical analysis to determine the significance of differences among the treatments. Overall, by combining agronomic, economic, and appropriate statistical procedures applied to the raw data, the study offered thorough insights into the impacts of Integrated Nutrient Management on the cultivation of baby corn (Gomez and Gomez, 1984) [5] .
Results and Discussion
Results and Discussion
Growth attributes
Plant height was measured at 20, 40, and 60 days after sowing (DAS) and was highly impacted by integrated nutrient management. Short-stature plants (30.71 cm, 119.08 cm, and 209.53 cm at 20, 40, and 60 DAS, respectively) were produced in treatment T 1 (Farmers' Fertilizer Practice), where the plot received 120:60:40 kg N:P 2 O 5 :K 2 O ha -1 . Tall-stature plants (46.81 cm, 141.02 cm, and 231.11 cm at 20, 40, and 60 DAS, respectively) were produced from treatment T 7 , which received RDF + 20 t ha-1 FYM, and this was statistically similar to treatment T 6 , which received RDF + 15 t ha-1 FYM. Plant height increased significantly with an increase in FYM level up to 20 t ha-1 + RDF at all growth phases, according to the mean data. Higher FYM + RDF may have encouraged plant growth, which in turn increased the number and length of internodes due to more cell division and cell elongation, ultimately leading to higher plant height. This could explain the increase in plant height associated with higher FYM dosages + RDF (Mahapatra et al., 2018; Hussain et al., 2014; Singh et al., 2016) [11,7,15] . [11,8] . [17,4,14] . [8] .
Yield
The experiment showed significant variation in cob yield with husk among the treatments. Treatment T 7 produced the highest yield with husk (6.01 t ha -1 ), which was statistically similar to Treatment T 6 (5.85 t ha -1 ). In contrast, Treatment T 1 resulted in the lowest yield with husk (4.31 t ha -1 ). Incorporating organic and inorganic nutrient sources while maintaining a balanced C:N can enhance baby corn yield and related attributes (Lone et al., 2013; Gupta et al., 2014) [10,6] . For cob yield without husk, Integrated Nutrient Management (INM) positively influenced all treatments compared to Treatment T 1 (100% Farmers' fertilizer practice), with Treatment T 7 showing the highest result (2.56 t ha -1 ), statistically similar to Treatment T 6 (2.48 t ha -1 ). The minimum yield was found in Treatment T 1 (1.29 t ha -1 ). The significant increase in cob yield without husk under these treatments was due to improvements in yield components such as cob length, cob girth, and the number of cobs per plant. The enhancement of yield might be attributed to the effective utilization of applied nutrients, better assimilation of photosynthates, and their efficient translocation from source to sink, resulting in an overall yield improvement and a beneficial effect on soil properties (Lone et al., 2013) [10] . Fodder yield was also influenced by the INM approach. The maximum fodder yield was observed in Treatment T 7 (35.59 t ha), which was statistically similar to Treatment T 6 (34.76 t ha - 1 ), while Treatment T 1 showed the minimum fodder yield (24.50 t ha -1 ). The integrated application of organic and inorganic nutrient sources may have increased the protoplasmic constituents and accelerated cell division and elongation processes, leading to increased growth attributes and fodder yields (Lone et al., 2013) [10] .
Nutrient uptake
In the experiment, it was found that Treatment T 7 recorded the maximum uptakes of N, P, and K (N-200.33 kg ha -1 , P-65.33 kg ha -1 , K-118.76 kg ha -1 ), which was statistically similar to Treatment T 6 (N-199 kg ha -1 , P-65 kg ha -1 , K-118.46 kg ha -1 ). The increase in nutrient availability led to higher nutrient uptake. The minimum uptake was registered by the plants under Treatment T 1 (N-135.33 kg ha -1 , P-46 kg ha -1 , K-85.46 kg ha -1 ).
Accelerated growth in terms of dry matter production (DMP) and N content augmented more N uptake in crops (Bharathi et al., 2020) [1] . The higher uptake of N, P, and K with the combined application of organic and inorganic sources of nutrients, compared to inorganic sources alone, was attributed to proportionate increases in dry matter production and total biological yield, ultimately resulting in increased total nutrient uptake (Bharathi et al., 2020) [1] .
Soil nutrient status after harvest
After the harvest of baby corn, the residual soil fertility was evaluated at a soil depth of 0-15 cm. In terms of soil organic carbon percentage, no significant difference was found among the treatments. Due to the addition of organic matters such as FYM and green manure, all the treatments showed an increase in organic carbon content, except for treatment T 1 , which remained at the initial level (before sowing). However, after harvest, the maximum soil nitrogen was available in treatment T 1 (254.3 kg ha -1 ), while the minimum was in treatment T 7 (140.2 kg ha -1 ). In the plots that received organic manures, microbiological activities were high, resulting in increased plant nutrient availability. The lower level of soil available nitrogen after harvest in treatment T 7 was due to greater uptake of nitrogen by the crop.
No significant variation was found among the treatments with respect to residual phosphorus. However, an increasing trend was observed in all treatments compared to the initial soil phosphorus levels. During the decomposition of organic manures, various phenolic and aliphatic acids are produced. These acids help solubilize phosphatase and other phosphatebearing minerals, reducing phosphate fixation and increasing its availability in the soil. After harvest, the highest available potassium was recorded in treatment T 1 (254.3 kg ha -1 ), while the lowest was observed in treatment T 7 (140.2 kg ha -1 ). [10] .
Conclusion
Throughout the experiment, it was observed that the application of FYM at 20 t ha -1 along with RDF significantly enhanced the growth attributes, yield attributes, and associated parameters of baby corn compared to conventional practices. This treatment tremendously affected plant height, leaf area index, dry matter accumulation, crop growth rate, and significantly increased the number of cobs per plant, cob length, cob girth, cob yield, and nutrient uptake by the crops in a positive manner. In soil fertility evaluation, an improvement in organic carbon content and nutrient availability was found, particularly in treatments incorporating organic sources of nutrients. Economic analysis demonstrated higher gross and net returns with Integrated Nutrient Management, with the highest returns recorded in the treatment combining RDF with 15 t ha -1 FYM. This study underscores the efficacy of Integrated Nutrient Management, specifically RDF combined with Farm Yard Manure, for achieving superior yields, economic benefits, and enhanced nutrient uptake of baby corn in the rabi season within the new alluvial zone of West Bengal. Adoption of such practices not only ensures higher productivity but also contributes to long-term soil health and sustainability.
Figures and tables from the paper
| Treatments | Plant height (cm) | — | — |
|---|---|---|---|
| 20 DAS | 40 DAS | 60 DAS | |
| T1-Farmers’ Fertilizer practice (120:60:40 kg N: P2O5:K 2O ha-1) | 30.71 | 119.08 | 209.53 |
| T2- RDF (150:60:40 kg N: P2O5:K2O ha-1) | 33.81 | 121.59 | 212.97 |
| T3- RDF + Green Manuring (Dhaincha) | 36.90 | 123.84 | 213.72 |
| T4- RDF + 5 t ha-1 FYM | 38.08 | 130.48 | 222.50 |
| T5- RDF + 10 t ha-1 FYM | 42.32 | 134.13 | 225.50 |
| T6- RDF + 15 t ha-1 FYM | 46.69 | 140.07 | 230.07 |
| T7- RDF + 20 t ha-1 FYM | 46.81 | 141.02 | 231.11 |
| SEm (±) | 0.23 | 0.53 | 0.63 |
| CD at 5% | 0.72 | 1.65 | 1.97 |
Table text extracted from the original PDF; superscript letters are shown inline. The original table image is below.
View original table image
| Treatments | Leaf Area Index (LAI) | — | — |
|---|---|---|---|
| 20 DAS | 40 DAS | 60 DAS | |
| T1-Farmers’ Fertilizer practice (120:60:40 kg N: P2O5:K2O ha-1) | 0.73 | 2.16 | 3.89 |
| T2- RDF (150:60:40 kg N: P2O5:K2O ha-1) | 0.82 | 2.18 | 4.26 |
| T3- RDF + Green Manuring (Dhaincha) | 0.86 | 2.22 | 4.31 |
| T4- RDF + 5 t ha-1 FYM | 0.93 | 2.27 | 4.71 |
| T5- RDF + 10 t ha-1 FYM | 0.95 | 2.27 | 4.73 |
| T6- RDF + 15 t ha-1 FYM | 0.97 | 2.40 | 4.83 |
| T7- RDF + 20 t ha-1 FYM | 0.98 | 2.41 | 4.85 |
| SEm (±) | 0.008 | 0.031 | 0.02 |
| CD at 5% | 0.02 | 0.09 | 0.08 |
Table text extracted from the original PDF; superscript letters are shown inline. The original table image is below.
View original table image
| Treatments | Dry matter accumulation (g m-2) | — | — |
|---|---|---|---|
| 20 DAS | 40 DAS | 60 DAS | |
| T1-Farmers’ Fertilizer practice (120:60:40 kg N: P2O5:K2O ha-1) | 68.13 | 442.23 | 657.33 |
| T2- RDF (150:60:40 kg N: P2O5:K2O ha-1) | 70.46 | 448.27 | 689.43 |
| T3- RDF + Green Manuring (Dhaincha) | 79.44 | 514.27 | 763 |
| T4- RDF + 5 t ha-1 FYM | 84.36 | 520.81 | 791.33 |
| T5- RDF + 10 t ha-1 FYM | 89.18 | 528.89 | 805.33 |
| T6- RDF + 15 t ha-1 FYM | 97.58 | 563.53 | 883.41 |
| T7- RDF + 20 t ha-1 FYM | 98.97 | 565.59 | 901 |
| SEm (±) | 0.607 | 2.30 | 16.13 |
| CD at 5% | 1.87 | 7.09 | 49.7 |
Table text extracted from the original PDF; superscript letters are shown inline. The original table image is below.
View original table image
| Treatments | CGR (g m-2 day-1) | — |
|---|---|---|
| 20-40 DAS | 40-60 DAS | |
| T1-Farmers’ Fertilizer practice (120:60:40 kg N: P2O5:K2O ha-1) | 18.7 | 10.76 |
| T2- RDF (150:60:40 kg N: P2O5:K2O ha-1) | 18.89 | 12.06 |
| T3- RDF + Green Manuring (Dhaincha) | 21.74 | 12.44 |
| T4- RDF + 5 t ha-1 FYM | 21.82 | 13.53 |
| T5- RDF + 10 t ha-1 FYM | 21.99 | 13.82 |
| T6- RDF + 15 t ha-1 FYM | 23.30 | 15.99 |
| T7- RDF + 20 t ha-1 FYM | 23.33 | 16.77 |
| SEm (±) | 0.11 | 0.81 |
| CD at 5% | 0.36 | NS |
Table text extracted from the original PDF; superscript letters are shown inline. The original table image is below.
View original table image
| Treatments | No. of cobs/plant | Cob length (cm) | Cob girth (cm) |
|---|---|---|---|
| T1-Farmers’ Fertilizer practice (120:60:40 kg N: P2O5:K2O ha-1) | 1.52 | 6.75 | 1.2 |
| T2- RDF (150:60:40 kg N: P2O5:K2O ha-1) | 1.63 | 7.01 | 1.24 |
| T3- RDF + Green Manuring (Dhaincha) | 1.67 | 7.34 | 1.24 |
| T4- RDF + 5 t ha-1 | 1.71 | 7.42 | 1.28 |
| T5- RDF + 10 t ha-1 FYM | 1.92 | 7.86 | 1.30 |
| T6- RDF + 15 t ha-1 FYM | 2.04 | 8.22 | 1.35 |
| T7- RDF + 20 t ha-1 FYM | 2.06 | 8.59 | 1.45 |
| SEm (±) | 0.04 | 0.15 | 0.02 |
| CD at 5% | 0.13 | 0.48 | 0.08 |
Table text extracted from the original PDF; superscript letters are shown inline. The original table image is below.
View original table image
| Treatments | Baby corn yield with husk (t ha-1) | Baby corn yield without husk (t ha-1) | Fodder Yield (t ha-1) |
|---|---|---|---|
| T1-Farmers’ Fertilizer practice (120:60:40 kg N: P2O5:K2O ha-1) | 4.31 | 1.29 | 24.50 |
| T2- RDF (150:60:40 kg N: P2O5:K2O ha-1) | 4.40 | 1.36 | 25.56 |
| T3- RDF + Green Manuring (Dhaincha) | 4.71 | 1.40 | 28.51 |
| T4- RDF + 5 t ha-1 FYM | 5.09 | 1.52 | 31.46 |
| T5- RDF + 10 t ha-1 FYM | 5.5 | 1.9 | 32.65 |
| T6- RDF + 15 t ha-1 FYM | 5.85 | 2.48 | 34.76 |
| T7- RDF + 20 t ha-1 FYM | 6.01 | 2.56 | 35.59 |
| SEm (±) | 0.056 | 0.028 | 0.65 |
| CD at 5% | 0.17 | 0.08 | 2.00 |
Table text extracted from the original PDF; superscript letters are shown inline. The original table image is below.
View original table image
| Treatments | N uptake (Kg ha-1) | P2O5 uptake (Kg ha-1) | K2O uptake (Kg ha-1) |
|---|---|---|---|
| T1-Farmers’ Fertilizer practice (120:60:40 kg N: P2O5:K2O ha-1) | 135.33 | 46 | 85.64 |
| T2- RDF (150:60:40 kg N: P2O5:K2O ha-1) | 145.67 | 46.33 | 90.52 |
| T3- RDF + Green Manuring (Dhaincha) | 153.67 | 48.67 | 96.47 |
| T4- RDF + 5 t ha-1 FYM | 163.33 | 59.67 | 98.62 |
| T5- RDF + 10 t ha-1 FYM | 178 | 62.33 | 99.58 |
| T6- RDF + 15 t ha-1 FYM | 199 | 65 | 118.46 |
| T7- RDF + 20 t ha-1 FYM | 200.33 | 65.33 | 118.76 |
| SEm (±) | 0.45 | 0.45 | 0.56 |
| CD at 5% | 1.38 | 1.40 | 1.72 |
Table text extracted from the original PDF; superscript letters are shown inline. The original table image is below.
View original table image
| Treatments | Soil Organic carbon (%) | Soil available N (Kg ha-1) | Soil available P2O5 (Kg ha-1) | Soil available K2O (Kg ha-1) |
|---|---|---|---|---|
| T1-Farmers’ Fertilizer practice (120:60:40 kg N: P2O5:K2O ha-1) | 0.59 | 185.73 | 45.52 | 254.3 |
| T2- RDF (150:60:40 kg N: P2O5:K2O ha-1) | 0.61 | 177.26 | 44.67 | 245.5 |
| T3- RDF + Green Manuring (Dhaincha) | 0.62 | 175.42 | 44.13 | 238.3 |
| T4- RDF + 5 t ha-1 FYM | 0.63 | 171.87 | 43.76 | 168.7 |
| T5- RDF + 10 t ha-1 FYM | 0.64 | 159.72 | 43.42 | 157.6 |
| T6- RDF + 15 t ha-1 FYM | 0.64 | 148.67 | 42.90 | 150.8 |
| T7- RDF + 20 t ha-1 FYM | 0.65 | 134.26 | 42.61 | 140.2 |
| SEm (±) | 0.02 | 8.66 | 1.10 | 7.76 |
| CD at 5% | NS | 25.50 | NS | 20.56 |
Table text extracted from the original PDF; superscript letters are shown inline. The original table image is below.
View original table image
| Treatments | Cost of cultivation (Rs. ha-1) | Gross return (Rs. ha-1) | Net return (Rs. ha-1) | B:C |
|---|---|---|---|---|
| T1- Farmers’ Fertilizer practice (120:60:40 kg N:P2O5:K2O ha-1) | 60961 | 204603.45 | 143642.25 | 3.36 |
| T2- RDF (150:60:40 kg N:P2O5:K2O ha-1) | 61350 | 214204.37 | 152854.37 | 3.49 |
| T3- RDF + Green Manuring (Dhaincha) | 63350 | 225426.00 | 162076.00 | 3.56 |
| T4- RDF + 5 t ha-1 FYM | 71350 | 246288.44 | 174938.44 | 3.45 |
| T5- RDF + 10 t ha-1 FYM | 81350 | 292519.71 | 211169.71 | 3.60 |
| T6- RDF + 15 t ha-1 FYM | 91350 | 367325.57 | 275975.57 | 4.02 |
| T7- RDF + 20 t ha-1 FYM | 101350 | 378938.52 | 277588.52 | 3.74 |
| SEm (±) | - | 3095.24 | 3095.24 | 0.035 |
| CD at 5% | - | 9536.763 | 9536.76 | 0.11 |
Table text extracted from the original PDF; superscript letters are shown inline. The original table image is below.
View original table image
References
14 in the original paper- Barik AK, Karmakar M, Ghorai SK. Studies on the effect of crop geometry and nutrient management on productivity and economics of baby corn and cowpea (fodder) intercropping system. Int J Bioresour Stress Manag. 2016;7(2):305-309.
- Das S, Yadav VK, Jat ML, Asha K, Sujay R, Jyoti K, Sekhar JC. Baby corn in India. DMR Technical Bulletin. 2008;(1-45). Directorate of Maize Research, Pusa Campus, New Delhi.
- Dadarwal RS, Jain NK, Singh D. Integrated Nutrient Management in Baby Corn (Zea mays). Indian J Agric Sci. 2009;79(12):1023-1025.
- Gupta V, Sharma A, Kumar J, Abrol V, Singh B, Singh M. Effects of integrated nutrient management on growth, yield of crops and availability on growth and yield of Maize (Zea mays)-Gobhi sarson Brassica napus L. cropping system in sub-tropical region under foothills of north-west Himalaya. Bangladesh J Bot. 2014;43(2):147-155.
- Hussain A. Effect of different combinations of organic and inorganic nutrients on productivity and profitability of baby corn varieties in Kashmir Valley. Ph.D. thesis, Sher-eKashmir University of Agricultural Sciences & Technology of Kashmir, Division of Agronomy, Shalimar Campus, Srinagar; 2014. Pp. 190 025.
- Jinjala VR, Virdia HM, Saravaiya NN, Raj AD. Effect of integrated nutrient management on baby corn (Zea mays). Agric Sci Digest. 2016;36(4):291-294.
- Lone AA, Allai BA, Nehvi FA. Growth, yield and economics of baby corn (Zea mays L.) as influenced by Integrated Nutrient Management (INM) Practices. Afr J Agric Res. 2013;8(37):4537-4540.
- Mahapatra A, Barik AK, Mishra AK. Integrated Nutrient Management Baby Corn (Zea mays L.). Int J Bio-resour Stress Manag. 2018;9(1):044-048.
- Pandey AK, Mani VP, Prakash V, Singh RD, Gupta HS. Effect of varieties and plant densities on yield, yield attributes and economics of baby corn (Zea mays). Indian J Agron. 2002;47:221-226.
- Ramachandrappa BK, Nanjappa IIV, Shivkumar IIK. Yield and quality of baby corn (Zea mays L.) as influenced by spacing and fertilization levels. Acta Agron Hung. 2004;52:237-243.
- Rasool S, Kanth RH, Hamid S, Raja W, Alie BA, Dar ZA. Influence of Integrated nutrient management on growth and yield of sweet corn (Zea mays L. Saccharata) under temperate conditions of Kashmir valley. Am J Exp Agric. 2015;7(5):315-325.
- Singh G, Singh N, Kaur R. Integrated nutrient management for increasing growth with sustainability of baby corn. Int J Bioassay. 2016;5(2):4817-482.
- Thavaprakaash N, Velayudham K, Muthukumar VB. Effect of cropgeometry, intercropping system and integrated nutrient management practices on productivity of baby corn (Zea mays L.) based intercropping systems. Res. J Agric. Biol. Sci. 2005;1:295-302.
- Thavaprakash N, Velayudham K. Effect of crop Geometry, Intercropping systems and INM practices on cob yield and nutrient uptake of baby corn. Asian J Agric Res. 2007;1(1):10-16.