
Research article · 2024 · Full text
International Journal of Research in AgronomyIntegrated nutrient management on growth and yield of mustard (Brassica juncea L.) in central alluvial tract of Uttar Pradesh
Volume 7(6S) · Pages 567–571 · DOI: 10.33545/2618060x.2024.v7.i6sh.957 ↗
Research areasAgricultural Science and FertilizationNitrogen and Sulfur Effects on BrassicaPlant Micronutrient Interactions and Effects
Abstract
Author-writtenA field experiment was conducted during Rabi season 2023-24 as carried out at Agricultural farm of Rama University, Mandhana, Kanpur. Nine treatments were tested in three replicated Randomized Block Design. Result found that significantly better growth and yield attributes and grain yield (18.89 q/ha) was obtained with treatment T6 75% RDF + 2.5 t/ha vermicompost + PSB over rest of the treatments. The minimum grain yield (10.05q/ha) was received in treatment T1 control (RDF 3:2:1 NPK). The application of 75% RDF + 2.5 t/ha vermicompost + PSB was also found significantly higher gross income (Rs 79432) and net profit (Rs45331) over rest of the treatments. While Benefit: Cost ratio was significantly higher (1.32) with application of 75% RDF + 2.5 t/ha vermicompost + PSB over rest of the treatments. The minimum gross income (Rs 42273) was received in treatment T1 control (RDF 3:2:1 NPK) while the minimum net income and B: C ratio was found in treatment T1 control RDF 3:2:1 NPK).
Summary
Source-checkedPlain-language reading of the full paper, prepared with AI and checked against the text. Each point links to the authors' own words.
Why it matters
- Mustard (Brassica juncea L.) is a significant oilseed crop grown during the Rabi (winter) season. View evidence ↗
- Integrated nutrient management (INM) is considered essential for both increasing crop yields and improving overall soil health. View evidence ↗
- India's average rapeseed and mustard yield of 1490 kg/ha is lower than the global average of 1990 kg/ha. View evidence ↗
The question
- The study aimed to evaluate the effects of nine different integrated nutrient management treatments on the growth and yield of mustard during the 2023-24 Rabi season. View evidence ↗
What they did
- The experiment used a Randomized Block Design with nine treatments, including various combinations of Recommended Dose of Fertilizers (RDF), vermicompost (2.5 t/ha), and Phosphate Solubilizing Bacteria (PSB). View evidence ↗
- Nutrients were supplied using Urea, SSP, and MOP at rates of 80, 40, and 20 kg/ha for nitrogen, phosphorus, and potassium, respectively. View evidence ↗
What they found
- Treatment T6 (75% RDF + 2.5 t/ha vermicompost + PSB) produced the highest grain yield at 18.89 q/ha, significantly outperforming other treatments. View evidence ↗
- The lowest grain yield of 10.05 q/ha was recorded in the T1 control group (RDF 3:2:1 NPK). View evidence ↗
- The highest seed yields were observed in treatments T6 and T7, reaching 18.89 and 17.41 q/ha respectively. View evidence ↗
- Stover yield was highest in treatments T6 and T7, with values of 47.17 and 43.61 q/ha. View evidence ↗
- The highest Benefit:Cost ratio of 1.32 was achieved using treatment T6. View evidence ↗
- The maximum number of siliquae per plant was found in treatments T6 (297.67) and T7 (288.03). View evidence ↗
What it means
- The authors recommend treatment T6 (75% RDF + 2.5 t/ha vermicompost + PSB) to achieve higher yields and net returns in mustard cultivation. View evidence ↗
Visual summary
3 visualsIllustrations explain the paper; charts are replotted from the paper's own table values.
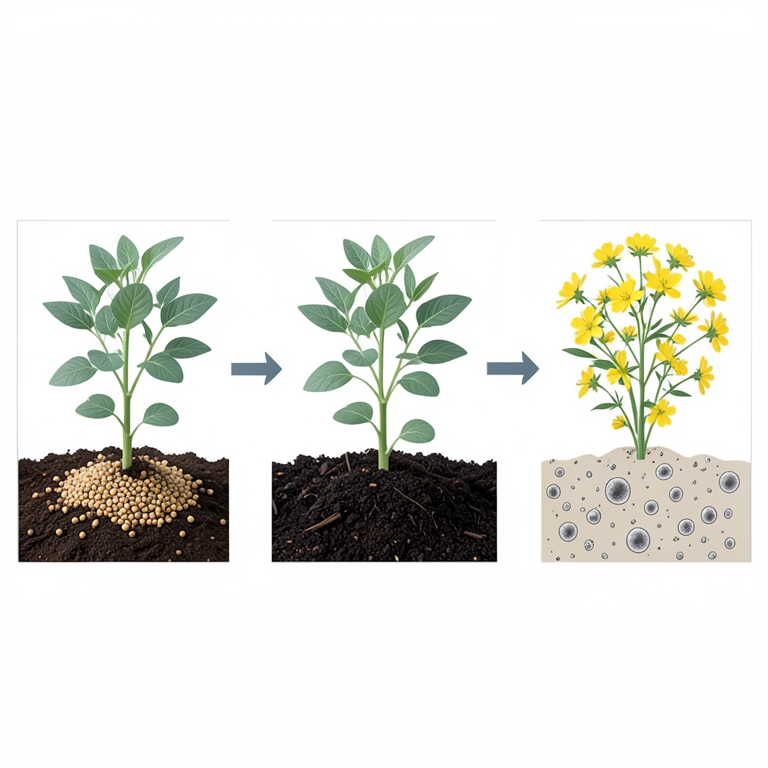
Nutrient Treatment Combinations
AI-generated conceptual illustration (mustard plants (Brassica juncea L.)). It explains the idea and does not show study data.
View source evidence ↗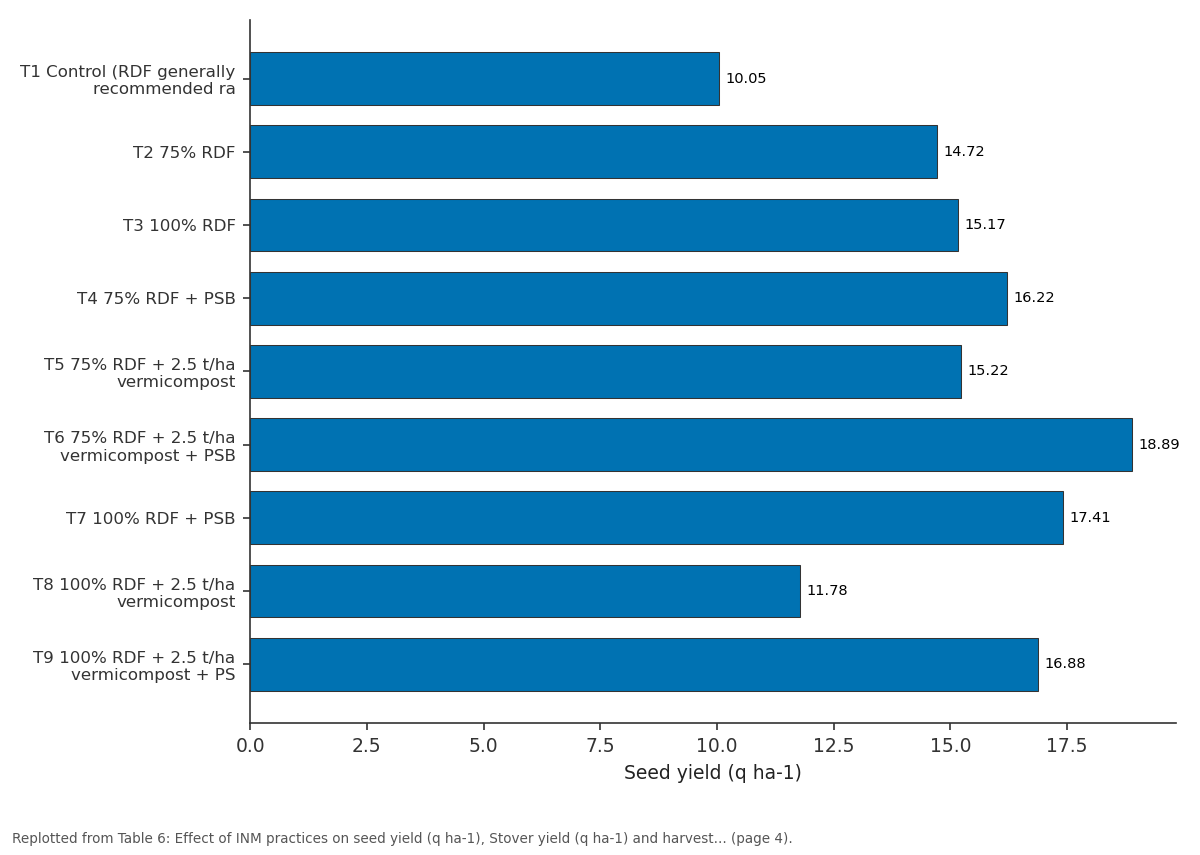
Seed yield (q ha-1) / 2023-24: T1 Control (RDF... vs T2 75% RDF vs T3 100% RDF vs T4 75% RDF + PSB vs T5 75% RDF + 2.5 t/ha...
Replotted from Table 6 (page 4) of the original paper. Every bar is the paper's own table value.
View source evidence ↗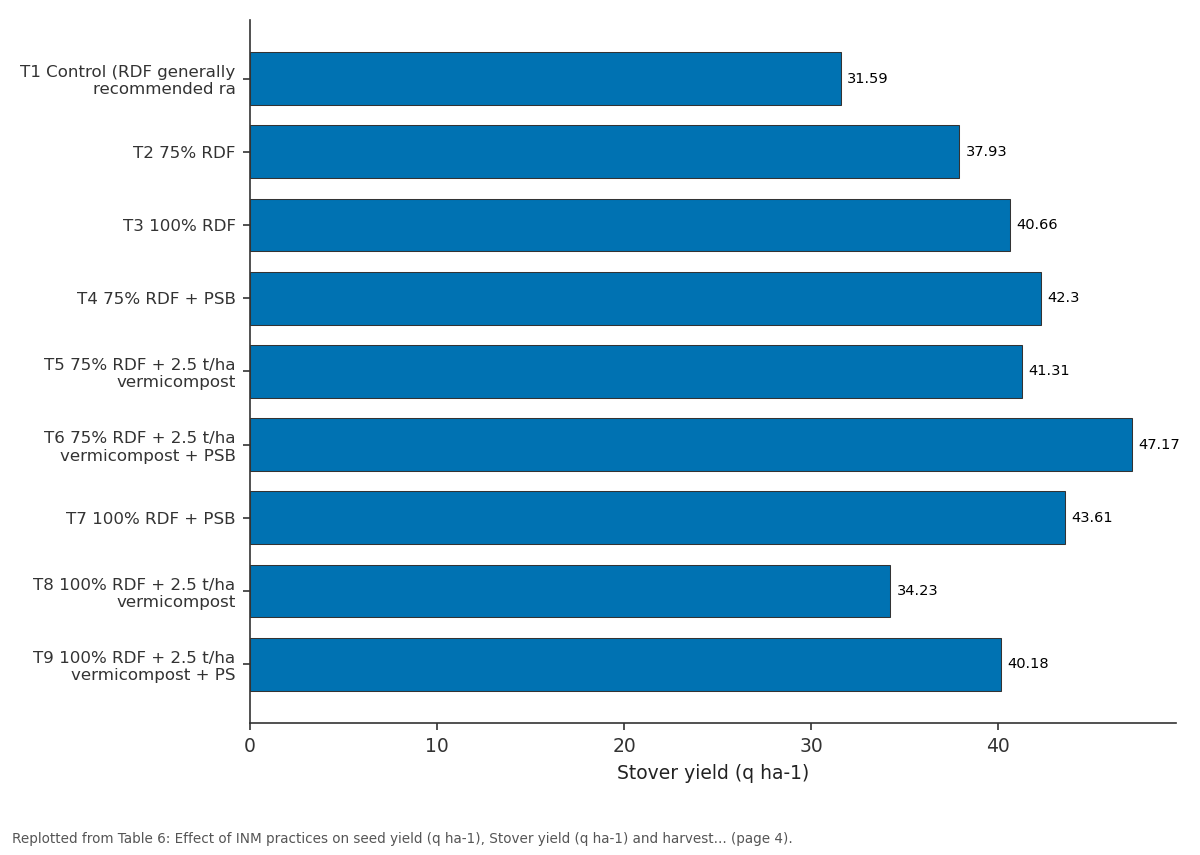
Stover yield (q ha-1) / 2023-24: T1 Control (RDF... vs T2 75% RDF vs T3 100% RDF vs T4 75% RDF + PSB vs T5 75% RDF + 2.5 t/ha...
Replotted from Table 6 (page 4) of the original paper. Every bar is the paper's own table value.
View source evidence ↗Figures & tables
From the original paper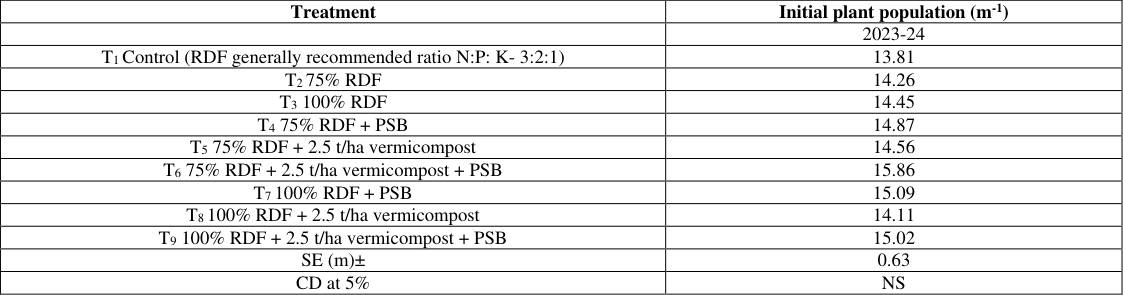 Table 1
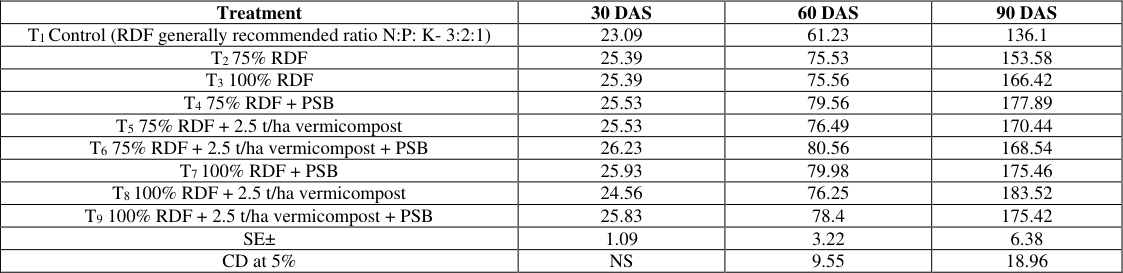 Table 2
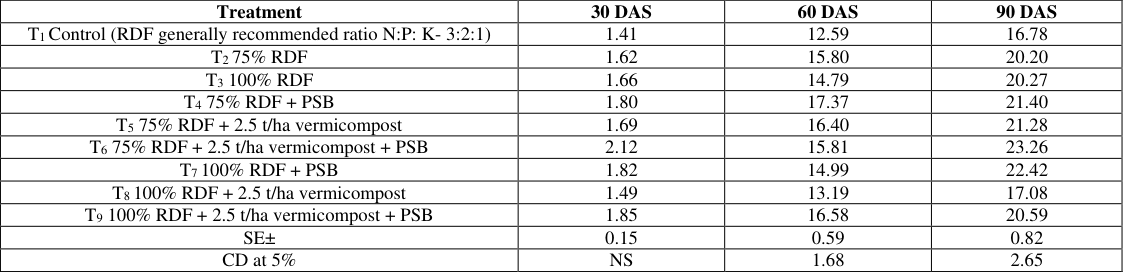 Table 3
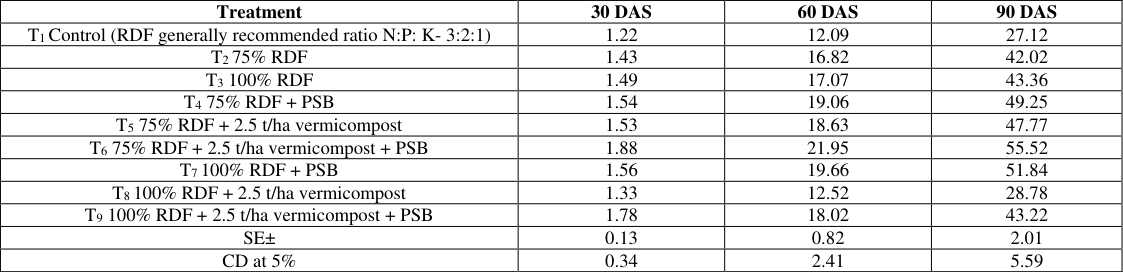 Table 4
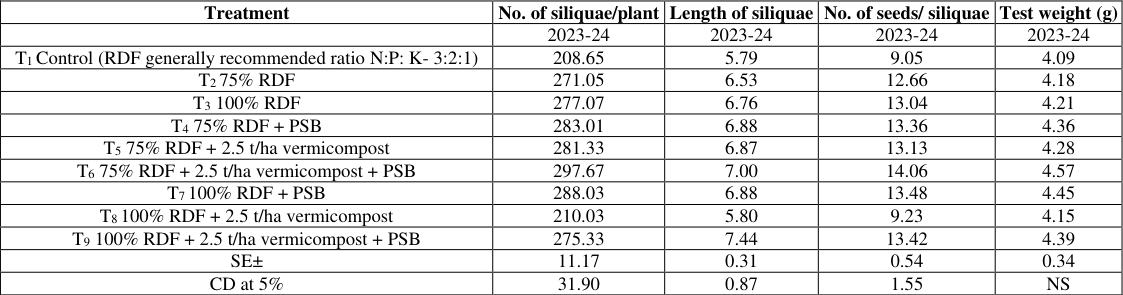 Table 5
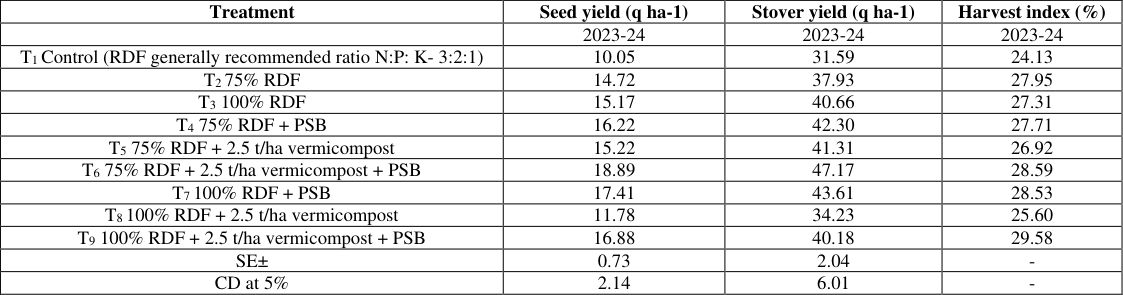 Table 6
Introduction
Mustard [Brassica juncea (L.)] is important Rabi oilseed crop which belongs to family "Cruciferae". The oil content in mustard seeds varies from 37-49 percent (Bhowmik et al., 2014) [18] , the seeds are highly nutritive containing 38-57% erucic acid, and 27% oleic acid. The oil cake left after extraction is utilized as cattle feed and manure containing 5.1% N, 1.8% P 2 O 5 and 1.1% K 2 O. This is a potential crop in winter (Rabi) season due to its wider adaptability and suitability to exploit residual moisture (Mukherjee, 2010) [8] . Adoption of appropriate nutrient management strategy hold a great potential in boosting the field of mustard in a suitable manner. Therefore, integrated nutrient management crucial not only for increasing the yield but also for the improvement of soil health. Rapeseed mustard crops are economically important as source of edible oil in human diet. In India area, production, productivity was 8.5 million hectares, 12.6 million tonnes and 1490 kg/ha, respectively during 2023-24 (DA&FW). India is one of the largest oilseeds producing country that covers one fifth of the entire area under this group of crops and also yields one-fifth of the total oilseed production in the world. Globally, rapeseed mustard is grown by more than sixty nations including India. In terms of average yield, India (1490 kg/ha) below the world average yield (1990 kg/ha) of rapeseed and mustard. In India, it is cultivated by more than 26 states (including Union Territories) with Rajasthan, Madhya Pradesh, Uttar Pradesh, Haryana and West Bengal being that major player in terms of area and production of rapeseed-mustard (DRMR (2020) and DOD (2020). Integrated nutrient management (INM) is an approach in which inorganic and organic manures applied together to improve the soil fertility. Integrated nutrient management is vital for sustainable productivity (Verma et al., 2010) [19] but also improves soil physical, chemical and biological properties there by prevent environmental degradation. Balanced nutrient application through combined use of inorganic fertilizers, organic manures and bio-fertilizers makes possible profitable and sustainable crop production and also maintain soil properties.
As organic manures is not only supply the nutrient to the plant but also they act as soil conditioner and improves soil fertility. In concept of the INM, organic manure used as a complementary for the improvement of the soil. Several studies showed that the beneficial effect of INM on crop and soil productivity. However, these studies mostly concentrated on the single crops and dearth of literature on the cropping system mode in general particularly for pulse and oilseed based cropping system.
Materials and Methods
The field experiment was carried out during Rabi season of 2023-24 at the Agricultural Research Farm of Rama University Kanpur. The soil was sandy loam of the experimental field having organic carbon 0.32%, total nitrogen 139.9 kg /ha, available P 2 O 5 15.56 kg/ha, available K 2 O250.25 kg/ha, pH 8.23, E. C.-0.34 ds/m, field capacity 20.70%, porosity 46.03%, particle density 2.52 g/cc, bulk density 1.36 g/cc. The 9 treatments viz: T 1 : control (3:2:1 NPK), T 2 : 75% RDF, T 3 : 100% RDF, T 4 : 75% RDF+PSB, T 5 : 75% RDF + 2.5 t/ha vermicompost, T 6 : 75% RDF + 2.5 t/ha vermicompost + PSB, T 7 : 100% RDF + PSB, T 8 : 100% RDF + 2.5 t/ha vermicompost, T 9 : 100% RDF + 2.5 t/ha vermicompost + PSB, were replicated three times in Randomized Block design. Vermicompost and PSB together and applied according to the treatment by broadcasting in experimental field and soil mixed properly by hand based on treatments required one day before sowing. Line sowing done by hand. The mustard variety used for sowing was Varuna (T-59). Spacing 45 cm row to row and 15cm plant to plant, seed rate used 5kg /ha, mustard sowing date 20-10-23. The nitrogen phosphorus and potassium were applied through Urea, SSP and MOP @ 80, 40, 20 kg/ha, respectively as per experiment. The half quantity of N, full quantity of P 2 O 5 andfull quantity of K 2 O was applied as basal dos. Remaining half dose of N is applied as top dressing in two split doses ½ one day before irrigation and ½ after 2 nd irrigation.Two irrigation were applied, first irrigation 25 DAS and second at 30 DAS. The simultaneous thinning and weeding by manual labour was done 20 DAS, during the experiment average temperature ranged between maximum 35.8 °C and minimum 5.1 °C, the average relative humidity ranged between 67% to 96%, the crop is harvested at physiological maturity on 26-03-24.
Results and Discussion
Growth of plant can be measured vertically in terms of plant population, plant height, number branches plant-1 and horizontally in terms of dry matter accumulation etc. The data pertaining to plant population at 30 days after sowing of mustard as affected by different nutrients management levels have been presented in Table 1. Varying levels of nutrients had not significant effect on the plant population at 30 DAS of mustard crop, however maximum number of plants population found with the treatment T 6 -T 9 respective years 2023-24. Although the lowest plant population were found with the treatment T 1 Control (RDF+ NPK-3:2:1) years, respective. At 60 DAS and at the harvest stage the plant height of mustard crop is presented in table 2. Plant height increased progressively with increase in duration of mustard crop. Crop growth rate was maximum up to 60 DAS and thereafter, a slow increase in growth was obtained up to harvest. The plant height was significantly influenced by the various INM. The maximum plant height at 30 DAS and 60 DAS, was recorded with treatment T 6 -T 7 and at harvest tallest plant height was recorded under the treatment T 8 -T 4 . It was significantly superior with T 8 and statistically at par rest over the treatments the minimum plant height at all the stages was recorded in the treatment T 1 -Control (RDF+NPK). However, higher plant height at T 6 was due to lower weed density during initial stage which was critical period of crop life cycle Similar finding were also reported by (Mukherjee et al. 2014,) [9] . Therefore, no more competition between crop was observed for nutrients, moisture, space and (Gupta et al. 2019) [4] . The number of branches plant -1 was significantly influenced by various INM at all the growth stages except 30 DAS during the years (Table 3). The maximum numbers of branches plant-1at 60 DAS were recorded under the treatment T 4 -T 9 . The minimum number of branches was recorded in the control T 1 (RDF+NPK) treatment at all the stages. INM practices increased the uptake of nutrients which had possibly contributed to more vegetative growth. The favourable synthesis of growth promoting constituents in plant system owing to better supply of nutrients. Resulted in higher number of branches. The results are in conformity with those of (Tetarwal et al. 2013 and Gupta et al. 2019) [15,4] . The maximum dry matter accumulation plant-1 at all the growth stages except 30 DAS. Besides treatment T 6 -T 9 which was significantly superior over rest of the treatment in 2023-24, It also moderates soil temperature which results in reduced number of irrigations (Dubey, 2018, Pandey et al. 2019) [3, 10] . At 60 DAS and harvest stage the highest dry matter accumulation plant-1 was recorded where treatment T 6 -T 7 . This was statistically at par with T 6 , and T 7 and significantly superior over rest of the treatment during the years of experimentation. The higher dry matter accumulation of plant in these treatments was due to higher plant height (Table 2). These results are in tune with (Tetarwal et al. 2013, and Pandey et al. 2019) [15,10] . Yield of any crop is generally based on two major factors i.e. yield plant-1 and plant population per unit area. Further, the yield per plant in mustard is affected by several plant characters such as number of branches plant-1, number of siliquae plant-1, length of siliquae, number of seeds siliquae-1 and test weight etc. Regarding the number of siliquae plant-1 , the highest number of siliquae was recorded due to the T 6 -T 7 (297.67 and 288.03). Number of siliquae was directly with number of branches, since these treatments had the greater number of branches plant-1, resulted in a greater number of siliquae in different treatments (Table 5). As far as the 1000-seed weight or test weight was concerned, it was affected significantly due to different INM treatments. As far as the 1000-seed weight or test weight was concerned, it was not affected significantly due to different INM treatments. However, higher test weight was recorded with treatment T 6 -T 7 d uring the years but nonsignificant differences were noted due to different INM treatments. The minimum values of the entire yield attributes were observed in the treatment T 1 received lower amount of nutrients in treatment T 1 control because plants could not absorb required amount of nutrients and resulted in poor yield attributes (Gupta et [4,10,14] . Yield is the ultimate resultant of the bio-physiological process which coordinated interplay of growth characters and yield attributes. Seed and stover yields were influenced significantly by applying various INM. (Table 6). The highest seed yield of mustard (18.89 and 17.41 q ha -1 ) was recorded under the treatment T 6 -T 7 . This was statistically at par with T 6 and significantly superior rest over the treatments in the respective years of 2023-4. The highest stover yield of mustard (47.17 and 43.61 q ha-1) was recorded under treatment T 6 -T 7 . Significantly lowest seed and stover yields were found under treatment T 1 -control (RDF+NPK) during the years. Similar results also reported by (Singh et al. 2020) [14] . The highest harvest index (29.90 and 28.59%) was recorded under the treatment T 9 -T 6 during the years. The harvest index speaks the conversion efficiency of non-seed portion by turning up nutrient uptake as well as utilization. Lower stover yield in proportion to grain associated under above treatments increased the values of harvest index (Table 6). This was due to adequate nutrients availability and less competition for moisture, nutrients and light to crop (Chauhan et al. 2005, Mukherjee, 2014) [2,8] .
| Treatment | Seed yield (q ha-1) | Stover yield (q ha-1) | Harvest index (%) |
|---|---|---|---|
| 2023-24 | 2023-24 | 2023-24 | |
| T1 Control (RDF generally recommended ratio N:P: K- 3:2:1) | 10.05 | 31.59 | 24.13 |
| T2 75% RDF | 14.72 | 37.93 | 27.95 |
| T3 100% RDF | 15.17 | 40.66 | 27.31 |
| T4 75% RDF + PSB | 16.22 | 42.30 | 27.71 |
| T5 75% RDF + 2.5 t/ha vermicompost | 15.22 | 41.31 | 26.92 |
| T6 75% RDF + 2.5 t/ha vermicompost + PSB | 18.89 | 47.17 | 28.59 |
| T7 100% RDF + PSB | 17.41 | 43.61 | 28.53 |
| T8 100% RDF + 2.5 t/ha vermicompost | 11.78 | 34.23 | 25.60 |
| T9 100% RDF + 2.5 t/ha vermicompost + PSB | 16.88 | 40.18 | 29.58 |
| SE± | 0.73 | 2.04 | - |
| CD at 5% | 2.14 | 6.01 | - |
Table text extracted from the original PDF; superscript letters are shown inline. The original table image is below.
View original table image
| Treatment | No. of siliquae/plant | Length of siliquae | No. of seeds/ siliquae | Test weight (g) |
|---|---|---|---|---|
| 2023-24 | 2023-24 | 2023-24 | 2023-24 | |
| T1 Control (RDF generally recommended ratio N:P: K- 3:2:1) | 208.65 | 5.79 | 9.05 | 4.09 |
| T2 75% RDF | 271.05 | 6.53 | 12.66 | 4.18 |
| T3 100% RDF | 277.07 | 6.76 | 13.04 | 4.21 |
| T4 75% RDF + PSB | 283.01 | 6.88 | 13.36 | 4.36 |
| T5 75% RDF + 2.5 t/ha vermicompost | 281.33 | 6.87 | 13.13 | 4.28 |
| T6 75% RDF + 2.5 t/ha vermicompost + PSB | 297.67 | 7.00 | 14.06 | 4.57 |
| T7 100% RDF + PSB | 288.03 | 6.88 | 13.48 | 4.45 |
| T8 100% RDF + 2.5 t/ha vermicompost | 210.03 | 5.80 | 9.23 | 4.15 |
| T9 100% RDF + 2.5 t/ha vermicompost + PSB | 275.33 | 7.44 | 13.42 | 4.39 |
| SE± | 11.17 | 0.31 | 0.54 | 0.34 |
| CD at 5% | 31.90 | 0.87 | 1.55 | NS |
Table text extracted from the original PDF; superscript letters are shown inline. The original table image is below.
View original table image
| Treatment | 30 DAS | 60 DAS | 90 DAS |
|---|---|---|---|
| T1 Control (RDF generally recommended ratio N:P: K- 3:2:1) | 1.41 | 12.59 | 16.78 |
| T2 75% RDF | 1.62 | 15.80 | 20.20 |
| T3 100% RDF | 1.66 | 14.79 | 20.27 |
| T4 75% RDF + PSB | 1.80 | 17.37 | 21.40 |
| T5 75% RDF + 2.5 t/ha vermicompost | 1.69 | 16.40 | 21.28 |
| T6 75% RDF + 2.5 t/ha vermicompost + PSB | 2.12 | 15.81 | 23.26 |
| T7 100% RDF + PSB | 1.82 | 14.99 | 22.42 |
| T8 100% RDF + 2.5 t/ha vermicompost | 1.49 | 13.19 | 17.08 |
| T9 100% RDF + 2.5 t/ha vermicompost + PSB | 1.85 | 16.58 | 20.59 |
| SE± | 0.15 | 0.59 | 0.82 |
| CD at 5% | NS | 1.68 | 2.65 |
Table text extracted from the original PDF; superscript letters are shown inline. The original table image is below.
View original table image
| Treatment | 30 DAS | 60 DAS | 90 DAS |
|---|---|---|---|
| T1 Control (RDF generally recommended ratio N:P: K- 3:2:1) | 23.09 | 61.23 | 136.1 |
| T2 75% RDF | 25.39 | 75.53 | 153.58 |
| T3 100% RDF | 25.39 | 75.56 | 166.42 |
| T4 75% RDF + PSB | 25.53 | 79.56 | 177.89 |
| T5 75% RDF + 2.5 t/ha vermicompost | 25.53 | 76.49 | 170.44 |
| T6 75% RDF + 2.5 t/ha vermicompost + PSB | 26.23 | 80.56 | 168.54 |
| T7 100% RDF + PSB | 25.93 | 79.98 | 175.46 |
| T8 100% RDF + 2.5 t/ha vermicompost | 24.56 | 76.25 | 183.52 |
| T9 100% RDF + 2.5 t/ha vermicompost + PSB | 25.83 | 78.4 | 175.42 |
| SE± | 1.09 | 3.22 | 6.38 |
| CD at 5% | NS | 9.55 | 18.96 |
Table text extracted from the original PDF; superscript letters are shown inline. The original table image is below.
View original table image
| Treatment | Initial plant population (m-1) |
|---|---|
| 2023-24 | |
| T1 Control (RDF generally recommended ratio N:P: K- 3:2:1) | 13.81 |
| T2 75% RDF | 14.26 |
| T3 100% RDF | 14.45 |
| T4 75% RDF + PSB | 14.87 |
| T5 75% RDF + 2.5 t/ha vermicompost | 14.56 |
| T6 75% RDF + 2.5 t/ha vermicompost + PSB | 15.86 |
| T7 100% RDF + PSB | 15.09 |
| T8 100% RDF + 2.5 t/ha vermicompost | 14.11 |
| T9 100% RDF + 2.5 t/ha vermicompost + PSB | 15.02 |
| SE (m)± | 0.63 |
| CD at 5% | NS |
Table text extracted from the original PDF; superscript letters are shown inline. The original table image is below.
View original table image
Conclusion
In conclusion on the basis of above findings it can be concluded that treatment T 6 [75% RDF + 2.5 t/ha vermicompost + PSB] shows the best results with respect to significant growth attributes, yield attributes and yield. From the economical point of view, the same treatment gave higher net profit (Rs 45331) over rest of the treatments. Benefit: Cost ratio was significantly higher (1.32) with in same treatment T 6 75% RDF + 2.5 t/ha vermicompost + PSB over rest of the treatments. Therefore treatment T 6 [75% RDF + 2.5 t/ha vermicompost + PSB] is recommended for higher net return and yield in mustard cultivation.
Figures and tables from the paper
| Treatment | 30 DAS | 60 DAS | 90 DAS |
|---|---|---|---|
| T1 Control (RDF generally recommended ratio N:P: K- 3:2:1) | 1.22 | 12.09 | 27.12 |
| T2 75% RDF | 1.43 | 16.82 | 42.02 |
| T3 100% RDF | 1.49 | 17.07 | 43.36 |
| T4 75% RDF + PSB | 1.54 | 19.06 | 49.25 |
| T5 75% RDF + 2.5 t/ha vermicompost | 1.53 | 18.63 | 47.77 |
| T6 75% RDF + 2.5 t/ha vermicompost + PSB | 1.88 | 21.95 | 55.52 |
| T7 100% RDF + PSB | 1.56 | 19.66 | 51.84 |
| T8 100% RDF + 2.5 t/ha vermicompost | 1.33 | 12.52 | 28.78 |
| T9 100% RDF + 2.5 t/ha vermicompost + PSB | 1.78 | 18.02 | 43.22 |
| SE± | 0.13 | 0.82 | 2.01 |
| CD at 5% | 0.34 | 2.41 | 5.59 |
Table text extracted from the original PDF; superscript letters are shown inline. The original table image is below.
View original table image
References
19 in the original paper- Bhalavi S, Sirothia P, Mishra A, Mishra US, Raghav RS, Singh OK, et al. Effect of Integrated Nutrient Management on Growth Parameters, Yield Attributes and Yield of Mustard Crop in Chitrakoot Area. Int. J Plant Soil Sci. 2023;35(21):343-348.
- Chauhan YS, Bhargava MK, Jain VK. Weed management in Indian mustard (Brassica juncea L.). Indian J Agron. 2005;50(2):149-151.
- Dubey S, Shukla G. Analysis of Integrated Nutrient Management as a performance enhancer in Mustard. Int. J Agric. Inven. 2020;5(2):300-305. ISSN: 2456-1797.
- Gupta S, Sharma PK, Kumar S, Sharma S, Singh P, Parashar A, et al. Study of chemical properties and growth parameters of Indian mustard [ Brassica juncea (L.) Czern and Coss.] Influenced by application of herbicides and fertilizers. Int. J Chem. Stud. 2019;7(3):3804-3807.
- Kaur G, Verma K. Effect of integrated nutrient management on mustard crop (Brassica juncea L.). Plant Arch. 2023;23(1):234-238.
- Kaur R, Kumar K. Growth, yield and quality of Indian mustard [Brassica juncea (L.) Czern. & Coss.] Influenced by Integrated nutrient management. J Med Plants Stud. 2022;10(4):205-210.
- Maurya S, Pandey MR, Verma AK. Integrated nutrient management of mustard (Brassica juncea L.) alluvial soil of Uttar Pradesh. Int. J Chem. Stud. 2020;8(1):1386-1389.
- Mukherjee D. Productivity, profitability and apparent nutrient balance under different crop sequence in mid-hill condition. Indian J Agric. Sci. 2010;80(5):420-422.
- Mukherjee D. Influence of weed and fertilizer management on yield and nutrient uptake in mustard. Indian J Weed Sci. 2014;46(3):251-255.
- Pandey D, Singh G, Kumar R, Rao A, Kumar M, Kumar A, et al. Effect of weed management practices on growth and yield of Indian mustard. J Pharmacogn. Phytochem. 2019;8(4):3379-3383.
- Sreerenjiny S, Debbarma V. Influence of Integrated Nutrient Management on Growth and Yield of Mustard (Brassica juncea L.). Int. J Plant Soil Sci. 2022;34(21):435442. Article no. IJPSS.89526. ISSN: 2320-7035.
- Sachan S, Thomas T, Yadav A. Integrated Plant Nutrient Management System for Mustard (Brassica juncea L.) Crop under Soil Test Crop Recommendation in Prayagraj Region. 2021;9:731-733. Print ISSN: 2393-8234.
- Singh D, Pal RK, Maurya NK. Response of integrated nutrient management on growth and yield of Indian mustard (Brassica juncea L.). Pharma Innov. J. 2023;12(6):46754679.
- Singh A, Yadav RS, Anshuman K, Kumar A, Patel VK, Singh AP, Singh RP. Effect of weed management practices on yield and economics in Indian mustard. Int. J Chem. Stud. 2020;8(2):1364-1367.
- Tetarwal JP, Ram BMD, Tomar SS. Effect of moisture conservation and sulphur sources on productivity and water use efficiency of Indian mustard under rainfed conditions. Indian J Agron. 2013;58(2):231-236.
- Thaneshwar, Singh V, Prakash J, Kumar M, Kumar S, Singh R, et al. Effect of integrated nutrient management on growth and yield of mustard (Brassica juncea L.) in irrigated condition of upper gangetic plain zone of India. Int. J Curr. Microbiol. App Sci. 2017;6(1):922-932.
- Yadav KG, Kushwaha CB, Singh PK, Kumar M, Yadav SK, Nishant, et al. Effect of nutrient management on yield and nutrient uptake by Indian mustard (Brassica juncea L.). J Pharmacogn. Phytochem. 2017;SP1:556-559.
- Bhowmik SK, Wilde SA, Bhandari A, Basu Sarbadhikari A. Zoned monazite and zircon as monitors for the thermal history of granulite terranes: An example from the Central Indian Tectonic Zone. Journal of Petrology. 2014 Mar 1;55(3):585-621.
- Verma A, Stellacci F. Effect of surface properties on nanoparticle-cell interactions. Small. 2010 Jan 4;6(1):12-21.
Cited by 4
From OpenAlex, OpenCitations and reference lists read by Scinovex
- Effect of integrated nutrient management on agronomic traits and soil properties of Indian mustard (Brassica juncea L.)
Radheshyam ., D Prasad, Vinamrata Jain, LK Ramteke, D Nishad, Chhaviraj Baghel · International Journal of Research in Agronomy · 2026
A field experiment was conducted during Rabi season of 2024-25 at Research cum Instructional Farm, Pt. Shiv Kumar Shastri College of Agriculture & Research Station, Surgi, Rajnandgaon, (C.G.). To study the Effect of Integrated Nutrient Management on Agronomic Traits and Soil Properties of Indian Mustard (Brassica juncea L.). The experimental soil was characterized as Sandy loam in texture and was medium in Organic carbon (0.65%), low in available Nitrogen (213.46 kg ha-1) and Phosphorus (11.08 kg ha-1) and medium in available Potassium (252.06 kg ha-1). The experiment was laid out in a Randomi
- Effect of integrated nutrient management on growth of mustard (Brassica juncea L.)
Krishnkant Tiwari, Hirdesh Kumar, Ashish Pathak, Ankit Bhadoriya, Sachin Kumar Singh, Arun Sahu · International Journal of Research in Agronomy · 2026
The present investigation entitled “Effect of Integrated Nutrient Management on growth and yield of mustard (Brassica juncea L.)” was executed at Agriculture Research and development Centre, Sakatpura, Vikrant University, Gwalior (M.P.). Mustard (Brassica juncea L.) belongs to the family cruciferae popularly known as rai and is an important rabi season oilseed crop of north India. The major constraint attributing to low production of mustard are scare and untimely water supply and poor fertility status of soil. General practices of growing this crop that the field are kept fallow during rainy
- Impact of nutrient management through different bulky manures and their combination on growth, yield and economics of wheat-mustard intercropping in Bundelkhand
Kuldeep Rawat, Santosh Pandey, Yuvraj Pal, Prashant Kumar, Arun Jha · International Journal of Research in Agronomy · 2026
The experiment was conducted in the Karguaji Organic Research Farm, Department of Agronomy, Institute of Agricultural Sciences, Bundelkhand University, Jhansi. The study was undertaken to evaluate the effect of different bulky manures and their combinations on the growth, yield attributes, yield, productivity and economic returns of wheat and mustard under intercropping conditions. The study included nine treatments, viz., T1- Control (No external organic input- baseline), T2- FYM 100%, T3 Green Manure 100%, T4- Compost 100%, T5- FYM 50% + G.M 50%, T6- FYM 50% + Compost 50%, T7- G.M 50% + Comp
- Effect of organic and inorganic sources of nutrients on growth, yield and economics of Indian mustard (Brassica campestris L.)
Eeshu Lal, Santosh Kumar Sahu, Pravindra Kumar Salam, Tejpal Chandrakar, Devendra Pratap Singh, Ashwani Kumar · International Journal of Research in Agronomy · 2025
A field experiment was conducted during Rabi season of 2024-25 at Instructional cum Research Farm, SG College of Agriculture and Research Station, Jagdalpur, to evaluate the Effect of organic and inorganic sources of nutrients on growth, yield and economics of Indian mustard (Brassica campestris L.). The experiment was laid out in Randomized Block Design with 8 treatments viz., RDF 100:60:40:35 NPKS kg ha-1, RDF + FYM 10 t ha-1, RDF 75%, RDF 75% + FYM 10 t ha-1, RDF 50%, RDF 50% + FYM 10 t ha-1, FYM 10 t ha-1, Control replicated thrice. Increase in the application of varying organic and inorga