
Research article · 2024 · Full text
International Journal of Agriculture Extension and Social DevelopmentA comparative study of college girls' lifestyles in rural and urban regions
Volume 7(6) · Pages 449–454 · DOI: 10.33545/26180723.2024.v7.i6f.750 ↗
Research areasMigration, Ethnicity, and EconomyEntrepreneurship Studies and Influences
Abstract
Author-writtenCollege is seen as a critical point in one's life. Due to the increase in the workload and the observable increase in the competition amongst the youth, the health and fitness of oneself is put as a secondary priority amongst them. The purpose of the study was to assess the lifestyle of college girls of urban and rural respondents of Hisar district of Haryana. Lifestyle was assessed by using Fantastic Lifestyle Checklist. For this total subject of 120 female students, among them 60 from the urban area and 60 from the rural area of same district were selected from the various departments of the two colleges. The data reveals that both urban (65.0%) and rural (66.7%) respondents have a predominantly positive perception of their lifestyles, with a majority rating it as “very good”. A slightly higher percentage of (35.0%) urban report as “good” lifestyle compared to rural respondents (28.3%). However, rural areas have a small percentage (5.0%) of people who perceive their lifestyle as “excellent”, which is not reported in urban areas. Efforts to improve lifestyle satisfaction could focus on addressing the specific needs that differentiate those with a good lifestyle from those with a very good or excellent lifestyle.
Summary
Source-checkedPlain-language reading of the full paper, prepared with AI and checked against the text. Each point links to the authors' own words.
Why it matters
- Increased workloads and competition among youth have led to health and fitness becoming a secondary priority. View evidence ↗
- Girls face significant pressure due to dual responsibilities involving domestic chores, caregiving, and income generation. View evidence ↗
- Promoting healthy lifestyles for female students is essential for improving their longevity and overall quality of life. View evidence ↗
The question
- The study aimed to assess and compare the lifestyles of college girls living in rural and urban areas of the Hisar district in Haryana. View evidence ↗
What they did
- The sample consisted of 120 female students, split equally with 60 from urban areas and 60 from rural areas. View evidence ↗
- Lifestyles were evaluated using the FANTASTIC Lifestyle Checklist, a tool developed by Wilson and collaborators in 1983. View evidence ↗
- Data was collected via personal interviews and analyzed using frequency, percentage, WMS, and correlation. View evidence ↗
What they found
- A majority of respondents in both groups perceived their lifestyle as 'very good', with 65.0% of urban and 66.7% of rural girls falling into this category. View evidence ↗
- Urban respondents reported a 'good' lifestyle more frequently (35.0%) than rural respondents (28.3%). View evidence ↗
- An 'excellent' lifestyle was reported by 5.0% of rural respondents, while no urban respondents reported this level. View evidence ↗
- Rural girls were more likely to maintain a balanced diet 'almost always' (41.7%) compared to urban girls, who most often did so only 'some time' (45.0%). View evidence ↗
- Both groups showed high levels of moderate activity 5 or more times per week, though this was more prevalent in rural girls (75.0%) than urban girls (58.3%). View evidence ↗
- Socio-economic status and education were found to positively correlate with lifestyle scores for the total respondent group (p < 0.05). View evidence ↗
What it means
- The authors conclude that urban areas may provide more consistent facility access, while rural areas may have a small group with unique advantages leading to 'excellent' lifestyle ratings. View evidence ↗
- The authors recommend that efforts to improve lifestyle satisfaction should target the specific needs that separate 'good' lifestyles from 'very good' or 'excellent' ones. View evidence ↗
Figures & tables
From the original paper Table 1
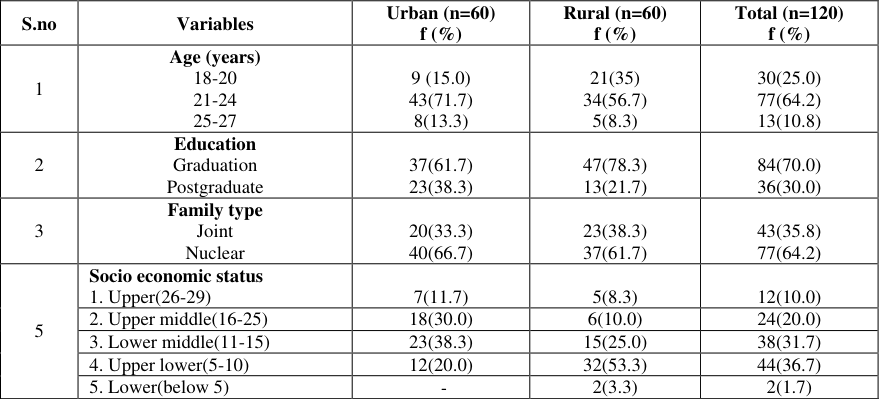 Table 1
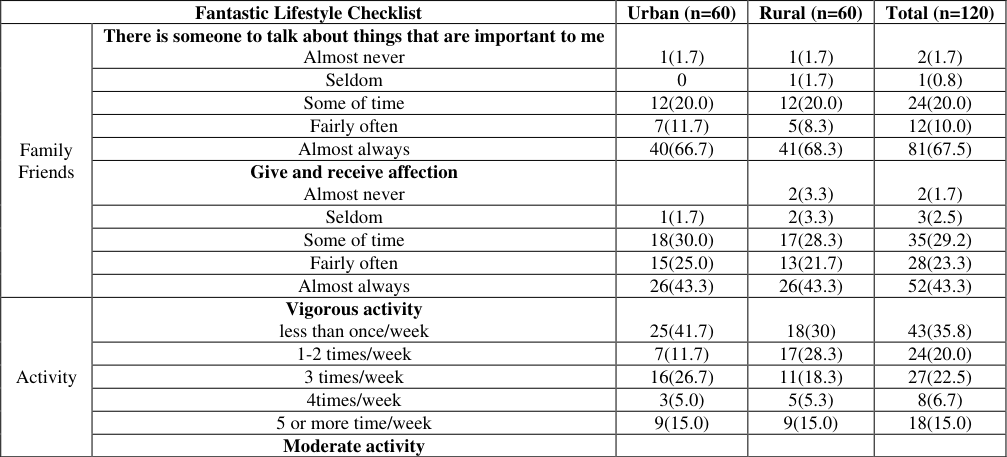 Table 2
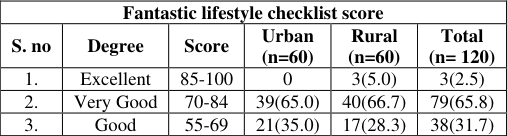 Table 3
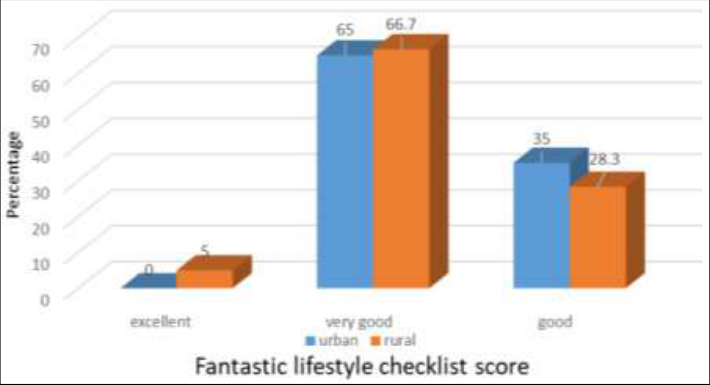 Figure 1
 Table 4
Introduction
A healthy lifestyle provides a strong and stable foundation essential for physical fitness. A lifestyle encompasses the way one lives, which can be categorized as either healthy or unhealthy based on personal choices. It is widely accepted that physical fitness is influenced by everyday activities. An individual's daily behaviors and routines, including work, leisure, and diet, all contribute to their lifestyle. A healthy lifestyle can be seen as a state of harmony between an individual and their physical and social surroundings. This harmony is influenced by the individual's health potential or ability to manage environmental challenges and by the nature and intensity of environmental stress. Girls fulfill multiple roles in society, being responsible not only for food preparation and processing but also for domestic chores, income generation, and caring for dependents. Because of their dual responsibilities at home and in workplaces outside the home, there is increased pressure for productivity, quality work, and profitability. Girls' physiological characteristics and reproductive needs make them particularly vulnerable to work-related health issues. Their health is of special concern due to widespread discrimination, which leaves them at a disadvantage globally. Promoting a healthy lifestyle for female students significantly contributes to their quality of life and longevity. Girls are vital components of society and represent the future of our country. The lifestyle of college girls has undergone significant changes. To evaluate their lifestyles, the FANTASTIC Lifestyle Questionnaire, developed in 1983 by Wilson and collaborators, can be used. This questionnaire is designed to assess the population's lifestyles and is intended for use in community health education programs. It is a simple and quick questionnaire that evaluates nine dimensions. "FANTASTIC" is an acronym representing these dimensions: Family and friends (2 items), Activity and Associativity (3 items), Nutrition (3 items), Tobacco (2 items), Alcohol and other substances (6 items), Sleep and stress (3 items), Type of personality (3 items), Introspection (3 items), and Control of health (3 items).In the current context, it is essential to study and assess the impact of lifestyle on the physical fitness of girls. So, the current study was planned to assess the lifestyle of the college going girls in rural and urban area.
Methodology
To achieve the planned objective study was conducted on college girls to assess the lifestyle in rural and urban area in Hisar district, of Haryana. The Hisar district in Haryana was chosen purposefully for the survey. The sample consisted of 120 college girls from Hisar. A list of girls' colleges in Hisar city was obtained from the Department of Higher Education, Haryana, and two colleges were randomly selected. From these selected colleges, lists of students were acquired. www.extensionjournal.com From each of the selected colleges, 60 respondents were randomly chosen, resulting in a total sample of 120 students. The sample was designed to include 30 students from rural areas and 30 from urban areas in each college. A schedule was developed and tested on 30 respondents before conducting the actual study to collect data. An observation sheet was prepared to assess the lifestyle of college going girls in rural and urban area. Personal interview schedule was used to collect the data and frequency, percentage, WMS and correlation were calculated to analysis the data. Fantastic Lifestyle Checklist: data in table 2 showed that majority of respondents (66.7%) in urban area almost always had someone to talk about the things followed by some time (20.0%), then fairly often (11.7%) and almost never (1.7%). The majority of respondent in rural area (68.3%) almost always had of the respondents followed by some of time (20.0%), fairly often (8.3%) and seldom and almost never (1.7%each). The majority of respondent (43.3%) in urban area were giving and receiving affection almost always followed by some of time (30%), fairly often (25%) and seldom (1.7%). Majority of respondent in rural area were giving & receiving affection almost always (43.3%) followed by some of time (28.3%), fairly often (21.7%), and seldom and almost never (3.3%) each. Majority of respondents (41.7%) in urban area were vigorously active for less than once / week followed by three times/week (26.7%), five or more times/week (15.0%), 1-2 times/week (11.7%) and 4 times/week (5.0%). Whereas majority of respondents(30.0%) in rural areas were vigorously active for less than once/week followed by 28.3% who were doing vigorous activity 1-2 times/week, three times /week (18.3%), five or more times/ week (15.0%) and four times/week (5.3%). Maximum of respondents in urban area (58.3%) were moderately active for 5 or more time/week followed by less than once a /week and 1-2 times/week (13.3%) each, fourtimes/week (10.0%) and three time/week (5.0%). Maximum of respondents in rural area were moderately active for 5 or more times/week (75.0%) followed by less than once/week (8.3%), 4 times/week and 3 times/week (6.7%) each and 1-2 times/week (3.3%). Most of the respondents in urban area were taking balance diet some time (45.0%) followed by fairly often (31.7%), seldom (10.0%), almost always (8.3%) and almost never (5.0%). Most of the respondents in rural area were taking balance diet almost always (41.7%) followed some of time (33.3%), fairly often (21.7%) and almost never (3.3%). Majority of respondents in urban area 35.0% were 3 of these followed by 21.7% were none of these, 20.0% were 2 of these, 16.7% were 1 of these and 6.7% were 4 of these. Majority of respondents in rural area 46.7% were 3 of these followed by 20.0% were 2 of these, 18.3% were none of these, 13.3% were 1 of these and 1.7% were 4 of these. Maximum of respondents (33.3%) in urban area were within 2Kg of healthy weight that they think is healthy followed by28.3% with range of 6Kgwithin 8Kg and not within 8Kg (13.3%) each and within 4Kg (11.7%). Healthy weight of majority of respondents in rural area was within 2kg (28.3%), followed by within 4kg and 6kg (21.7% each), not within 8Kg (18.3 %) and within 8Kg (10.0%). Maximum of respondents in urban area didn't smoke in the past 5 years (90%) followed in past year (5.0%), whereas 1-10times/week (1.7%) were smoking 1-10times/week and 3.3% were smoking more than 10 times per week. Maximum of respondents in rural area didn't smoke in past 5 years. Drugs were not used by neither any of urban nor rural respondents. Not a single respondent from urban and rural area were overusing of the drugs (100%).Majority of respondents in urban areas were drinking caffeine drinks 1-2 times/days (48.3%), followed by never (33.3%), 3-6 times/day (10.0%), 7-10 times/day (5.0%) and more than 20 drinks per day (3.3%). Whereas majority of respondents in rural area were drinking caffeine drinks1-2 times/day (65.0%) followed by never (18.3%), 3-6 times /day (10.0%) and 7-10 times/day (6.7%). Not a single respondent from urban and rural area were taking alcohol (100%). Not a single respondent from urban and rural area were taking alcohol more than four drinks on an occasion. The total respondents in urban and rural area never drived after drinking. Maximum of respondents in urban areas were sleeping well and feel rested almost always (56.7%) followed by fairly often (28.3%), some of time (6.7%) and almost never (5.0%) only few were seldom sleeping well (3.3%). Similarly maximum of respondents in rural area were sleeping well and feel relaxed almost always (61.7%) followed by fairly often (30.0%), some of time (6.7%), and almost never (1.7%). Majority of respondents in urban area were able to cope up stress in life some time (40.0%) followed by fairly often (33.3%), almost always (21.7%), and seldom (5.0%). Majority of respondents in rural area were able to cope up stress in life some of time (40.0%) followed by fairly often (28.3%), almost always (21.7%), seldom (8.3%) and almost never (1.7%). Maximum of the respondents in urban and rural area were always using seat belt (60.0%) followed by most of times (23.3%), sometime (13.3%) and never (3.3%). Whereas majority of respondents in rural area were using seat belt always (70.0%) followed by some of time (16.7%) and most of time and never (6.7% each). Most of respondents in urban area were always relaxed and enjoyed leisure time always (48.3%) followed by fairly often (25.0%), some of time (18.3%), seldom (5.0%) and almost never (3.3%). Most of the respondents in rural area were always relaxed and enjoyed leisure time almost always (63.3%) followed by fairly often (21.7%), some of time (10.0%) and seldom (5.0%). Maximum of respondents (60.0%) in urban area were sometimes having hurried behaviour followed by seldomly (13.3%), fairly often (11.7%), almost never (8.3%) and almost always (6.7%). However maximum of respondents (71.7%) in rural area were in hurry some time followed by seldom (15.0%), fairly often ( Half of respondents in urban area were always satisfied with their role followed by fairly often (23.3%), sometimes (18.3%), seldom (6.7%) and almost never (1.7%). Whereas majority of respondents (56.6%) in rural area were almost always satisfied followed by sometimes (25%), fairly often (16.7%) and never (1.7%). 4 showed that education and socio economic status shows positively correlates with a fantastic lifestyle for total respondents. Age, family type no correlation.
| Fantastic Lifestyle Checklist | — | Urban (n=60) | Rural (n=60) | Total (n=120) |
|---|---|---|---|---|
| Family Friends | There is someone to talk about things that are important to me Almost never | 1(1.7) | 1(1.7) | 2(1.7) |
| Seldom | 0 | 1(1.7) | 1(0.8) | |
| Some of time | 12(20.0) | 12(20.0) | 24(20.0) | |
| Fairly often | 7(11.7) | 5(8.3) | 12(10.0) | |
| Almost always | 40(66.7) | 41(68.3) | 81(67.5) | |
| Give and receive affection Almost never | 2(3.3) | 2(1.7) | ||
| Seldom | 1(1.7) | 2(3.3) | 3(2.5) | |
| Some of time | 18(30.0) | 17(28.3) | 35(29.2) | |
| Fairly often | 15(25.0) | 13(21.7) | 28(23.3) | |
| Almost always | 26(43.3) | 26(43.3) | 52(43.3) | |
| Activity | Vigorous activity less than once/week | 25(41.7) | 18(30) | 43(35.8) |
| 1-2 times/week | 7(11.7) | 17(28.3) | 24(20.0) | |
| 3 times/week | 16(26.7) | 11(18.3) | 27(22.5) | |
| 4times/week | 3(5.0) | 5(5.3) | 8(6.7) | |
| 5 or more time/week | 9(15.0) | 9(15.0) | 18(15.0) | |
| Moderate activity |
Table text extracted from the original PDF; superscript letters are shown inline. The original table image is below.
View original table image
Results and Discussion
Results and Discussion
Conclusion
The data reveals that both urban (65.0%) and rural (66.7%) respondents have a predominantly positive perception of their lifestyles, with a majority rating it as "very good". A slightly higher percentage of (35.0%) urban report a "good" lifestyle compared to rural respondents (28.3%). However, rural areas have a small percentage (5.0%) of people who perceive their lifestyle as "excellent", which is not reported in urban areas. This suggests that while overall satisfaction is high, there are distinct differences in how lifestyles are rated between urban and rural settings. Urban areas might have more consistent access to various facilities leading to a higher good lifestyle rating, whereas rural areas have a small elite group experiencing an excellent lifestyle possibly due to unique local advantages.
Figures and tables from the paper
| Socio-personal and economic variables | — |
|---|---|
| Age | Chronological age |
| Family type | Schedule was developed |
| Education of respondent | |
| Socio economic status of family | |
| Lifestyle | Modified Fantastic lifestyle check list (Wilson Douglas 1985) |
Table text extracted from the original PDF; superscript letters are shown inline. The original table image is below.
View original table image
| Fantastic lifestyle checklist score | — | — | — | — | — |
|---|---|---|---|---|---|
| S. no | Degree | Score | Urban (n=60) | Rural (n=60) | Total (n= 120) |
| 1. | Excellent | 85-100 | 0 | 3(5.0) | 3(2.5) |
| 2. | Very Good | 70-84 | 39(65.0) | 40(66.7) | 79(65.8) |
| 3. | Good | 55-69 | 21(35.0) | 17(28.3) | 38(31.7) |
Table text extracted from the original PDF; superscript letters are shown inline. The original table image is below.
View original table image
| Independent variables | Fantastic lifestyle (Urban) | Fantastic lifestyle (Rural) | Fantastic lifestyle (Total) |
|---|---|---|---|
| Age | 0.108 | 0.066 | 0.137 |
| Family type | 0.035 | 0.109 | 0.089 |
| Socio economic | 0.496* | 0.468* | 0.486* |
| Education | 0.596* | 0.475* | 0.489* |
Table text extracted from the original PDF; superscript letters are shown inline. The original table image is below.
View original table image
References
11 in the original paper- Adams TB, Moore MT, Dye J. The relationship between physical activity and mental health in a national sample of college females. Women & Health. 2007;45(1):69-85.
- Ajibade PB. Physical Activity Patterns by Campus Housing Status among African American Female. Journal of Black Studies. 2011;42(4):1-14.
- Anjana R, Pradeepa R, Das A, Mohan D, Bhansali A, Joshi SR, et al. Physical activity and inactivity patterns in India. International Journal of Behavioral Nutrition and Physical Activity. 2014;11(1):26.
- Bovet P, Auguste R, Burdette H. Strong inverse association between physical fitness and overweight in adolescents: a large school-based survey. International Journal of Behavioral Nutrition and Physical Activity, 2007.
- Buckworth JB, Nigg CN. Physical Activity, Exercise, and Sedentary Behavior in College Students. Journal of American College Health. 2004;53(1):28-34.
- Centers for Disease Control and Prevention, 2006. CDC surveillance summaries, June 9, 2006. MMWR 2006, 55, Article SS-5. Retrieved March 18, 2008, from http://www.cdc.gov/mmwr/preview/ mmwrhtml/ss5505a1.htm
- Choudhary S, Khichar S, Dabi D, Parakh M, Dara PK, Parakh P, et al. Urban Rural Comparison of Anthropometry and Menarcheal Status of Adolescent School Going Girls of Jodhpur, Rajasthan, India. J Clin Diagn Res. 2016;10(10):SC08-SC12.
- Cervera F, Serrano R, Vico C, Milla M, García M. Hábitos alimentarios y evaluación nutricional en una población universitaria. Nutr Hosp. 2013;28(2):438446.
- Córdoba D, Carmona M, Terán OE, Márquez O. Life style and nutritional status in university students: a descriptive, cross-sectional study. Med-wave 2013;13(11):e5864.
- Wilson, Douglas. Fantastic Lifestyle Assessment checklist. Department of Family Medicine, McMaster University, Hamilton, Ontario. Canada, 1985.
- Wilson DM, Ciliska D. Lifestyle assessment. Can. Fam. Physician. 1984;30:1527.