
Research article · 2024 · Full text
International Journal of Research in AgronomyInvestigating the long-term dynamics of basmati rice and agricultural exports in India: A var approach
Volume 7(6S) · Pages 546–549 · DOI: 10.33545/2618060x.2024.v7.i6sh.945 ↗
Research areasAgricultural Economics and Practices
Abstract
Author-writtenBasmati rice holds significant importance in India's agricultural exports due to its high demand and premium pricing in international markets. This study investigates the relationship between basmati rice exports and agricultural exports in India to test the export-led growth (ELG) hypothesis, which posits that exports drive economic growth. Utilizing the Johansen cointegration method and a Vector Autoregressive (VAR) model, the analysis confirms a stable long-run relationship between the value of basmati rice exports and total agricultural exports. Variance decomposition reveals that while initial forecast errors in each variable are primarily due to their own variations, over time, agricultural exports significantly influence basmati rice exports, accounting for up to 76 percent of the forecast error. This interdependence suggests that policies aimed at stabilizing and promoting agricultural exports can substantially enhance basmati rice export performance, thereby supporting broader economic development.
Summary
Source-checkedPlain-language reading of the full paper, prepared with AI and checked against the text. Each point links to the authors' own words.
Why it matters
- Basmati rice is a critical component of India's agricultural exports because it is highly demanded and commands premium prices globally. View evidence ↗
- India's agricultural exports grew nearly 50-fold over 30 years, rising from Rs. 6012.76 crore in 1990-91 to Rs. 305469 crores in 2020-21. View evidence ↗
- Agricultural exports are vital to India's agricultural Gross Value Added (GVA), with their share increasing from 3.88% in 1990-91 to 8.45% in 2020-21. View evidence ↗
The question
- The study aims to test the export-led growth (ELG) hypothesis by investigating the relationship between basmati rice exports and total agricultural exports in India. View evidence ↗
What they did
- The researchers used the Johansen cointegration method and a Vector Autoregression (VAR) model to analyze the long-term relationship between the variables. View evidence ↗
- To ensure reliability and avoid spurious regression, the variables were tested for stationarity using Augmented Dickey-Fuller (ADF) and Phillips-Perron (PP) unit root tests. View evidence ↗
- Variance decomposition of the VAR model was used to examine the dynamic interactions and the impact of shocks between agricultural and basmati rice exports. View evidence ↗
What they found
- The cointegration test rejected the null hypothesis at a 5% significance level, indicating a stable long-term relationship between basmati rice exports, total agricultural exports, and the exchange rate. View evidence ↗
- The VAR system was found to be stable because none of the roots of the characteristic polynomial lay outside the unit circle. View evidence ↗
- Initially, 98% of the forecast error for agricultural exports was due to its own shocks, but in later periods, basmati rice exports accounted for approximately 6% of that error. View evidence ↗
- For basmati rice exports, the influence of its own shocks dropped from 85% in the first period to 21%, while the influence of agricultural export shocks increased from 14% to 76% by the end. View evidence ↗
- The exchange rate had a minimal impact on the variance of both agricultural and basmati rice exports, and vice versa, throughout all analyzed periods. View evidence ↗
What it means
- The authors conclude that policies designed to promote and stabilize overall agricultural exports can significantly improve the performance of basmati rice exports. View evidence ↗
Visual summary
1 visualsIllustrations explain the paper; they do not show study data.
Dynamic Influence Shift
AI-generated conceptual illustration (Basmati rice grains and a diverse assortment of Indian agricultural crops). It explains the idea and does not show study data.
View source evidence ↗Figures & tables
From the original paper Table 1
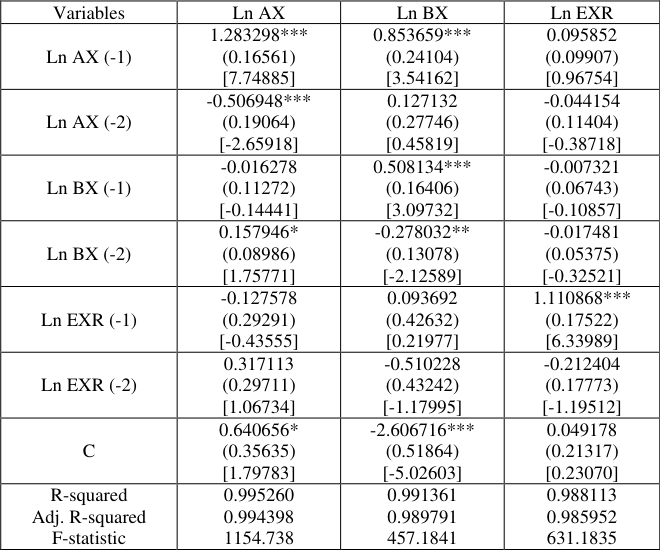 Table 2
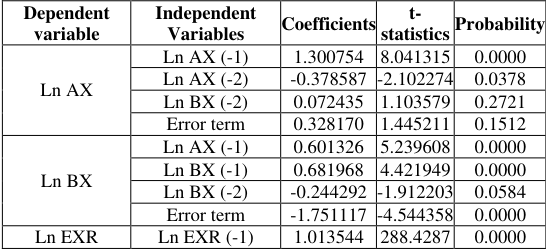 Table 3
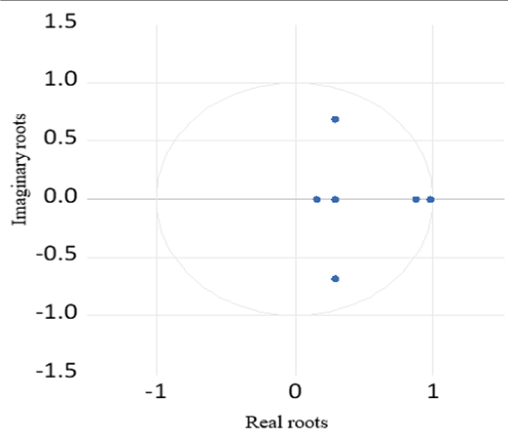 Figure 1
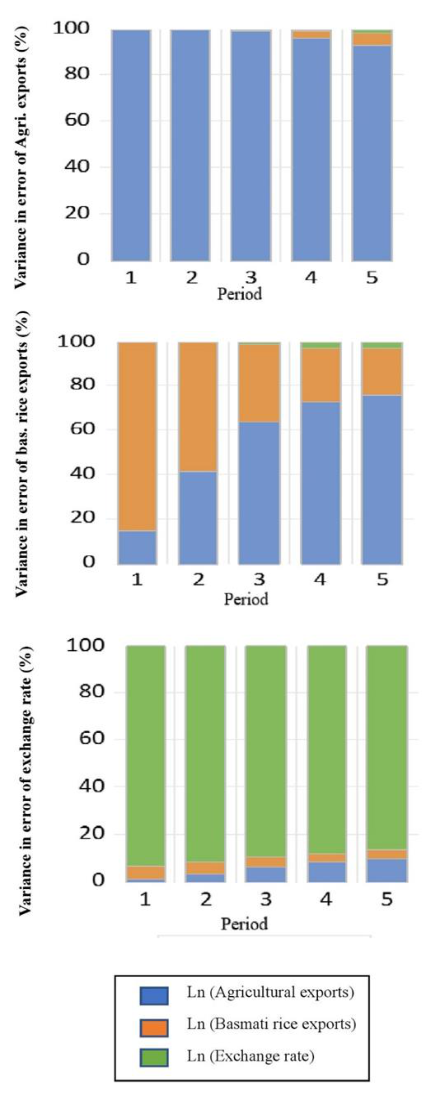 Figure 2
Introduction
The global agricultural trade landscape has witnessed significant shifts over the past decades, with developing economies like India playing a pivotal role. Because of spectacular growth witnessed on production side, the country's agricultural exports have also increased from Rs. 6012.76 crore in 1990-91 to Rs. 305469 crores in 2020-21, registering an increase of nearly 50 times in the span of 30 years. Agricultural exports are a vital component of agricultural GVA of India, its share to agricultural GVA increased from 3.88 percent in 1990-91 to 8.45 per cent in 2020-21. The export of pulses, basmati rice, poultry products, dairy products, and wheat from India has increased by 90.49, 39.26, 88.45, 33.77, and 29.29 per cent, respectively (Ministry of Commerce and Industry, 2020-21). The percentage share of rice in total exports was 1.72 percent in 1991-22, which following leaps and bounds of 4.49 percent in 1998-99 reported as 2.1 percent in 2019-20, with an average annual growth rate of 21.19 percent in its export earnings. In total agricultural and allied products exports, the earnings from rice exports accounted a share of 9.6 percent in 1991-92, which increased up to 18.30 percent in 2019-20 (Thomas and Karunakaran, 2023) [1] . India is well known for both basmati and non-basmati rice production. Among India's diverse agricultural exports, basmati rice stands out as a key commodity, renowned for its quality and high economic value. Despite its prominence, there remains a gap in understanding the precise impact of basmati rice exports on the broader agricultural sector and overall economic growth of the country. This research aims to address this gap by exploring the relationship between basmati rice exports and agricultural growth in India, under the framework of the export-led growth hypothesis. The export-led growth (ELG) hypothesis, stating that export is a crucial determinant of economic growth, has been subjected to several analysis. Furthermore, its role in economic development regarded as an important policy issue in many less developed countries (Dawson 2005) [2] . Numerous studies have investigated the relationship between exports and economic growth by examining the effects of the total exports on the gross domestic product (Feder 1982; Marin 1992; Ghartey 1993; Kwan and Kwok 1995; Shan and Sun 1998) [3,7,4,6,8] . The expansion of agricultural exports contributes remarkably in increasing the rate of economic growth in developing countries, reason could be the comparative advantage those countries are having in agricultural sector due to resource endowment (Johnston and Mellor, 1961; Siaw et al., 2018) [5,9] . The export-led growth hypothesis posits that an increase in exports leads to an overall economic growth, suggesting that a robust basmati rice export strategy could potentially drive broader agricultural and economic development. By investigating export data over the years, this research aimed to identify causal relationships, and understanding of the impact of basmati rice exports. This understanding is crucial for policymakers, stakeholders, and farmers to formulate strategies that maximize the benefits of basmati rice exports, ensuring sustainable agricultural and economic growth.
Methodology
As per the theories suggested by pioneer economists Adam Smith (1776) and David Ricardo (1817), trade plays a key role in economic growth. Developing countries are formulating the economic development strategies emphasizing sectoral exports. The expansion of agricultural exports contributes remarkably in increasing the rate of economic growth in developing countries, reason could be the comparative advantage those countries are having in agricultural sector due to resource endowment (Siaw et al. 2018) [9] . In order to assess the role of exports of agricultural products on agricultural growth several attempts had been made. In similar regard, an effort is accomplished to reveal the existing relationship between the basmati rice export and agricultural exports of India and to detect the causality among the variables employing the following model which was further transformed into the logarithmic form in order to rule out any differences in the units of the variables.
Where, represented value of total agricultural exports during t th year , value of basmati rice export at time t , exchange rate at time t , the intercept and and represented the elasticity coefficients of the respective variables To test the hypothesis and observe the relationship between agricultural exports and basmati rice exports, the Johansen cointegration method employed to assess the cointegration between the variables. Before conducting the cointegration analysis, the variables in the model checked for stationarity, and the order of integration was determined using unit root tests, specifically the Augmented Dickey-Fuller (ADF) test, and the Phillips-Perron (PP) test. This process ensured the reliability of the results by ruling out the probability of spurious regression. Upon establishing stationarity and integration order, a Vector Autoregression (VAR) model utilized to establish the stable long-run cointegration between the variables. Structural descriptions further elaborated through variance decomposition of the VAR model, which highlighted the dynamic interactions between agricultural exports and basmati rice exports.
Results
The results of the cointegration test presented in Table 1 rejected the null hypothesis of no cointegrating equation between the variables based on the trace statistic at the 5 percent significance level. This finding indicates the presence of at least one cointegrating equation, signifying a stable long-term relationship among the value of basmati rice exports, total agricultural exports, and the exchange rate.
| Hypothesis | Eigen value | Trace statistic | Critical value (5% LOS) | Probability | Conclusion |
|---|---|---|---|---|---|
| None | 0.474368 | 25.08302 | 21.13162 | 0.0132** | Cointegration exists |
| At most 1 | 0.137857 | 5.785029 | 14.26460 | 0.6410 | No cointegration |
| At most 2 | 0.013673 | 0.899241 | 3.841465 | 0.4637 | No cointegration |
Table text extracted from the original PDF; superscript letters are shown inline. The original table image is below.
View original table image
Modelling of cointegration and structural description
After establishing cointegration between the variables, a Vector Autoregressive (VAR) model utilized to represent the cointegrating relationship. The VAR model developed in the study, illustrating the cointegrating relationship among the variables, expressed as: in which variables (lnAX, lnBX, lnEXR) were employed in vector form, with as their 1 st difference operators which resulted in as VAR parameters with i optimal lags and error terms which are known as impulses, shocks or innovations in case of VAR approach. The detailed description of the VAR analysis outcomes discussed subsequently. The VAR estimates indicated a long-run equilibrium among the variables. Since the VAR model does not include exogenous variables, each variable potentially influences the others, creating dynamic interactions that characterize the economic aspects under consideration. The F-statistic value led to the rejection of the null hypothesis, signifying that all variables have reached a steady-state equilibrium. Table 2 presents the estimated coefficients along with their standard errors and t-statistic values derived from the VAR model. Further, the model employed for shock analysis using variance decomposition to understand the dynamic impact of the variables on each other.
The stability of the VAR system visually assessed by examining the roots of the characteristic polynomial, as illustrated in Figure 1. The dots in the figure represent these roots. Since none of the roots lie outside the unit circle, the VAR system meets the stability condition, indicating that the model is stable. Where, C (i) represents the respective coefficients from the output of VAR model.
Since the coefficients of the variables in the model estimated using the Ordinary Least Squares (OLS) method, the results of the parsimonious model presented in Table 3. The outcome of the model of simultaneous equations depicts the dependence of lagged variables, agricultural exports, and the value of basmati exports on each other. To provide a detailed explanation of the impact of these variables, variance decomposition of the VAR outcomes performed.
| Dependent variable | Independent Variables | Coefficients | t- statistics | Probability |
|---|---|---|---|---|
| Ln AX | Ln AX (-1) | 1.300754 | 8.041315 | 0.0000 |
| Ln AX (-2) | -0.378587 | -2.102274 | 0.0378 | |
| Ln BX (-2) | 0.072435 | 1.103579 | 0.2721 | |
| Error term | 0.328170 | 1.445211 | 0.1512 | |
| Ln BX | Ln AX (-1) | 0.601326 | 5.239608 | 0.0000 |
| Ln BX (-1) | 0.681968 | 4.421949 | 0.0000 | |
| Ln BX (-2) | -0.244292 | -1.912203 | 0.0584 | |
| Error term | -1.751117 | -4.544358 | 0.0000 | |
| Ln EXR | Ln EXR (-1) | 1.013544 | 288.4287 | 0.0000 |
Table text extracted from the original PDF; superscript letters are shown inline. The original table image is below.
View original table image
Variance decomposition analysis
Variance decomposition (VD) breaks down the variance of the forecast error into contributions from specific exogenous shocks. It analyzes the variance of a particular variable with respect to all variables in the model, aiding in forecasting behavior for the next five periods. The VAR model analysis produced stacked graphs for each variable, forecasting the variance in error over five periods displayed in Figure 2 with the findings ad follows: In the initial periods, 98 percent of the variation in the forecasted error of agricultural exports was due to shocks in its own value. In later periods, around 6 percent of the forecasted error attributed to shocks in basmati rice exports. For basmati rice exports, 85 percent of the error forecast variation in the first period was due to shocks in its own value, which eventually converged to 21 percent. This change was due to shocks in agricultural exports, increasing from 14 percent to 76 percent by the end, and in exchange rates, which contributed from zero to around 3 percent. The impact of agricultural exports and basmati rice exports on the variance of the exchange rate remained nominal throughout all periods. Similarly, the exchange rate's contribution to the variance in the forecast errors of agricultural exports and basmati rice exports was minimal.
Conclusion
The cointegration analysis confirmed a stable long-run relationship between the value of agricultural exports and the value of basmati rice exports. This suggests that these variables move together over the long term, maintaining a consistent association despite short-term fluctuations. The analysis of the parsimonious model of simultaneous equations revealed that lagged values of both agricultural exports and basmati rice exports depend on each other, further indicating their interconnectedness. Variance decomposition of forecasting errors indicated that the major contribution to the error in each variable was initially due to their own variations. However, the error in basmati rice exports found to significantly influence by variations in agricultural exports, explaining up to 76 percent of the error by the last period. This suggests that policies aimed at stabilizing and promoting agricultural exports can have a substantial impact on enhancing the performance of basmati rice exports.
References
9 in the original paper- Thomas J, Karunakaran N. Direction of India's rice exports in the post-liberalization era. J Manag Res Anal. 2021;8(3):117-121.
- Dawson PJ. Agricultural exports and economic growth in less developed countries. J Agric Econ. 2005;33(2):145152.
- Feder G. On exports and economic growth. J Dev Econ. 1983;12:59-73.
- Ghartey EE. Causal relationship between exports and economic growth: Some empirical evidence in Taiwan, Japan, and the US. Appl Econ. 1993;25:1145-1152.
- Johnston BF, Mellor JW. The role of agriculture in economic development. Am Econ Rev. 1961;51(4):566593.
- Kwan AC, Kwok B. Exogeneity and the export led growth hypothesis: The case of China. South Econ J. 1995;61:11581166.
- Marin D. Is the export-led growth hypothesis valid for industrialized countries? Rev Econ Stat. 1992;74:678-688.
- Shan J, Sun F. On the export-led growth hypothesis: The econometric evidence from China. Appl Econ. 1998;30:1055-1065.
- Siaw A, Jiang Y, Pickson RB, Dunya R. Agricultural exports and economic growth: A disaggregated analysis for Ghana. Theor Econ Lett. 2018;8(11):2251.