
Research article · 2024 · Full text
International Journal of Agriculture Extension and Social DevelopmentSocio-Economic Appraisal of Farmer Producer Organisations (FPOs): Empirical Insights from Northern Bihar
Volume 7(6) · Pages 434–448 · DOI: 10.33545/26180723.2024.v7.i6f.744 ↗
Research areasAgricultural Systems and PracticesAgricultural Innovations and PracticesAgricultural risk and resilience
Abstract
Author-writtenThe study investigates the socio-economic impact of Farmer Producer Organizations (FPOs) on small and marginal farmers in northern Bihar, focusing on Muzaffarpur and Samastipur districts. These regions were chosen for their high poverty rates and limited resource accessibility, critical factors influencing the effectiveness of FPO interventions. Through a comprehensive analysis involving six selected FPOs and a diverse sample of 240 farmers, the research reveals significant insights. The findings indicate that FPO membership positively influences farmers' socio-economic conditions, enhancing livelihoods, income levels, and agricultural sustainability. Key demographic factors such as age distribution (predominantly middle-aged farmers), educational background (diverse, with a notable proportion having completed high school), and landholding sizes (dominated by small and marginal farmers) underscore the inclusive nature of FPOs in catering to varied farmer needs. Moreover, the study highlights the proactive engagement of FPO members in group activities, information-seeking behavior, and adoption of innovative farming practices, all contributing to improved decision-making, market access, and overall community resilience. These insights are crucial for policymakers and practitioners aiming to strengthen support mechanisms and optimize the impact of FPOs in transforming agricultural landscapes and enhancing rural livelihoods in disadvantaged regions like northern Bihar.
Summary
Source-checkedPlain-language reading of the full paper, prepared with AI and checked against the text. Each point links to the authors' own words.
Why it matters
- Small and marginal farmers in northern Bihar struggle with fragmented land, limited resource access, and low bargaining power. View evidence ↗
- Farmer Producer Organizations (FPOs) are used as a collective strategy to improve market access and socio-economic well-being by pooling resources. View evidence ↗
The question
- The study aims to investigate how FPOs impact the socio-economic conditions of farmers in the Muzaffarpur and Samastipur districts of northern Bihar. View evidence ↗
What they did
- The researchers used an ex-post-facto research design to examine the impact of FPOs. View evidence ↗
What they found
- Middle-aged farmers (35-55 years) are the most represented group in FPOs, making up 53.8% of the sample. View evidence ↗
- Education levels vary, but the majority of FPO members have completed high school (37.1%). View evidence ↗
- There is a high adoption of modern farming techniques, with 84.17% of members showing medium to high farm mechanization levels. View evidence ↗
- FPO membership is associated with better economic stability, as 41.25% of members are in the medium income category and 26.6% are in the high income category. View evidence ↗
- Members are actively engaged in FPO activities, with 50% showing medium and 33.75% showing high levels of participation. View evidence ↗
- FPO members are proactive in acquiring knowledge, with 43.75% showing medium and 35.83% showing high information-seeking behavior. View evidence ↗
- Communication within FPOs is generally effective, with 53.33% of members having moderate and 44.59% having high proficiency. View evidence ↗
What it means
- The authors conclude that FPOs are crucial for enhancing the socio-economic conditions, productivity, and empowerment of smallholder farmers in northern Bihar. View evidence ↗
Visual summary
3 visualsIllustrations explain the paper; charts are replotted from the paper's own table values.
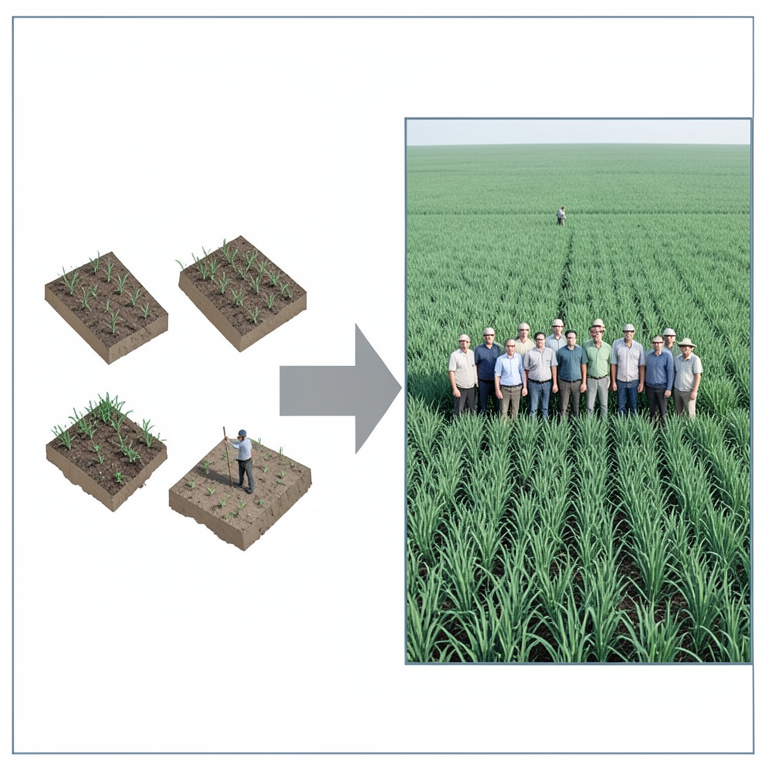
FPO Impact Cycle
AI-generated conceptual illustration (smallholder rice and maize farmers in Northern Bihar). It explains the idea and does not show study data.
View source evidence ↗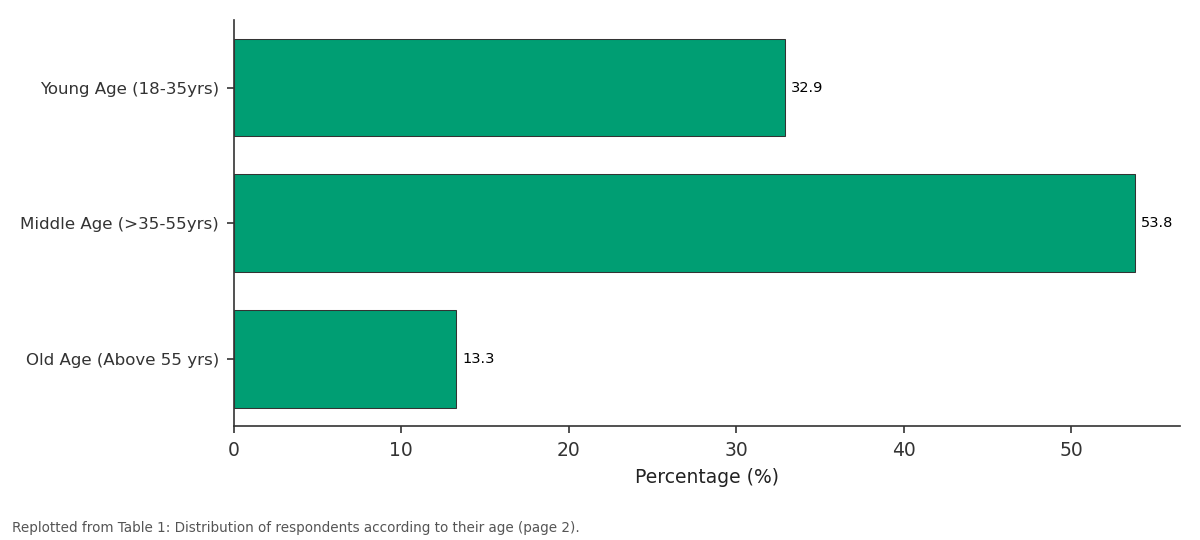
Percentage (%): Young Age (18-35yrs) vs Middle Age (>35-55yrs) vs Old Age (Above 55 yrs)
Replotted from Table 1 (page 2) of the original paper. Every bar is the paper's own table value.
View source evidence ↗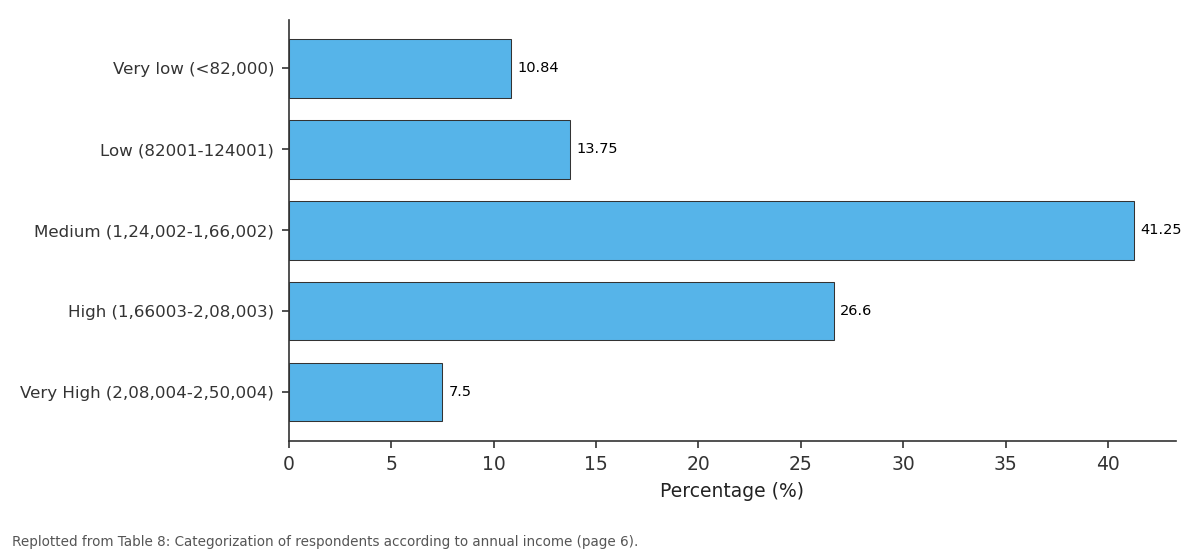
Percentage (%): Very low (<82,000) vs Low (82001-124001) vs Medium... vs High (1,66003-2,08,003) vs Very High...
Replotted from Table 8 (page 6) of the original paper. Every bar is the paper's own table value.
View source evidence ↗Figures & tables
From the original paper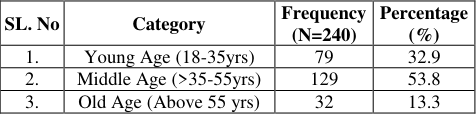 Table 1Page 2
 Table 2Page 2
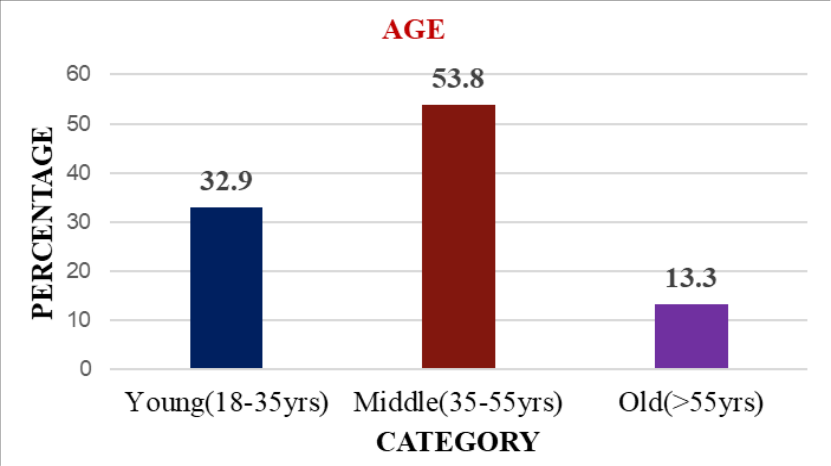 Figure 1Page 2
 Table 3Page 3
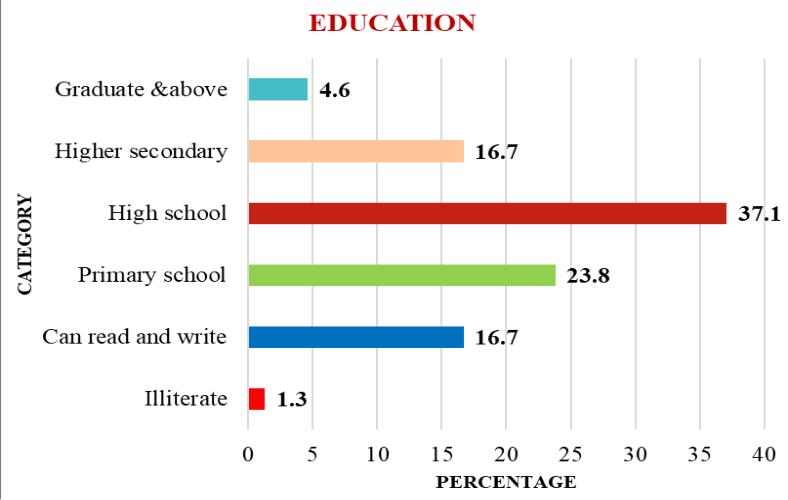 Figure 2Page 3
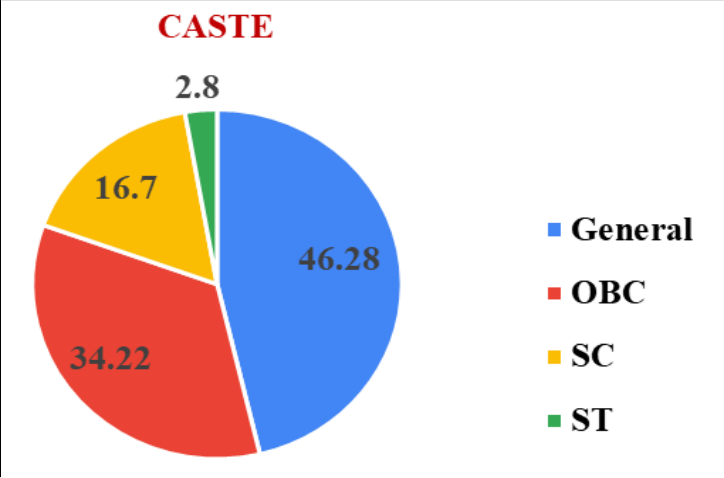 Figure 3Page 3
 Table 4Page 4
 Table 5Page 4
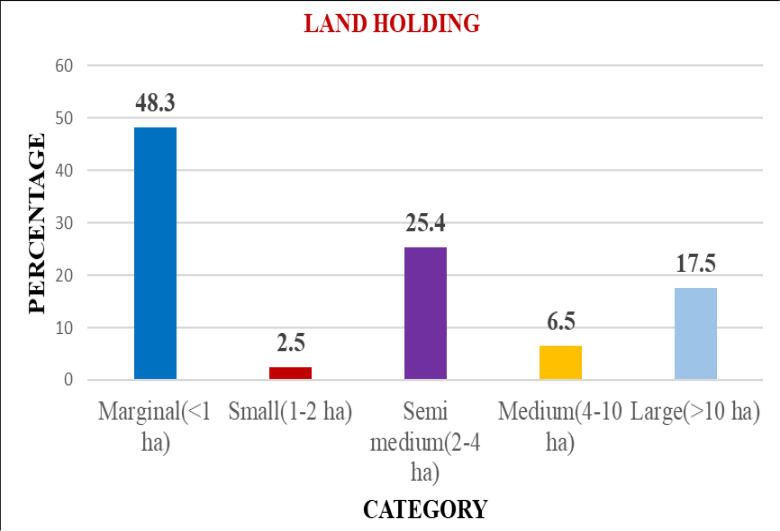 Figure 4Page 4
 Table 6Page 5
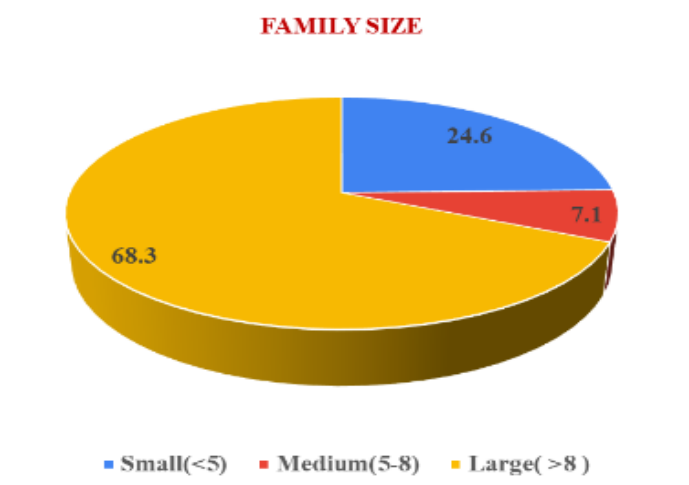 Figure 5Page 5
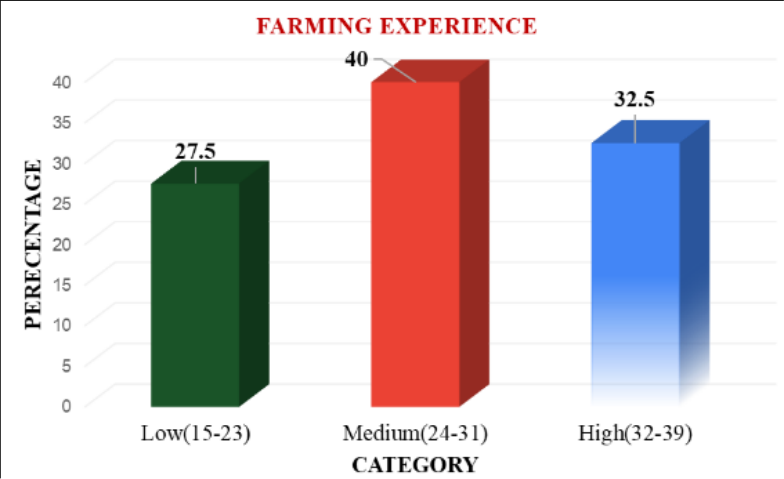 Figure 6Page 5
 Table 7Page 6
 Table 8Page 6
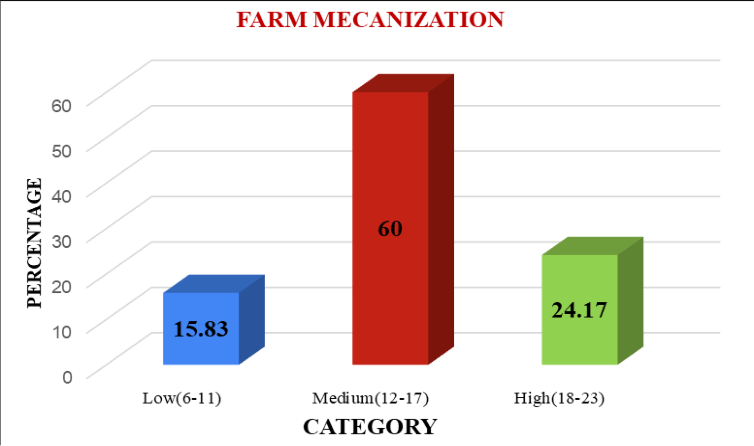 Figure 7Page 6
 Table 9Page 7
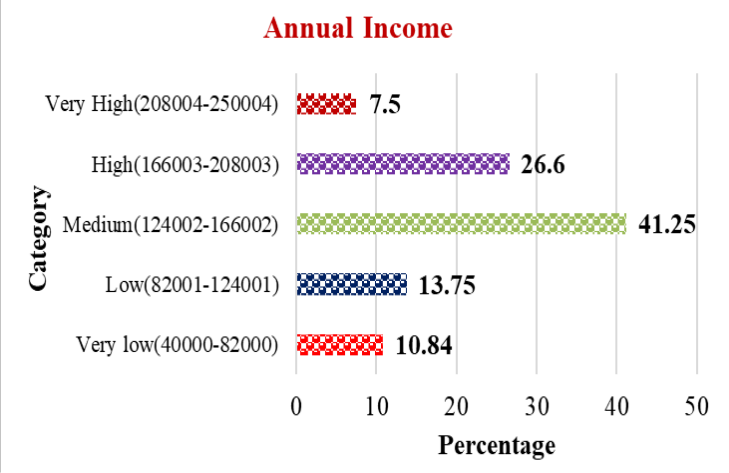 Figure 8Page 7
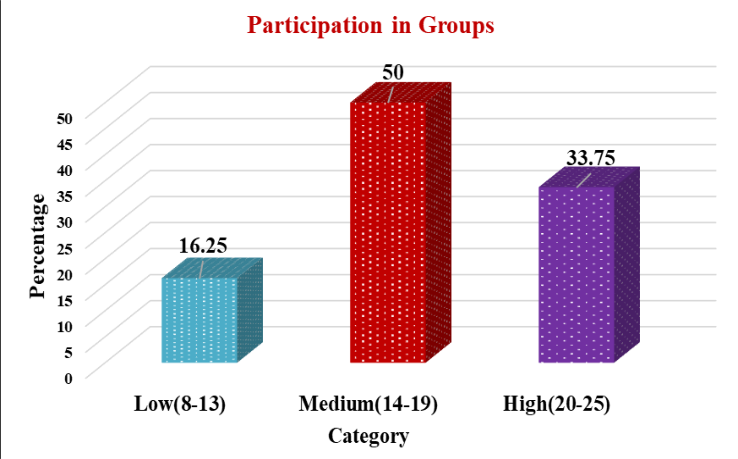 Figure 9Page 7
 Table 10Page 8
 Table 11Page 8
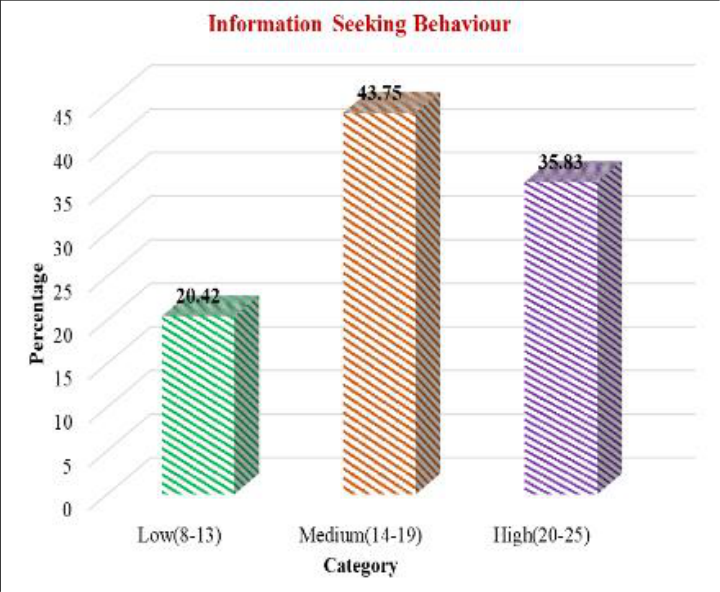 Figure 10Page 8
 Table 12Page 9
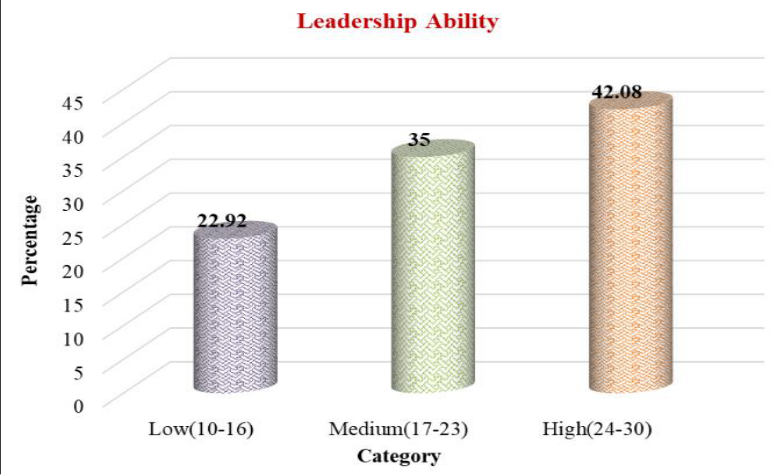 Figure 11Page 9
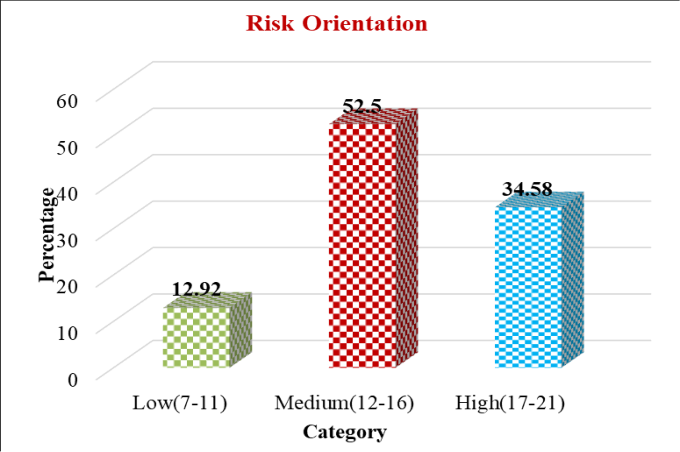 Figure 12Page 9
 Table 13Page 10
 Table 14Page 10
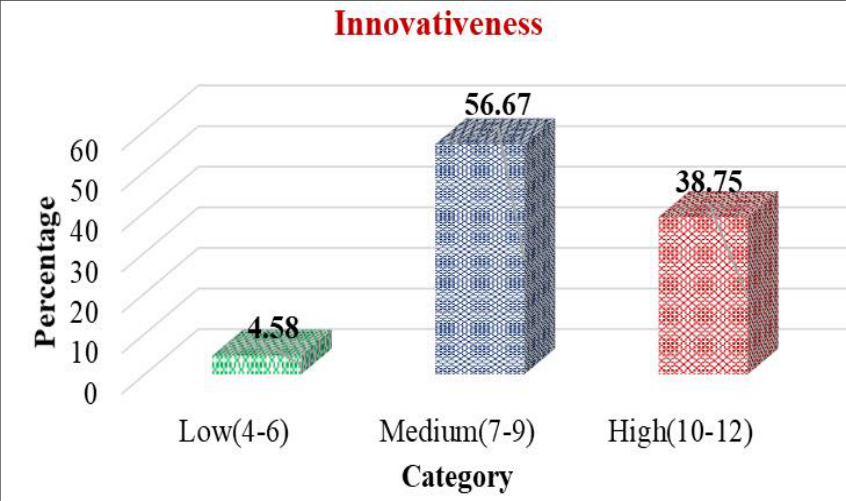 Figure 13Page 10
 Table 15Page 11
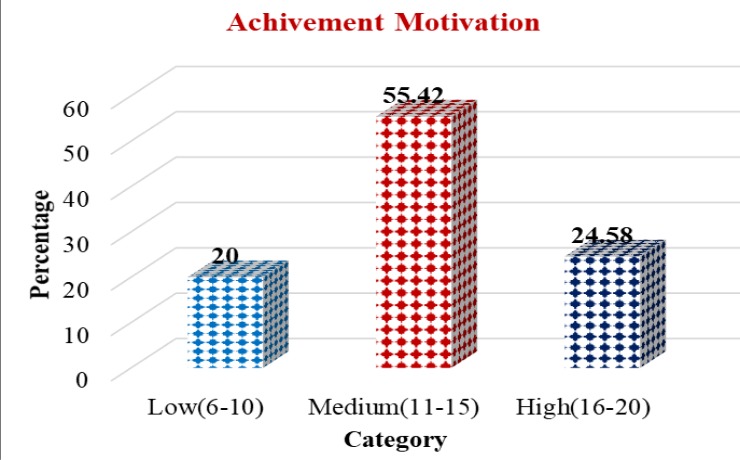 Figure 14Page 11
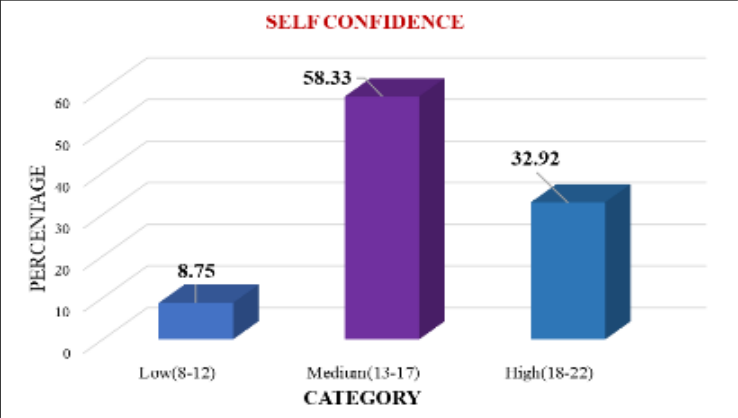 Figure 15Page 11
 Table 16Page 12
 Table 17Page 12
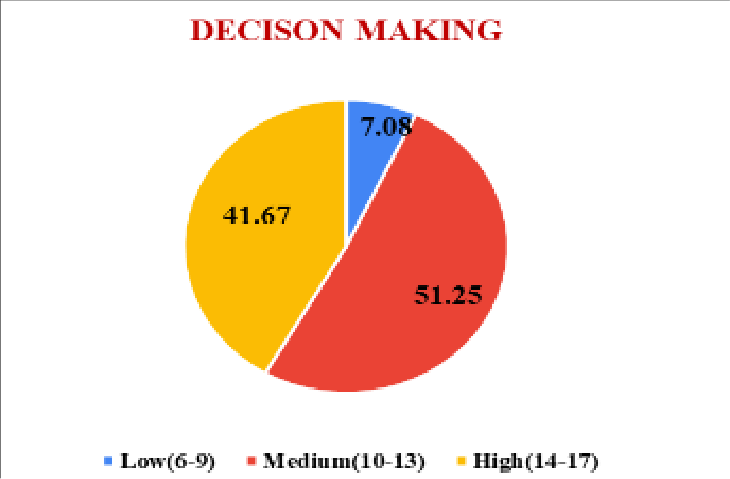 Figure 16Page 12
 Table 18Page 13
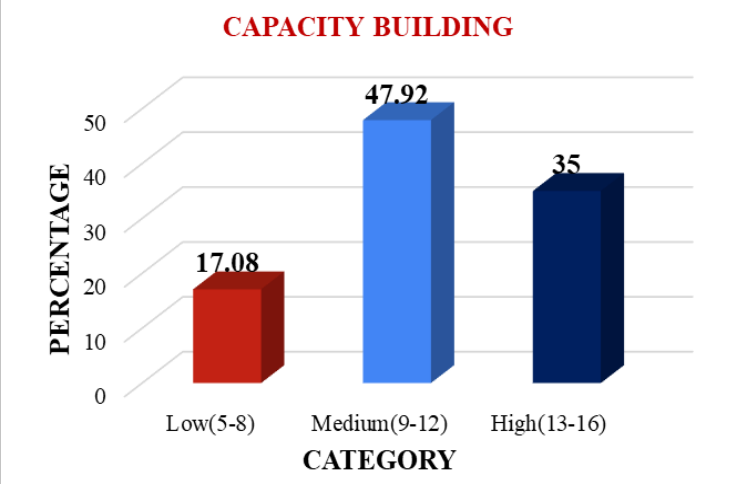 Figure 17Page 13
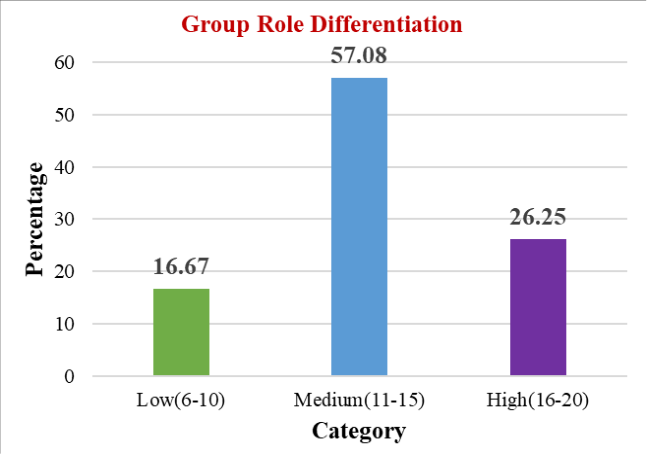 Fig18Page 13
 Table 19Page 14
 Table 20Page 14
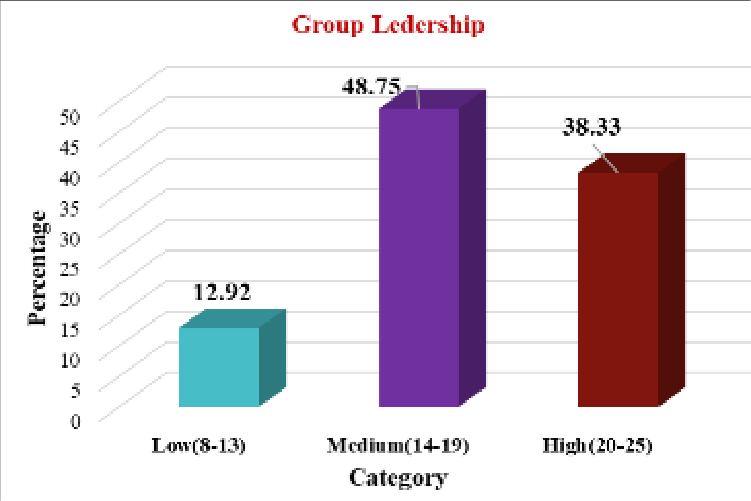 Figure 19Page 14
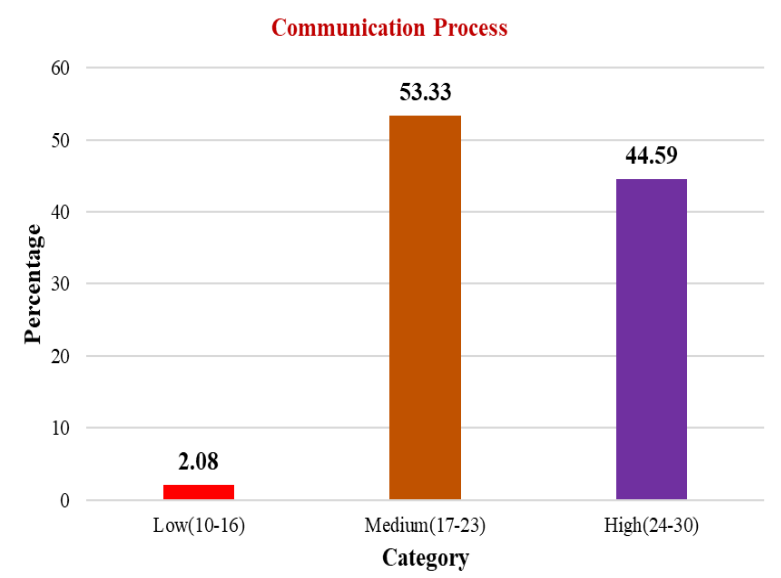 Figure 20Page 15
Introduction
In many developing regions, including Bihar in northern India, small and marginal farmers face significant challenges such as fragmented landholdings, limited access to markets and resources, and low bargaining power. Farmer Producer Organizations (FPOs) have emerged as a collective strategy to address these issues by pooling resources and enhancing farmers' market access, input procurement, and overall socio-economic well-being. This study investigates the impact of FPOs on the socioeconomic conditions of farmers in northern Bihar, focusing on Muzaffarpur and Samastipur districts. These districts were purposively selected due to their high poverty rates and limited resource accessibility, which are critical factors influencing the effectiveness of FPO interventions. By examining these contexts, the research aims to provide empirical insights into how FPOs contribute to improving livelihoods, income levels, and agricultural sustainability among smallholder farmers. The study encompasses a diverse sample of FPOs and farmers, utilizing an ex-postfacto research design to explore the nuanced socio-economic dynamics shaped by FPO membership and operations. Understanding these dynamics is crucial for informing policy and practice aimed at enhancing the resilience and prosperity of smallholder farmers through collective action and institutional support provided by FPOs
Methodology
This study adopts an ex-post-facto research design to systematically examine the socio-economic impact of Farmer Producer Organizations (FPOs) on farmers in the northern region of Bihar. The research focuses on Muzaffarpur and Samastipur districts, strategically selected for their high poverty rates and limited resource accessibility, which significantly influence the effectiveness of FPOs. Specific blocks within these districts-Saraiya, www.extensionjournal.com Utpadak Producer Company Limited, Adarsh Jiva Bikash Krishi Bagbani Swabalambi Sahakari Samiti Limited, and Pusa Farmer Producer Company Limited, covering a range of agricultural commodities. A total of 240 respondents, with 40 from each FPO, were randomly sampled to ensure a representative socio-economic cross-section of farmers. This methodological approach aims to provide comprehensive insights into how FPOs impact the socioeconomic conditions and livelihoods of small and marginal farmers in Bihar's disadvantaged regions. The demographic distribution reveals that middle-aged farmers are prominently represented within Farmer Producer Organizations (FPOs), constituting more than half of the sample. Their involvement can be attributed to their extensive experience in agriculture and family management, motivating them to join FPOs to enhance farm profitability and sustainability through the adoption of modern agricultural practices. The findings were in agreement with the results of studies conducted by Raghavendra et al.
(2005) [2] , Bikadakatti et al. (2011) [2] , Akkamahadevi (2016) [4] .
Fig 1:
Classification of respondents according to Age
Education
The education levels among respondent farmers show a diverse distribution, with the majority having completed high school (37.1%), followed by those who have completed primary school (23.8%) and higher secondary education (16.7%). A smaller proportion includes graduates (4.6%), while 16.7% can read and write. The data indicate a varied educational background among members of Farmer Producer Organizations (FPOs), highlighting significant levels of education beyond basic literacy. The diverse educational background observed among FPO members underscores their readiness to adopt innovations and embrace changes in agricultural practices. Educated farmers, particularly those with higher levels of education, are more likely to participate actively in FPOs. Their involvement signifies a proactive approach in leveraging collective efforts for socio-economic advancement within the agricultural sector. Similar results were observed in the study of Raghavendra et al. (2005) [2] , Gopinath (2005), Bikadakatti et al. (2011) [2] , Akkamahadevi (2016) [4] . The predominance of the general category among FPO members reflects broader socio-economic dynamics influencing membership patterns. This distribution underscores the need for inclusive development strategies within FPOs to ensure equitable participation and benefits across different caste groups. Understanding these demographic patterns is crucial for designing interventions that promote inclusive growth and mitigate socio-economic disparities among agricultural communities. The findings inline with the results for Darshan, 2019 [3] . Large(>10 ha) 6 2.5
The dominance of small and marginal farmers within FPOs underscores the pivotal role these organizations play in supporting economically vulnerable agricultural segments. By facilitating collective action and pooling of resources, FPOs empower smaller farmers to enhance their market access, adopt modern technologies, and improve their overall economic resilience and sustainability. This distribution highlights the importance of tailored support mechanisms within FPOs to address the specific needs and challenges faced by different categories of farmers based on their landholding sizes. Similar results were observed in the studies of Bikadakatti et al. (2011) [2] , Akkamahadevi (2016) [4] and Rajput et al. (2016) [5] .
. Family Size
The distribution of respondents according to family size categories within FPOs shows that 24.6% belong to small families (<5 members), 68.3% to medium-sized families (5-8 members), and 7.1% to large families (>8 members). [2] . www.extensionjournal.com High(32-39) 78 32.5
The distribution of farming experience among FPO members reflects a blend of seasoned and relatively newer farmers actively engaged in collective farming initiatives. This diversity in experience levels within FPOs facilitates the exchange of knowledge and adoption of innovative agricultural practices, contributing to enhanced productivity and resilience in farming operations. Experienced farmers bring valuable insights and leadership, while newer members contribute fresh perspectives and enthusiasm, collectively driving the agricultural development agenda forward. The study of Bikadakatti et al. (2011) [2] also expressed similar results as that of the present study. [3] .
3.1.8Annual Income
The distribution of respondents according to annual income levels shows that the majority of FPO members fall within the medium (41.25%) and high (26.6%) income categories. This distribution reflects the positive economic impact of FPO membership, enabling farmers to secure better market prices, reduce input costs through collective purchasing, and access financial support more effectively. The income levels highlight the role of FPOs in improving farmers' economic stability and livelihoods. The significant proportion of FPO members in the medium and high-income categories underscores the effectiveness of collective action in enhancing agricultural profitability. By leveraging collective bargaining power and shared resources, FPOs empower farmers to overcome market challenges and achieve higher income levels. This outcome aligns with studies emphasizing the economic benefits of collective farming organizations. Moving forward, sustaining and expanding these economic gains requires continued support for market access, financial inclusion, and capacity building within FPOs. Similar results were observed in the studies of Bikadakatti et al. (2011) [2] , Akkamahadevi (2016) [4] and Rajput et al. (2016) [5] . www.extensionjournal.com [2] and Bikadakatti et al. (2011) [2] .
Fig 9:
Distribution of FPO Farmers according to their participation in groups www.extensionjournal.com
Information Seeking Behavior
The categorization of respondents according to their information-seeking behavior reveals that a majority demonstrate medium (43.75%) to high (35.83%) levels of information-seeking behavior. This proactive approach indicates a strong interest among FPO members in acquiring knowledge, adopting new agricultural practices, and staying updated with technological advancements. (2011) [2] , and Rajput et al. (2016) [5] .
Leadership Ability
The distribution of respondents according to their leadership ability shows that a significant majority (42.08%) possess high leadership ability, followed by medium (35%) and low (22.92%) categories. This distribution underscores the diverse leadership strengths within FPOs, crucial for organizational effectiveness and member engagement. [3] . www.extensionjournal.com
Risk Orientation
The categorization of respondents based on their risk orientation reveals that a majority (52.5%) exhibit medium risk orientation, followed by high (34.58%) and low (12.92%) orientations. This distribution reflects farmers' attitudes towards adopting innovative practices and managing agricultural risks effectively. The categorization of FPO farmers based on risk orientation reveals a predominant medium risk orientation (52.5%), followed by high (34.58%) and low (12.92%) orientations. This distribution underscores farmers' readiness to adopt innovative practices and manage agricultural risks effectively. Medium to high levels of risk orientation indicate a proactive approach towards leveraging new opportunities and integrating technology in agricultural operations. Cultivating an environment that supports informed risk-taking while mitigating potential hazards is essential for enhancing agricultural productivity, fostering resilience, and sustaining competitiveness within FPOs. Similar results were observed in the studies of Chidananda (2008), Sidram (2008) [2] and Akkamahadevi (2016) [4] .
Fig 12:
Distribution of FPO Farmers according to their leadership ability www.extensionjournal.com
Innovativeness
The distribution of respondents according to their innovativeness shows that a majority (56.67%) possess medium innovativeness, followed by high (38.75%) and low (4.58%) levels. This distribution highlights the propensity of FPO members to adopt new agricultural technologies and practices. [2] and Akkamahadevi (2016) [4] .
Fig 13:
Distribution of FPO Farmers according to their innovativeness
Achievement Motivation
The categorization of respondents based on their achievement motivation reveals that a majority (55.42%) demonstrate medium motivation, followed by high (25.48%) and low (20%) levels. This distribution reflects farmers' drive to set and achieve goals for personal and organizational growth. [4] . www.extensionjournal.com
Self-Confidence
The distribution of FPO members according to their selfconfidence levels shows that a majority possess medium (58.33%) to high (32.92%) self-confidence, with a minority exhibiting low (8.75%) levels. This distribution underscores the self-assurance and belief in capabilities among FPO members. The distribution of self-confidence levels among FPO members reveals that a majority (58.33%) possess medium self-confidence, with 32.92% exhibiting high levels and a smaller proportion (8.75%) demonstrating low levels. This distribution highlights the significant self-assurance and belief in capabilities among FPO farmers. Medium to high levels of self-confidence empower farmers to take proactive steps, make sound decisions, and effectively manage challenges in agricultural practices. Individuals with higher self-confidence are more inclined to embrace risks, seek out new opportunities, and actively contribute to the collective achievements of FPOs. Strengthening self-confidence through targeted skill development, mentorship programs, and peer support networks is crucial for nurturing leadership qualities and enhancing resilience within agricultural communities. The findings inline with the outcomes of Darshan (2019) [3] .
Fig 15:
Distribution of FPO Farmers according to their self-confidence www.extensionjournal.com
Decision-Making Power
The distribution of FPO members based on their decisionmaking power reveals that a majority (51.25%) have medium authority, followed by high (41.67%) and low (7.08%) levels. This distribution reflects the decentralized decision-making structure within FPOs. [2] obtained the similar results of current study. [3] .
Fig18: Graphical Representation of FPO members according to group role differentiation www.extensionjournal.com [5] . [5] . This study reveals a predominant trend towards moderate to high levels of communication proficiency among members, reflecting robust channels for information dissemination, decisionmaking, and collaborative action. Such effective communication not only enhances operational efficiency but also cultivates a culture of transparency and shared responsibility within FPOs. By nurturing communication skills and leveraging technological advancements, FPOs can strengthen their capacity to navigate agricultural challenges, harness collective knowledge, and drive sustainable development initiatives that benefit rural communities. The results in line with the findings of Darshan (2019) [3] . www.extensionjournal.com
Conclusion
The study investigates the impact of Farmer Producer Organizations (FPOs) on smallholder farmers in Bihar's Muzaffarpur and Samastipur districts, addressing challenges such as fragmented landholdings and limited market access. By employing an ex-post-facto research design, the study reveals that FPOs play a crucial role in enhancing socioeconomic conditions. The majority of FPO members are middle-aged, educated up to high school level, and predominantly from general and OBC castes, with marginal and small landholdings. They demonstrate medium to high levels of mechanization, income, and participation in FPO activities. This collective action not only improves agricultural productivity and market access but also fosters resilience and socio-economic empowerment among smallholder farmers in northern Bihar.
Figures and tables from the paper
| SL. No | Category | Frequency (N=240) | Percentage (%) |
|---|---|---|---|
| 1. | Young Age (18-35yrs) | 79 | 32.9 |
| 2. | Middle Age (>35-55yrs) | 129 | 53.8 |
| 3. | Old Age (Above 55 yrs) | 32 | 13.3 |
Table text extracted from the original PDF; superscript letters are shown inline. The original table image is below.
View original table image
| SL. No | Category | Frequency (N=240) | Percentage (%) |
|---|---|---|---|
| 1. | Illiterate | 3 | 1.3 |
| 2. | Can read and write | 40 | 16.7 |
| 3. | Primary School | 57 | 23.8 |
| 4. | High School | 89 | 37.1 |
| 5. | Higher secondary | 40 | 16.7 |
| 6. | Graduate and above | 11 | 4.6 |
Table text extracted from the original PDF; superscript letters are shown inline. The original table image is below.
View original table image
| SL No | Category | Frequency (N=240) | Percentage (%) |
|---|---|---|---|
| 1. | General | 111 | 46.28 |
| 2. | OBC | 82 | 34.22 |
| 3. | SC | 40 | 16.7 |
| 4. | ST | 7 | 2.8 |
Table text extracted from the original PDF; superscript letters are shown inline. The original table image is below.
View original table image
| SL No | Category | Frequency (N=240) | Percentage (%) |
|---|---|---|---|
| 1. | Marginal(<1 ha) | 116 | 48.3 |
| 2. | Small(1-2 ha) | 61 | 25.4 |
| 3. | Semi medium(2-4 ha) | 15 | 6.3 |
| 4. | Medium(4-10 ha) | 42 | 17.5 |
| 5. | Large(>10 ha) | 6 | 2.5 |
Table text extracted from the original PDF; superscript letters are shown inline. The original table image is below.
View original table image
| SL No | Category | Frequency (N=240) | Percentage (%) |
|---|---|---|---|
| 1. | Small(<5 members) | 59 | 24.6 |
| 2. | Medium(5-8) | 164 | 68.3 |
| 3. | Large(>8) | 17 | 7.1 |
Table text extracted from the original PDF; superscript letters are shown inline. The original table image is below.
View original table image
| Sl. No | Category(yrs.) | Frequency (N=240) | Percentage (%) |
|---|---|---|---|
| 1. | Low(15-23) | 66 | 27.5 |
| 2. | Medium(24-31) | 96 | 40 |
| 3. | High(32-39) | 78 | 32.5 |
Table text extracted from the original PDF; superscript letters are shown inline. The original table image is below.
View original table image
| SL. NO | Category | Frequency (N=240)) | Percentage(%) |
|---|---|---|---|
| 1. | Low(6-11) | 38 | 15.83 |
| 2. | Medium(12-17) | 144 | 60 |
| 3. | High(18-23) | 58 | 24.17 |
Table text extracted from the original PDF; superscript letters are shown inline. The original table image is below.
View original table image
| SL. No | Category | Frequency (N=240) | Percentage (%) |
|---|---|---|---|
| 1. | Very low (<82,000) | 26 | 10.84 |
| 2. | Low (82001-124001) | 33 | 13.75 |
| 3. | Medium (1,24,002-1,66,002) | 99 | 41.25 |
| 4. | High (1,66003-2,08,003) | 64 | 26.6 |
| 5. | Very High (2,08,004-2,50,004) | 18 | 7.5 |
Table text extracted from the original PDF; superscript letters are shown inline. The original table image is below.
View original table image
| SL. No | Category | Frequency (N=240)) | Percentage (%) |
|---|---|---|---|
| 1. | Low(8-13) | 39 | 16.25 |
| 2. | Medium(14-19) | 120 | 50 |
| 3. | High(20-25) | 81 | 33.75 |
Table text extracted from the original PDF; superscript letters are shown inline. The original table image is below.
View original table image
| SL. No | Category | Frequency (N=240)) | Percentage (%) |
|---|---|---|---|
| 1. | Low (8-13) | 49 | 20.42 |
| 2. | Medium (14-19) | 105 | 43.75 |
| 3. | High (20-25) | 86 | 35.83 |
Table text extracted from the original PDF; superscript letters are shown inline. The original table image is below.
View original table image
| SL. No | Category | Frequency (N=240)) | Percentage (%) |
|---|---|---|---|
| 1. | Low (10-16) | 55 | 22.92 |
| 2. | Medium (17-23) | 84 | 35 |
| 3. | High (24-30) | 101 | 42.08 |
Table text extracted from the original PDF; superscript letters are shown inline. The original table image is below.
View original table image
| SL. No | Category | Frequency (N=240)) | Percentage (%) |
|---|---|---|---|
| 1. | Low (7-11) | 31 | 12.92 |
| 2. | Medium (12-16) | 126 | 52.5 |
| 3. | High (17-21) | 83 | 34.58 |
Table text extracted from the original PDF; superscript letters are shown inline. The original table image is below.
View original table image
| SL. No | Category | Frequency (N=240)) | Percentage (%) |
|---|---|---|---|
| 1. | Low(4-6) | 11 | 4.58 |
| 2. | Medium(7-9) | 136 | 56.67 |
| 3. | High(10-12) | 93 | 38.75 |
Table text extracted from the original PDF; superscript letters are shown inline. The original table image is below.
View original table image
| SL. No | Category | Frequency (N=240)) | Percentage (%) |
|---|---|---|---|
| 1. | Low (6-10) | 11 | 20 |
| 2. | Medium (11-15) | 136 | 55.42 |
| 3. | High (16-20) | 93 | 25.48 |
Table text extracted from the original PDF; superscript letters are shown inline. The original table image is below.
View original table image
| SL. No | Category | Frequency (N=240) | Percentage (%) |
|---|---|---|---|
| 1. | Low (8-12) | 21 | 8.75 |
| 2. | Medium (13-17) | 140 | 58.33 |
| 3. | High (18-22) | 79 | 32.92 |
Table text extracted from the original PDF; superscript letters are shown inline. The original table image is below.
View original table image
| SL No | Category | Frequency (N=240) | Percentage (%) |
|---|---|---|---|
| 1. | Low(6-9) | 17 | 7.08 |
| 2. | Medium(10-13) | 123 | 51.25 |
| 3. | High(14-17) | 100 | 41.67 |
Table text extracted from the original PDF; superscript letters are shown inline. The original table image is below.
View original table image
| SL No | Category | Frequency (N=240) | Percentage (%) |
|---|---|---|---|
| 1. | Low (5-8) | 41 | 17.08 |
| 2. | Medium (9-12) | 115 | 47.92 |
| 3. | High (13-16) | 84 | 35 |
Table text extracted from the original PDF; superscript letters are shown inline. The original table image is below.
View original table image
| SL No | Category | Frequency (N=240) | Percentage (%) |
|---|---|---|---|
| 1. 1 | Low | 40 | 16.67% |
| 2. | Medium | 137 | 57.08% |
| 3. | High | 63 | 26.25% |
Table text extracted from the original PDF; superscript letters are shown inline. The original table image is below.
View original table image
| SL No | Category | Frequency (N=240) | Percentage (%) |
|---|---|---|---|
| 1. | Low | 31 | 12.92 |
| 2. | Medium | 117 | 48.75 |
| 3. | High | 92 | 38.33 |
Table text extracted from the original PDF; superscript letters are shown inline. The original table image is below.
View original table image
| SL. No | Category | Frequency (N=240) | Percentage (%) |
|---|---|---|---|
| 1. | Low | 5 | 2.08 |
| 2. | Medium | 128 | 53.33 |
| 3. | High | 107 | 44.59 |
Table text extracted from the original PDF; superscript letters are shown inline. The original table image is below.
View original table image
References
5 in the original paper- Akkamahadevi P. Performance evaluation of Farmer Producer Organizations (FPOs) in Karnataka: A case study of selected districts. Journal of Agribusiness and Rural Development. 2016;40(3):287-298.
- Bikadakatti RS, Raghavendra MR, Gopinath C, Sidram A. Role of Farmer Producer Organizations (FPOs) in enhancing farm productivity and income levels: Evidence from Karnataka. Journal of Agricultural Development and Policy Research. 2011;3(2):045-056.
- Darshan BB. Socio-economic impact of Farmer Producer Organizations (FPOs) on farmers in rural Karnataka. Indian Journal of Agricultural Economics. 2019;74(3):382-394.
- Raghavendra MR, Bikadakatti RS, Akkamahadevi P, Rajput SR. Impact assessment of Farmer Producer Organizations (FPOs) in Karnataka. Agricultural Economics Research Review. 2016;29(1):107-116.
- Rajput SR, Darshan BB, Bikadakatti RS, Gopinath C. Socio-economic impact of Farmer Producer Organizations (FPOs) on smallholder farmers: A case study from Karnataka. Indian Journal of Agricultural Economics. 2016;71(4):523-535.
Cited by 1
From OpenAlex, OpenCitations and reference lists read by Scinovex
- A scale to measure the entrepreneurial capacities of turmeric growers in farmer producer organisations
BVSGS Deepika, T Gopikrishna, V Jyothi, A. V. Nagavani, Shaik Nafeez Umar · International Journal of Agriculture Extension and Social Development · 2026
Farmer Producer Organisations provide smallholders with access to inputs, markets, and collective bargaining; however, the advantages rely on the ability of individual members to operate as entrepreneurs on their farms. There is a lack of crop-specific tools that reflect this ability among turmeric farmers. This research created and standardized a tool to assess the entrepreneurial capacities of turmeric producers linked to FPOs in Andhra Pradesh. Entrepreneurial capacity was defined through nine dimensions: achievement motivation, risk-taking ability, innovativeness, decision-making ability,