
Research article · 2024 · Full text
International Journal of Agriculture Extension and Social DevelopmentEconomic sustainability of Gaushalas in Southern Karnataka
Volume 7(6) · Pages 355–360 · DOI: 10.33545/26180723.2024.v7.i6e.725 ↗
Research areasLivestock Management and Performance ImprovementAgricultural Systems and Practices
Abstract
Author-writtenGaushalas are considered to be the best alternative to manage the increasing stray cattle population. Since Gaushalas have to take care of mostly unproductive animals and supported largely by charity, they need to be economically self-sustainable. In this paper an attempt has been to study the economic sustainability of Gaushalas in southern Karnataka state. A sample of 18 Gaushalas drawn from 13 districts of Southern Karnataka was considered for the study. Both the primary and secondary data were collected for the period 2015 to 2019 and analysed. The primary source of income for Gaushalas was donations (64%) followed by government grants (23%) and sales (11%). The major expenditure was towards feed and fodder (68%) followed by labour expenses (18%). The operating ratio for all the Gaushalas was found to be 0.69 indicating that 69% of gross income was used to cover the working expenses. But on long term basis some Gaushalas were not able to cover their total expenses as they had negative net income. Economic Sustainability Index (ESI) was computed using net income per animal, returns over variable cost, self-sufficiency, dependency and percentage of productive animals. About 39% of Gaushalas were less sustainable (ESI< 0.33), 55% moderately sustainable (0.33 <ESI < 0.66) and only 6% were under high sustainable category (ESI > 0.66). It was observed that Gaushalas were largely dependent on public donations and Government grants which makes them less sustainable. So, there is a need to diversify income sources such as income from sale of milk, milk products and other by-products besides exploring efficient marketing channels.
Summary
Source-checkedPlain-language reading of the full paper, prepared with AI and checked against the text. Each point links to the authors' own words.
Why it matters
- Gaushalas serve as a primary method for managing the growing population of stray cattle. View evidence ↗
- Because they primarily care for unproductive animals and rely on charity, it is critical for Gaushalas to achieve economic self-sustainability. View evidence ↗
- As of 2019, India had 50.22 lakh stray cattle, with 77,000 of those located in Karnataka. View evidence ↗
The question
- The study aims to evaluate the economic sustainability of Gaushalas located in the southern region of Karnataka state. View evidence ↗
What they did
- The researchers sampled 18 Gaushalas across 13 districts in Southern Karnataka. View evidence ↗
- Data were collected and averaged over a five-year period from 2015 to 2019. View evidence ↗
- The Economic Sustainability Index (ESI) was calculated based on five indicators: net income per animal, returns over variable cost, self-sufficiency, dependency, and the percentage of productive animals. View evidence ↗
What they found
- Donations were the main income source (64%), followed by government grants (23%) and sales (11%). View evidence ↗
- The highest expenditures were for feed and fodder (68%) and labor (18%). View evidence ↗
- The overall operating ratio was 0.69, meaning 69% of gross income was spent on working expenses. View evidence ↗
- Sustainability levels varied, with 39% of Gaushalas being less sustainable, 55% moderately sustainable, and only 6% highly sustainable. View evidence ↗
- Returns over variable cost ranged from a high of ₹16,740 per animal in Chitradurga-2 to a low of ₹3.33 per animal in Hassan. View evidence ↗
- Ramanagara had the highest percentage of productive animals (80.17%), while Bengaluru urban-3 had 49.12%. View evidence ↗
What it means
- The authors recommend diversifying income through the sale of milk, milk products, and by-products, and improving marketing channels. View evidence ↗
- The authors suggest that the government should encourage Gaushalas outside cities and restrict those within cities, as rural locations offer more grazing land and lower feed costs. View evidence ↗
Visual summary
1 visualsIllustrations explain the paper; charts are replotted from the paper's own table values.
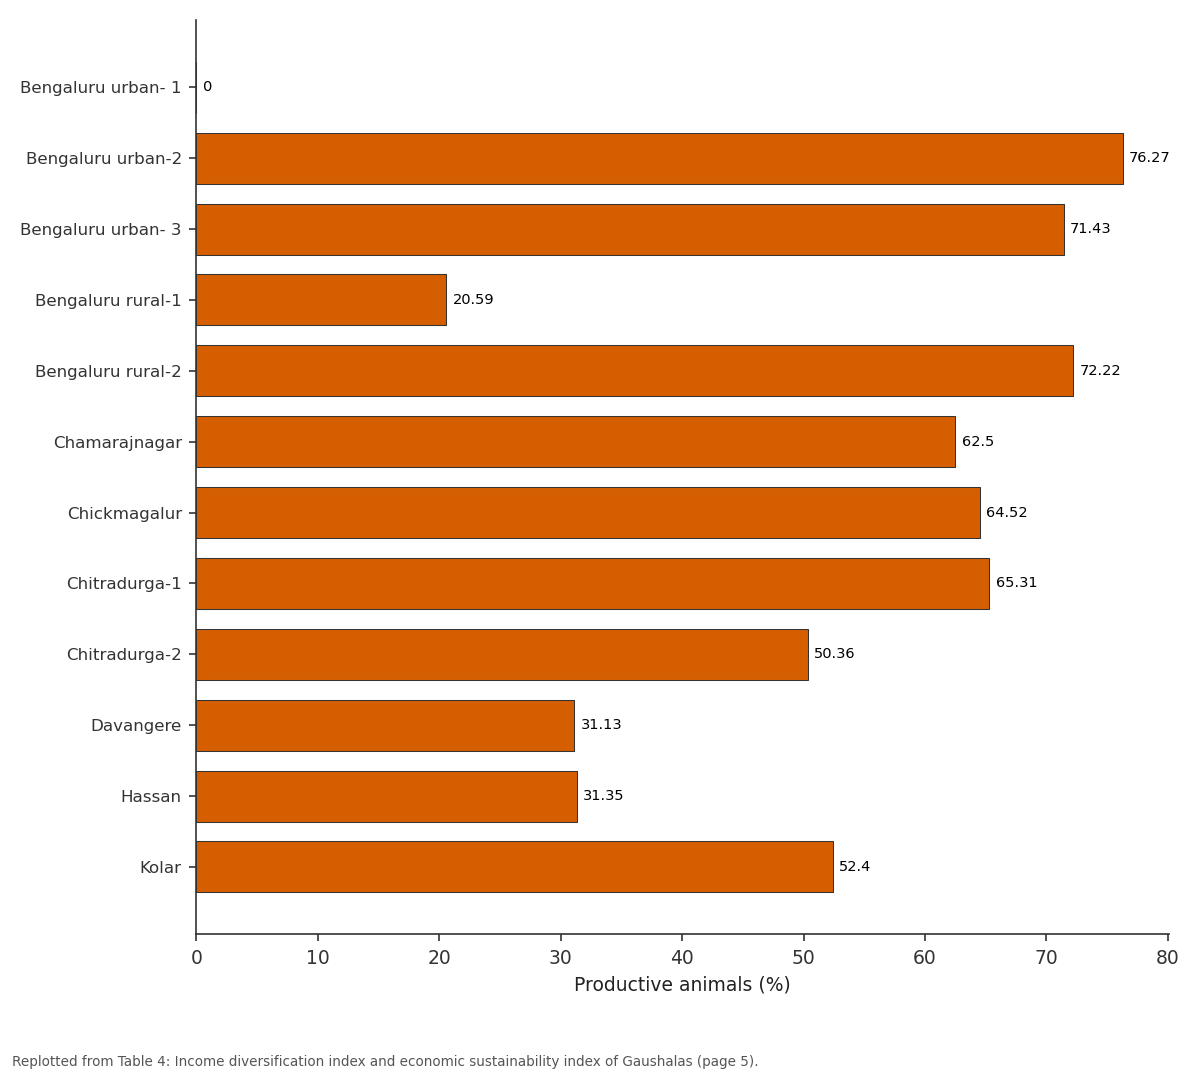
Dependency (%): Bengaluru urban- 1 vs Bengaluru urban-2 vs Bengaluru urban- 3 vs Bengaluru rural-1 vs Bengaluru rural-2
Replotted from Table 4 (page 5) of the original paper. Every bar is the paper's own table value.
View source evidence ↗Figures & tables
From the original paper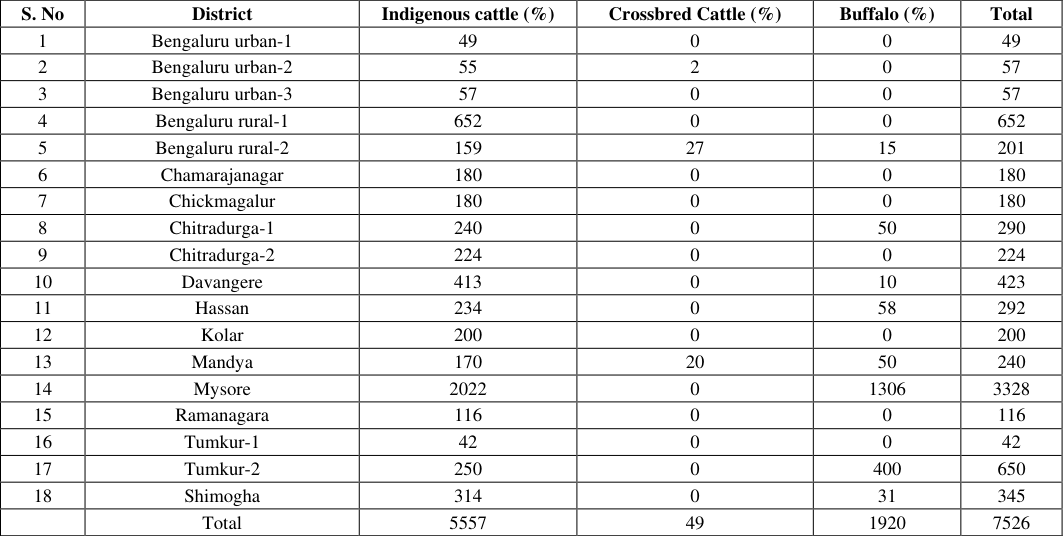 Table 1
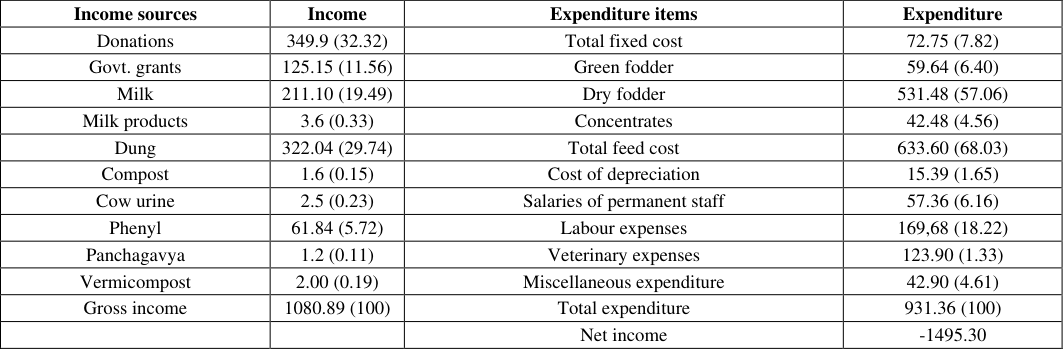 Table 2
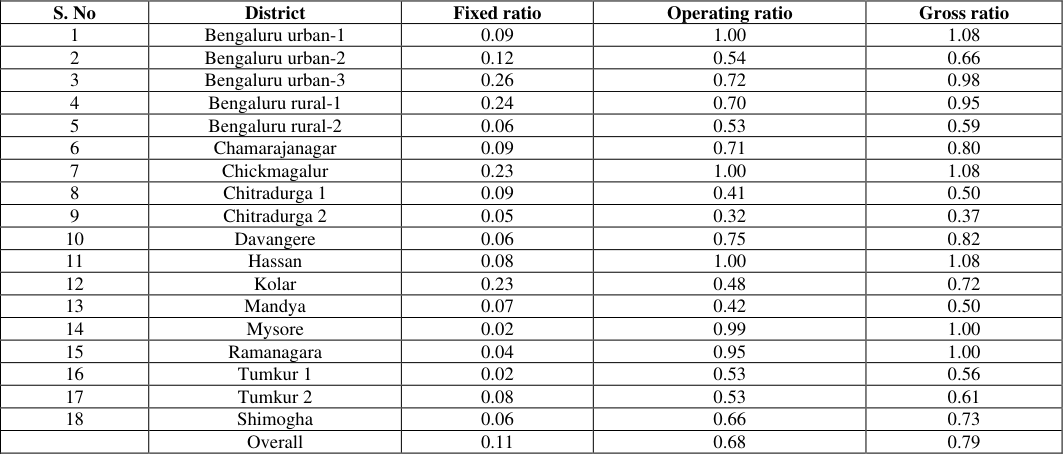 Table 3
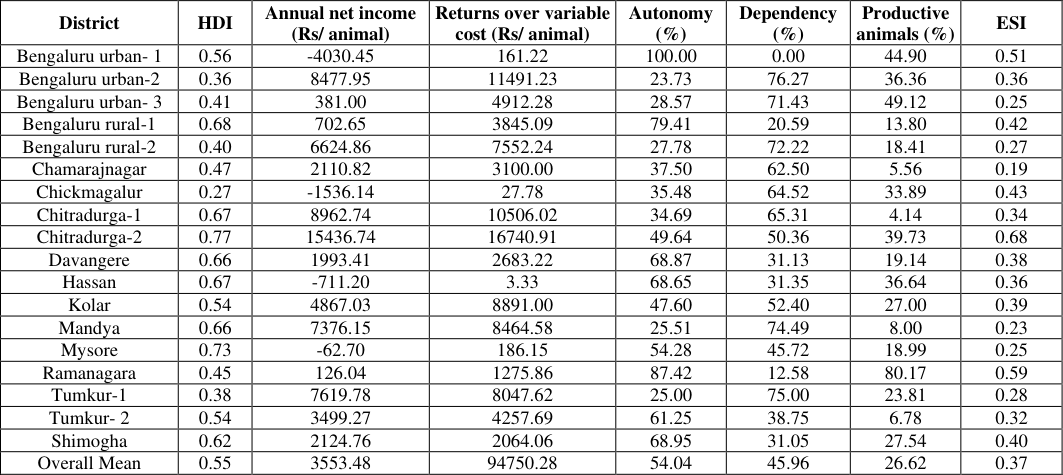 Table 4
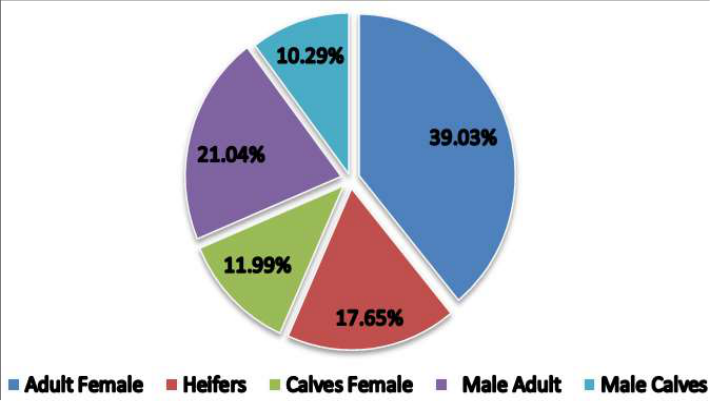 Figure 1
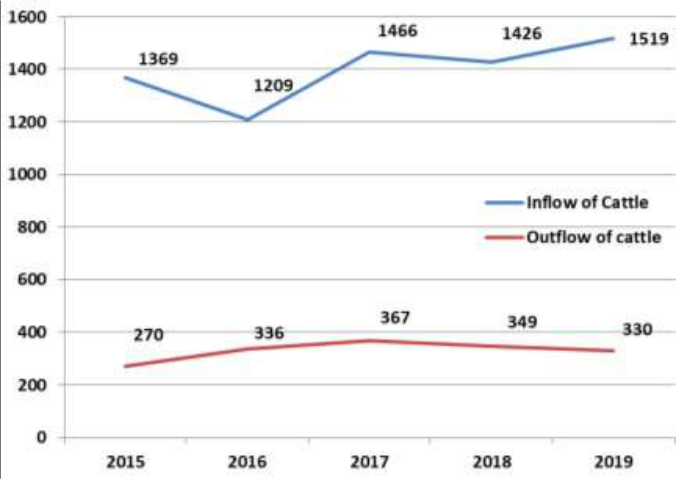 Figure 2
Introduction
Animals normally become less productive and uneconomical once they complete 6th to 8th lactation (Bijila and Singh, 2019) [1] . With the rising shortages of feed and fodder and their prices, the individual farmers face difficulty in maintaining the unproductive and old cattle. All these uneconomical animals are either found on the roads or end up in the slaughterhouses. The ban on cow slaughter in many states of the country has further added to stray cattle population. Currently there are 50.22 lakh stray cattle in the country, of which 77,000 stray cattle are found in Karnataka (DAHD&F, 2019). Gaushala's primary aim is to provide shelter for stray cattle, improving the health and life of infirm, unproductive, diseased and abandoned cattle. Gaushalas assist to preserve the Indian germplasm (Yadav and Vij, 2010) [9] and cow offspring. Some Gaushalas are engaged in upgrading the local breeds and using them to supply pure milk and other by-products made from cow dung and cow urine and supply to the villagers with good female calves for dairying and bullocks for agricultural purposes. There are 160 registered Gaushalas in Karnataka state (Mandi et al. 2018) [4] . Out of this, 22 Gaushalas are recognized by the Animal Welfare Board of India (AWBI).
The Department of Animal Husbandry and Fisheries, Karnataka provides necessary financial assistance for select registered Gaushalas and AWBI provides necessary grants and fund only for charitable, non-profit organization to meet the minimum expenditure for running the Gaushalas. Most of the Gaushalas in the State are registered under different acts and legislations like Karnataka Goseva Ayog, 2013, Societies Registration Act, 1860 and Karnataka Societies Act, 1960. Karnataka State Goseva Ayog, 2013 was constituted by the Government of Karnataka to coordinate and advice different laws implementing departments to save valuable livestock resources of the State (Mandi et al. 2018) [4] . An apex body called Karnataka Gaushala Federation has been formed which represents all the Gaushalas for the protection of animals in legal affairs and to strengthen animal welfare in the State (Mandi et al. 2018) [4] . Apart from these, various State government organizations like Mysore Pinjrapole Society and Karnataka State Animal Husbandry and Fisheries Department grant some financial aids and extend veterinary services to the Gaushalas. However, These Gaushalas face numerous problems on the financial front owing to absence of public assistance, inadequate government support, delay in financing and insufficient space and feed shortage. Though there are a few www.extensionjournal.com studies on constraints faced by Gaushalas (Ponnusamy et al. 2017 and Mandi et al. 2018) [7,4] there is only one systematic study which was conducted in Haryana on economic aspects of Gaushalas (Bijila and Singh, 2019) [1] . This paper attempts to study economic sustainability of Gaushalas in southern Karnataka state.
Materials and Methods
Materials and Methods
Study area and sampling
Karnataka state is located in southern part of India and has 31 administrative districts in Karnataka. A sample of 18 Gaushalas spread over 13 districts of Southern Karnataka was considered for the study. The official records and meeting with the responsible persons of the management using a pretested interview schedule were the data collection methods. The data were tabulated at district level for five consecutive years from 2015 to 2019 and average value was taken for analysis.
Analytical techniques Ratio analysis
Ratio analysis was attempted to study the economics of Gaushalas. The following ratios were worked out.
Income diversification index
Herfindahl-Hirschman Index (HHI) was computed to know the extent of income diversification of Gaushalas. The degree of diversification can be measured using HHI as follows.
HHI= C Where C 1 , C 2 , C 3. C 9 = Proportion of different sources of income to total income of Gaushalas After calculation of HHI, Herfindahl Diversification Index (HDI) was calculated as: HDI = 1-HHI Higher the HDI value indicates higher the income diversification of the Gaushalas. Higher the income diversification of Gaushalas indicates higher the sustainability.
Economic sustainability of Gaushalas
The following economic indicators were worked out to arrive at Economic Sustainability Index (ESI).
Net income per animal
Net income has a positive effect on sustainability of Gaushalas.
Returns over variable cost
If this indicator comes out to be positive, then it shows that particular Gaushala is able to meet its variable cost.
Self-sufficiency/ Autonomy
Proportion of income obtained from the sales of Gaushala products to the total income. It includes the income sources other than obtained from government grants and donations.
Dependency
Dependency is calculated by computing the proportion of contribution of donations and government grants to total income. For a Gaushala to be sustainable, this indicator should be less.
Percentage of productive animals
The productive animals include in-milk and pregnant cows, in-milk and non-pregnant cows, pregnant heifers and service bulls. It has a positive effect on sustainability of Gaushalas.
The data normalization was done to bring all the indicators to a common scale using Min-max technique.
Where X i = Value of i th indicator i = 1, 2, 3 ………n indicators Differential weights were assigned to indicators following Bijila and Singh (2019) [1] which was worked out based on expert opinions. The aggregate ESI was calculated as follows
Where Gaushalas with ESI< 0.33 were considered as less sustainable, 0.33 <ESI < 0.66 were considered as moderately sustainable, while Gaushala with ESI > 0.66 were considered as highly sustainable.
Results and Discussion
Results and Discussion
Cattle population trends in Gaushalas
The herd composition of 18 Gaushalas studied is presented in Table 1. The Gaushalas considered in this study had a total of 7526 cattle. The range of cattle population in Gaushalas varied from maximum of 3328 in Mysore Gaushala to 42 animals in Tumkur-1 Gaushala. Of the total cattle 86 per cent were indigenous cattle, 13 per cent buffaloes followed by a meagre 1 per cent of crossbred. Among the indigenous cattle in the Gaushalas, most of them were old and unproductive cattle. Similar findings were also reported by Mandi et al. (2020) [6] that more than 95 per cent of the herd composition of 40 Gaushalas studied in Karnataka State was indigenous cattle followed by 5 percent of crossbred. The age-sex composition of cattle population is shown in Figure 1. The adult females constituted major portion of the total cattle population (39.03 per cent) followed by male adults (21.04 per cent). Figure 2 shows that there was an increasing trend in inflow of cattle population from 2016 to 2019 which included cattle abandoned by the farmers, the cattle rescued by the police officials from slaughter houses, cattle born in Gaushalas and the cattle purchased by the Gaushala management for having high genetic merit for breeding purposes. The outflow of cattle from Gaushalas was slightly decreasing which included cattle death in Gaushalas due to diseases, donation of heifers and male calves to progressive farmers for adoption and cattle sold.
| S. No | District | Indigenous cattle (%) | Crossbred Cattle (%) | Buffalo (%) | Total |
|---|---|---|---|---|---|
| 1 | Bengaluru urban-1 | 49 | 0 | 0 | 49 |
| 2 | Bengaluru urban-2 | 55 | 2 | 0 | 57 |
| 3 | Bengaluru urban-3 | 57 | 0 | 0 | 57 |
| 4 | Bengaluru rural-1 | 652 | 0 | 0 | 652 |
| 5 | Bengaluru rural-2 | 159 | 27 | 15 | 201 |
| 6 | Chamarajanagar | 180 | 0 | 0 | 180 |
| 7 | Chickmagalur | 180 | 0 | 0 | 180 |
| 8 | Chitradurga-1 | 240 | 0 | 50 | 290 |
| 9 | Chitradurga-2 | 224 | 0 | 0 | 224 |
| 10 | Davangere | 413 | 0 | 10 | 423 |
| 11 | Hassan | 234 | 0 | 58 | 292 |
| 12 | Kolar | 200 | 0 | 0 | 200 |
| 13 | Mandya | 170 | 20 | 50 | 240 |
| 14 | Mysore | 2022 | 0 | 1306 | 3328 |
| 15 | Ramanagara | 116 | 0 | 0 | 116 |
| 16 | Tumkur-1 | 42 | 0 | 0 | 42 |
| 17 | Tumkur-2 | 250 | 0 | 400 | 650 |
| 18 | Shimogha | 314 | 0 | 31 | 345 |
| Total | 5557 | 49 | 1920 | 7526 |
Table text extracted from the original PDF; superscript letters are shown inline. The original table image is below.
View original table image
Income and expenditure pattern of Gaushalas
The annual income and expenditure of the Gaushalas are presented in Table 2. The donation was the largest share (64.98%) to the overall revenue of the Gaushalas. The different sources of donations were charitable organisations, Gauseva Trusts, donation box, donation of temples, donation in festivals and cultural events, contribution of monthly donation by volunteer members, donation for feed and fodder and building sheds etc. The Government grants constituted 23.20% of the total revenue. In addition to these, Gaushalas also sell products such as milk, cow dung, manure, urine, arka, scrap sales, cattle sales, heifers, grain sales etc. The revenue from such sales contribute to the extent of 10.71%. The miscellaneous income included the discount received, interest on deposits and cow awards which accounts 3.16%. The major expenditure in the Gaushalas was on feed and fodder (68.03%) followed by labour expenses (18.22 per cent), fixed expenses (7.81%) of total expenses which included permanent employee wages (6.16%) and depreciation of inventory of Gaushalas contributed to the extent of 1.65 per cent. Similar findings were reported by Bijla and Singh (2018) [10] who stated that the feed and fodder cost accounted for 50 per cent followed by labour expenses of 10 per cent. Miscellaneous expenditure (5.94%) includes expenditure on repair and maintenance, office and stationary products, fuel, transport, utility and other expenses, kitchen, agricultural, cultural expenditure and sundry item expenditure. The expenses do not include land as these are donated. Gaushala's inventory includes cattle sheds, store of fodder, chaff cutters, office buildings, vehicles, machinery, and equipment.
| Income sources | Income | Expenditure items | Expenditure |
|---|---|---|---|
| Donations | 349.9 (32.32) | Total fixed cost | 72.75 (7.82) |
| Govt. grants | 125.15 (11.56) | Green fodder | 59.64 (6.40) |
| Milk | 211.10 (19.49) | Dry fodder | 531.48 (57.06) |
| Milk products | 3.6 (0.33) | Concentrates | 42.48 (4.56) |
| Dung | 322.04 (29.74) | Total feed cost | 633.60 (68.03) |
| Compost | 1.6 (0.15) | Cost of depreciation | 15.39 (1.65) |
| Cow urine | 2.5 (0.23) | Salaries of permanent staff | 57.36 (6.16) |
| Phenyl | 61.84 (5.72) | Labour expenses | 169,68 (18.22) |
| Panchagavya | 1.2 (0.11) | Veterinary expenses | 123.90 (1.33) |
| Vermicompost | 2.00 (0.19) | Miscellaneous expenditure | 42.90 (4.61) |
| Gross income | 1080.89 (100) | Total expenditure | 931.36 (100) |
| Net income | -1495.30 |
Table text extracted from the original PDF; superscript letters are shown inline. The original table image is below.
View original table image
Financial ratio analysis of Gaushalas
Ratio analysis is an important tool for understanding the profitability of the Gaushalas and other financial consequences. It consists of three ratios such as fixed, operating and gross ratio. The overall operating ratio of the Gaushalas was found to be 0.68, which means that 68 per cent of gross income was used to cover working expenses (Table 3). The Gaushalas were able to cover their working expenses, but on long term basis they were not able to cover their total expenses as some of the Gaushalas had a negative net income (Table 4), but return over variable cost was positive. The overall gross ratio was found to be 0.79. This means that these Gaushalas were spending about 79% of their income in covering their total expenses. The Gaushalas in Chickmagalur, Hassan and Bengaluru urban-1 were completely at loss which can be seen with a gross ratio more than one.
| District | HDI | Annual net income (Rs/ animal) | Returns over variable cost (Rs/ animal) | Autonomy (%) | Dependency (%) | Productive animals (%) | ESI |
|---|---|---|---|---|---|---|---|
| Bengaluru urban- 1 | 0.56 | -4030.45 | 161.22 | 100.00 | 0.00 | 44.90 | 0.51 |
| Bengaluru urban-2 | 0.36 | 8477.95 | 11491.23 | 23.73 | 76.27 | 36.36 | 0.36 |
| Bengaluru urban- 3 | 0.41 | 381.00 | 4912.28 | 28.57 | 71.43 | 49.12 | 0.25 |
| Bengaluru rural-1 | 0.68 | 702.65 | 3845.09 | 79.41 | 20.59 | 13.80 | 0.42 |
| Bengaluru rural-2 | 0.40 | 6624.86 | 7552.24 | 27.78 | 72.22 | 18.41 | 0.27 |
| Chamarajnagar | 0.47 | 2110.82 | 3100.00 | 37.50 | 62.50 | 5.56 | 0.19 |
| Chickmagalur | 0.27 | -1536.14 | 27.78 | 35.48 | 64.52 | 33.89 | 0.43 |
| Chitradurga-1 | 0.67 | 8962.74 | 10506.02 | 34.69 | 65.31 | 4.14 | 0.34 |
| Chitradurga-2 | 0.77 | 15436.74 | 16740.91 | 49.64 | 50.36 | 39.73 | 0.68 |
| Davangere | 0.66 | 1993.41 | 2683.22 | 68.87 | 31.13 | 19.14 | 0.38 |
| Hassan | 0.67 | -711.20 | 3.33 | 68.65 | 31.35 | 36.64 | 0.36 |
| Kolar | 0.54 | 4867.03 | 8891.00 | 47.60 | 52.40 | 27.00 | 0.39 |
| Mandya | 0.66 | 7376.15 | 8464.58 | 25.51 | 74.49 | 8.00 | 0.23 |
| Mysore | 0.73 | -62.70 | 186.15 | 54.28 | 45.72 | 18.99 | 0.25 |
| Ramanagara | 0.45 | 126.04 | 1275.86 | 87.42 | 12.58 | 80.17 | 0.59 |
| Tumkur-1 | 0.38 | 7619.78 | 8047.62 | 25.00 | 75.00 | 23.81 | 0.28 |
| Tumkur- 2 | 0.54 | 3499.27 | 4257.69 | 61.25 | 38.75 | 6.78 | 0.32 |
| Shimogha | 0.62 | 2124.76 | 2064.06 | 68.95 | 31.05 | 27.54 | 0.40 |
| Overall Mean | 0.55 | 3553.48 | 94750.28 | 54.04 | 45.96 | 26.62 | 0.37 |
Table text extracted from the original PDF; superscript letters are shown inline. The original table image is below.
View original table image
| S. No | District | Fixed ratio | Operating ratio | Gross ratio |
|---|---|---|---|---|
| 1 | Bengaluru urban-1 | 0.09 | 1.00 | 1.08 |
| 2 | Bengaluru urban-2 | 0.12 | 0.54 | 0.66 |
| 3 | Bengaluru urban-3 | 0.26 | 0.72 | 0.98 |
| 4 | Bengaluru rural-1 | 0.24 | 0.70 | 0.95 |
| 5 | Bengaluru rural-2 | 0.06 | 0.53 | 0.59 |
| 6 | Chamarajanagar | 0.09 | 0.71 | 0.80 |
| 7 | Chickmagalur | 0.23 | 1.00 | 1.08 |
| 8 | Chitradurga 1 | 0.09 | 0.41 | 0.50 |
| 9 | Chitradurga 2 | 0.05 | 0.32 | 0.37 |
| 10 | Davangere | 0.06 | 0.75 | 0.82 |
| 11 | Hassan | 0.08 | 1.00 | 1.08 |
| 12 | Kolar | 0.23 | 0.48 | 0.72 |
| 13 | Mandya | 0.07 | 0.42 | 0.50 |
| 14 | Mysore | 0.02 | 0.99 | 1.00 |
| 15 | Ramanagara | 0.04 | 0.95 | 1.00 |
| 16 | Tumkur 1 | 0.02 | 0.53 | 0.56 |
| 17 | Tumkur 2 | 0.08 | 0.53 | 0.61 |
| 18 | Shimogha | 0.06 | 0.66 | 0.73 |
| Overall | 0.11 | 0.68 | 0.79 |
Table text extracted from the original PDF; superscript letters are shown inline. The original table image is below.
View original table image
Income diversification of Gaushalas
Income diversification holds close relation with economic sustainability. More the diversification of the activities of a Gaushala, higher will be its sustainability. The income diversification was computed using HDI. Higher the HDI higher will be the income diversification. Table 4 shows that Chitradurga-2 (0.77), Mysore Gaushala (0.73), Bengaluru rural-1 (0.68) and Mandya Gaushala (0.66) were highly diversified Gaushalas. The reasons for their high diversification were less dependence on just one source of funds. These Gaushalas were involved in selling milk, dung, medicines and other by-products. Such income sources in these Gaushalas contributed about 47% to gross income. The reason behind the diversification of these Gaushalas is increasing market demand for their products and better utilization of cow dung, urine and other usable wastes.
Economic sustainability of Gaushalas
ESI was calculated using five economic indicators viz. net income per animal, returns over variable cost per animal, self-sufficiency/ autonomy, dependency and proportion of productive cows (Table 4).
Net income
The annual net income was found negative for Chickmagalur, Hassan, Mysore and Bengaluru urban-1 Gaushalas. Gaushalas were able to cover only variable expenses from their revenue. Chiradurga-2 Gaushala was found to have the highest annual net income (₹15,436.74 per animal) followed by Chitradurga-1 Gaushala (₹8,962.74 per animal).
Returns over variable cost
The return over variable cost per animal per annum was found positive for most of the Gaushalas. This indicates that it was possible to cover the operating expenses. The returns over variable cost were highest for Chiradurga-2 (₹16,740 per animal). The returns were lowest for Hassan Gaushala (₹ 3.33 per animal).
Autonomy
The autonomy indicator shows that the income earned by the Gaushalas through sale of products such as milk, cow dung, compost, cow urine, medicines and other products. www.extensionjournal.com Ramanagara Gaushala was found to be the most autonomous (87.42%) followed by Davangere Gaushala (68.87%).
Dependency
Dependency shows the extent of dependence of Gaushalas on outside sources to run the Gaushalas. It has negative effect on sustainability. The dependency was highest for Tumkur-1 Gaushala (75.00%) followed by Mandya Gaushalas (74.49%). The least dependent Gaushala was Ramanagara Gaushala.
Proportion of productive cows
Ramanagara Gaushala had the highest proportion of productive animals (80.17%) followed by Bengaluru urban-3 (49.12%). Chitradurga-1 Gaushala had the least productive animals (4.14%).
Economic sustainability index
The ESI value of Gaushalas varied from 0.19 to 0.68 (Table 4). About 39 per cent of Gaushalas were less sustainable, 55 per cent moderately sustainable and only 6 per cent were under high sustainable category. Gaushalas under low sustainable category are Bengaluru urban-2, Bangalore urban-3, Chamarajanagar, Mandya, Mysore and Tumkur-1, Tumkur-2. Gaushalas under moderate sustainable category are moderate sustainability are Bengaluru urban-1, Bengaluru urban-2, Bengaluru rural, Chickmagalur, Chitradurga-1, Davangere, Hassan, Kolar, Ramanagara and Shimogha. Chitradurga-2 was only Gaushala under high sustainable category.
Conclusions
Of 18 Gaushalas considered for the study about 39% of Gaushalas were less sustainable, 55% moderately sustainable and only 6 per cent were under high sustainable category. The Gaushalas are run mostly with donations and Government grants. Government grants are inadequate and irregular. Most of the Gaushalas were able to cover their operating expenses. The net income was found to be negative for some Gaushalas due to higher expenditure on feed and fodder. Hence, providing good quality feed and fodder at reasonable prices will help lowering the variable expenses of Gaushalas. A positive relationship was found between income diversification and sustainability of the Gaushalas. The income from sale of milk, cow urine, cow dung, manure etc. have great potentials to make the Gaushalas self-sustainable. Gaushalas located outside the cities are better performing due to sufficient space and availability of grazing land, which lowers the feeding expenses. Hence, the Government should encourage these Gaushalas and should restrict the number of Gaushalas in the cities. Gaushalas can start charging nominal fee from those farmers who leave their animals in Gaushalas to generate some income. Even though some Gaushalas were preparing organic manures like Panchagavya, Jeevamritham, Goark, incense sticks, soaps, pain relievers, perfumes and other cow dung and urine-based products but lacks in marketing. In order to market the products efficiently there should be a joint commercial venture among the Gaushalas. Gaushalas should follow Good Dairy Management Practices (GDMPs) and increase milk production as it is being an important source of income to the Gaushalas.
Acknowledgement
AcknowledgementsThe first author is grateful to ICAR-National Dairy Research Institute, Karnal and Southern Regional Station, Bengaluru for providing fellowship and other needed facilities. Authors also thank the management of all the Gaushalas for sharing the information pertaining to their Gaushalas and having cooperated with the first author.
References
8 in the original paper- Bijila S, Singh A. Economic study of Gaushalas in Haryana: Functioning and profitability. Indian Journal of Dairy Science. 2019;72(1):97-107.
- Mandi K, Subash S, Singh NP, Koloi S. An analysis of constraints faced by the Gaushalas in Karnataka state. Journal of Entomology and Zoological Studies. 2018;6(5):787-791.
- Mandi K, Subash S. Adoption of good management practices by the Gaushalas (Cow-shed) in Karnataka state, India. Asian Journal of Agricultural Extension, Economics & Sociology. 2019;37(4):1-9.
- Mandi K, Subash S, Koloi S, Kumar R, Singh N. Analysis of animal welfare practices adopted by Gaushalas (Cow-shelters) in Karnataka State. International Journal of Livestock Research. 2020;10(2):20-29.
- Ponnusamy K, Chauhan AK, Meena S. Testing the effectiveness of Pasu Sakhi: An innovation for resource poor farm women in Rajasthan. Indian Journal of Animal Sciences. 2017;87(2):229-233.
- Rohith S, Pradeep R, Sivaram M, Subash S. Economic sustainability analysis of Gaushalas in selected districts of Telangana state. Indian Journal of Dairy Science. 2021;74(6):1-7.
- Yadav DK, Vij PK. Inventorization of Gaushala resources and their use in breed improvement and conservation programmes. Indian Journal of Animal Sciences. 2010;80(4):343-345.
- Bijla S, Singh A. Economic study of Gaushalas in Haryana: functioning and profitability. Indian Journal of Dairy Science. 2019 Jan 1;72(1):97-107