
Research article · 2024 · Full text
International Journal of Research in AgronomyHydraulic performance evaluation of mini-sprinkler system
Volume 7(6) · Pages 624–631 · DOI: 10.33545/2618060x.2024.v7.i6i.939 ↗
Research areasAdsorption and Cooling SystemsIrrigation Practices and Water ManagementEnergy, Environment, Agriculture Analysis
Abstract
Author-writtenA mini sprinkler system's hydraulic performance was assessed. Using a tiny sprinkler system with a double nozzle - full circle sprinkler at different sprinkler spacings (12 m × 12 m, 14 m x 14 m, and 16 m x 16 m) at three operating pressures (1.5, 2.0, and 2.5 kg/cm2), an experiment was carried out to assess the hydraulic performance. The optimal value of the jet break up index was found to be close to 4.0 at 1.5 kg/cm2. The jet break up index was found to be in the range of 3.48 to 5.37 in all three operating pressures. Operating pressures of 1.5 kg/cm2, 2.0 kg/cm2, and 2.5 kg/cm2were used to generate the discharge rates of 440, 480, and 535 lph, respectively. The range of the uniformity coefficient for all system configurations was 81.28% to 92.23%. For 12 m × 12 m spacing at 1.5 kg/cm2 and 14 m x 14 m spacing at 1.5 kg/cm2, the uniformity coefficients were at par. The mini sprinklers' effective radius of discharge was measured at 6.35 m, 7.22 m, and 8.49 m, respectively, with operating pressures of 1.5 kg/cm2, 2.0 kg/cm2, and 2.5 kg/cm2. Based on their performance, the 12 m x 12 m systems are operating at 2.0 kg/cm² and 2.5 kg/cm² of pressure.
Summary
Source-checkedPlain-language reading of the full paper, prepared with AI and checked against the text. Each point links to the authors' own words.
Why it matters
- Sprinkler systems are generally more efficient and provide better water delivery uniformity than conventional surface irrigation, which can increase crop yields per unit of water. View evidence ↗
- Evaluating the performance of micro jet sprinklers, specifically their emission uniformity, is necessary to maximize crop output and minimize water waste. View evidence ↗
The question
- The study aimed to maximize design characteristics of a mini-sprinkler system, including its discharge, operating pressure, nozzle size, and radius of influence. View evidence ↗
What they did
- The researchers used a two-factorial totally randomized design with four replications for the experiment. View evidence ↗
What they found
- The index of jet break-up increased from 3.48 to 5.37 as the operating pressure was raised from 1.5 kg/cm² to 2.5 kg/cm². View evidence ↗
- Discharge rates increased with pressure, measuring 440 lph at 1.5 kg/cm², 480 lph at 2.0 kg/cm², and 535 lph at 2.5 kg/cm². View evidence ↗
- The radius of coverage increased with pressure, from 6.35 m at 1.5 kg/cm² to 8.49 m at 2.5 kg/cm², with the area of coverage increasing from 126.67 m² to 226.44 m². View evidence ↗
- The application rate varied from a minimum of 2.7 mm/h (16m x 16m at 1.5 kg/cm²) to a maximum of 4.2 mm/h (12m x 12m at 2.5 kg/cm²). View evidence ↗
What it means
- For 12m x 12m systems, the authors conclude that operating pressures of 2.0 kg/cm² and 2.5 kg/cm² are effective based on performance. View evidence ↗
Visual summary
2 visualsIllustrations explain the paper; charts are replotted from the paper's own table values.
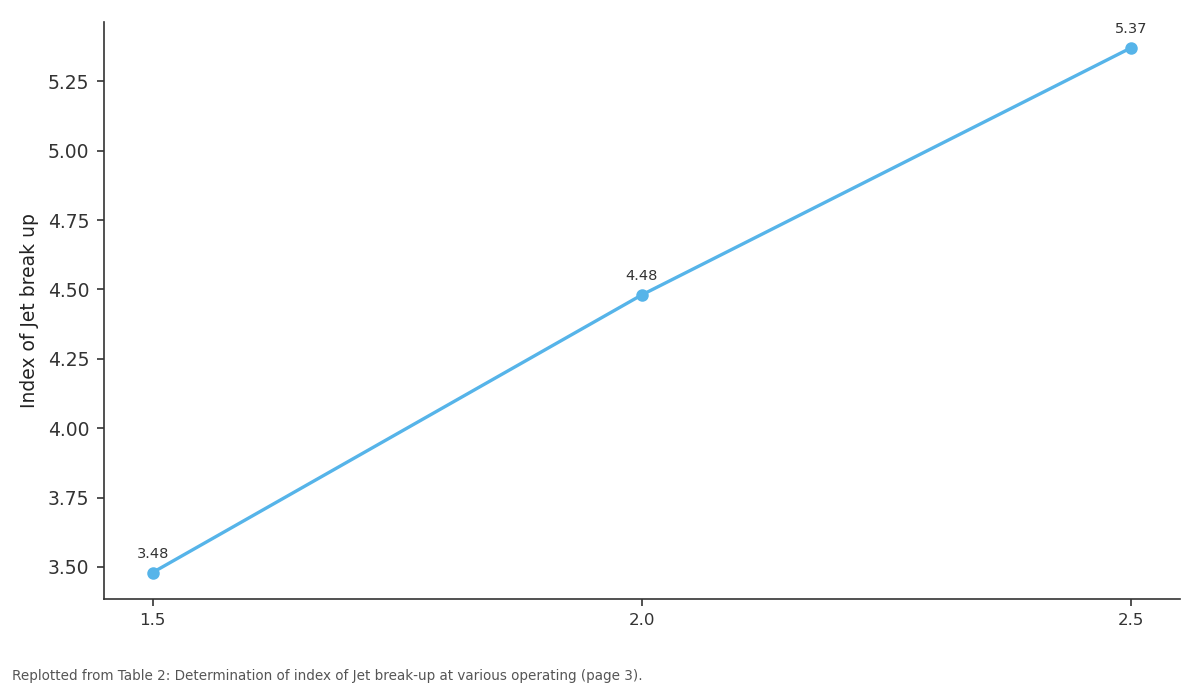
Index of Jet break up: 1.5 vs 2.0 vs 2.5
Replotted from Table 2 (page 3) of the original paper. Every bar is the paper's own table value.
View source evidence ↗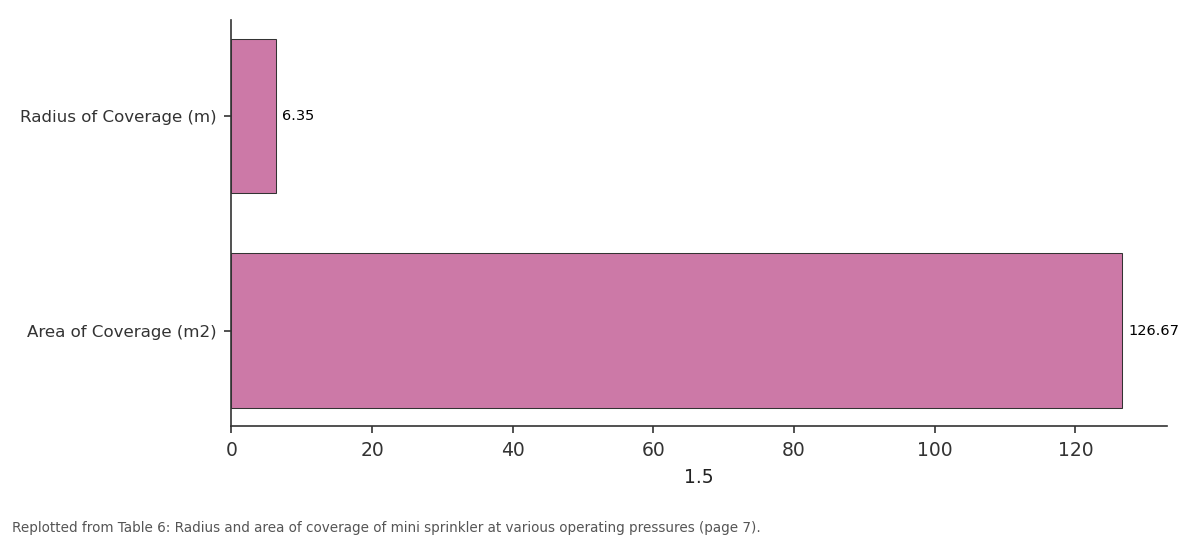
1.5: Radius of Coverage (m) vs Area of Coverage (m2)
Replotted from Table 6 (page 7) of the original paper. Every bar is the paper's own table value.
View source evidence ↗Figures & tables
From the original paper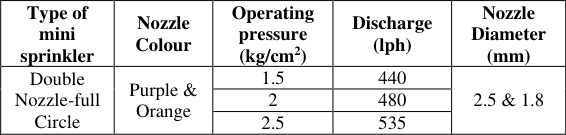 Table 1
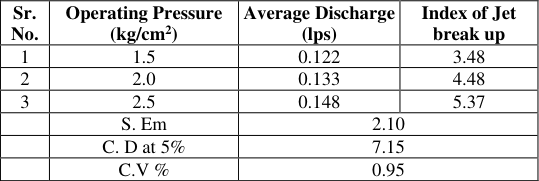 Table 2
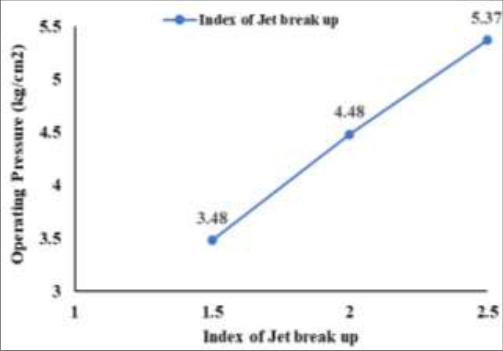 Figure 1
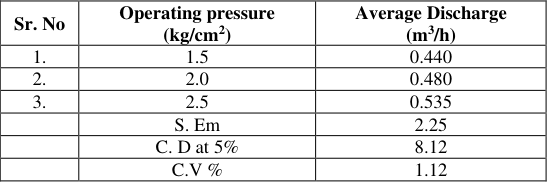 Table 3
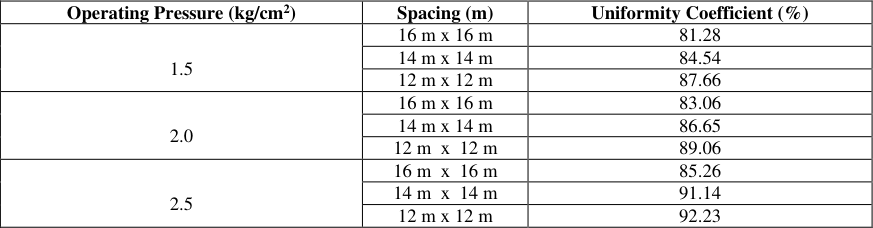 Table 4
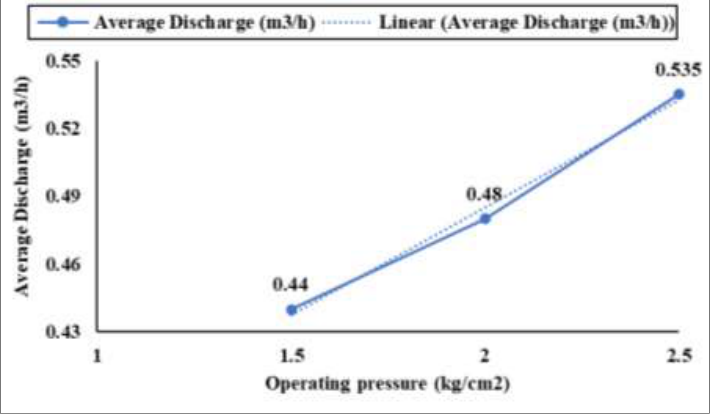 Figure 2
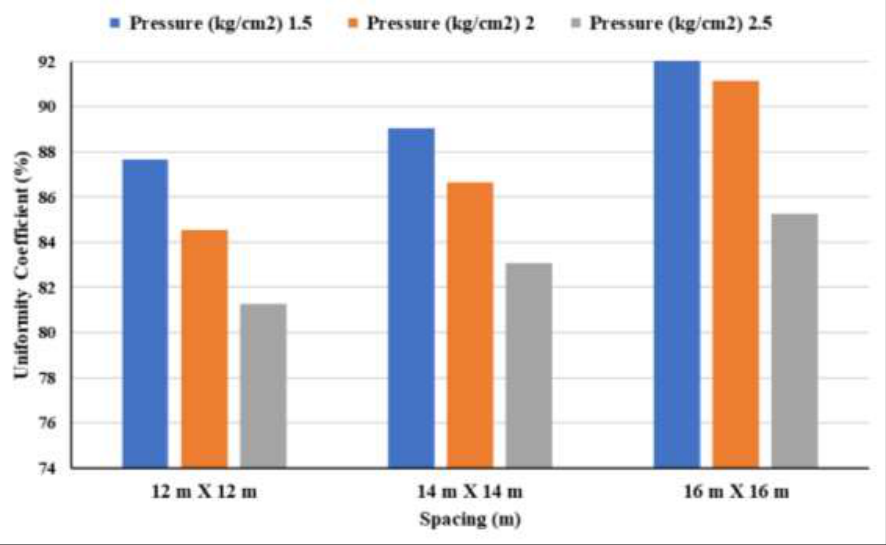 Figure 4
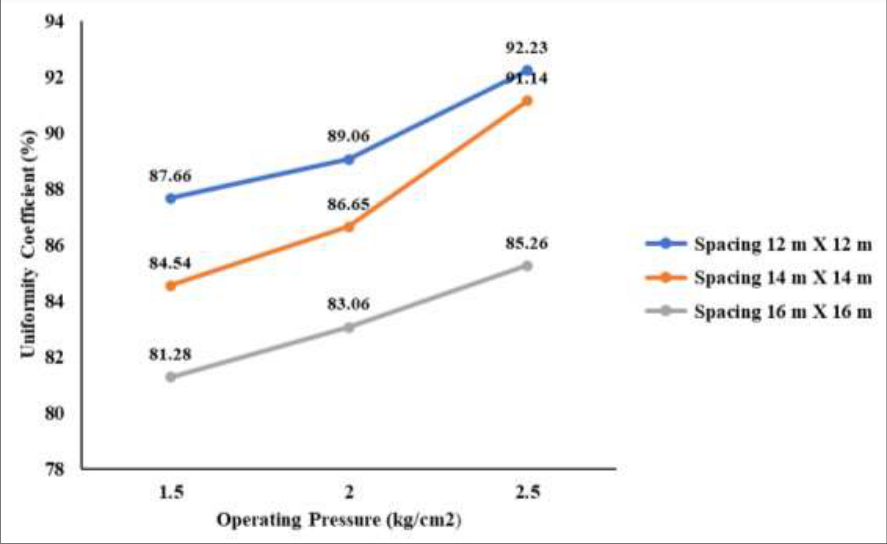 Figure 3
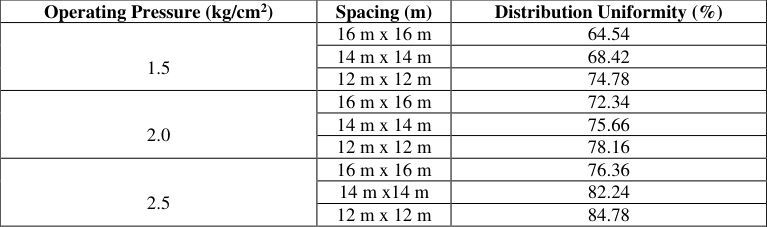 Table 5
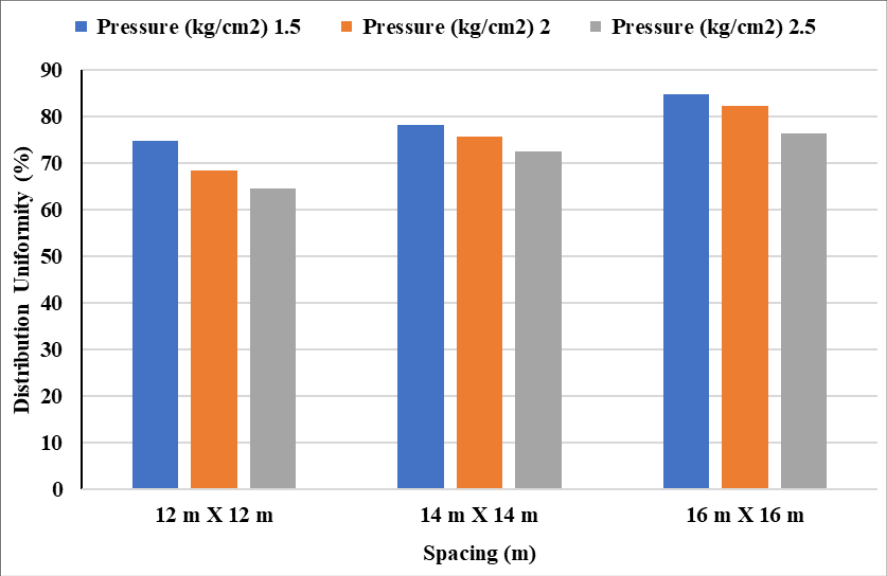 Figure 6
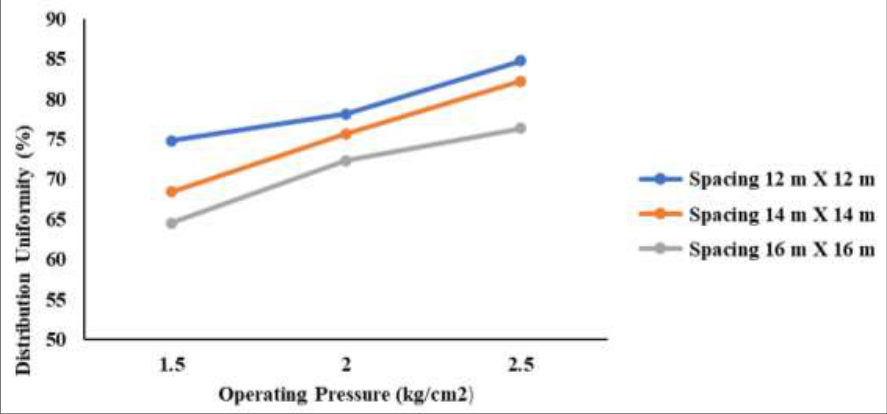 Figure 5
 Table 6
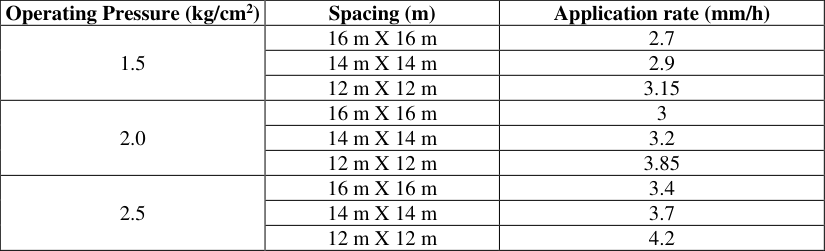 Table 7
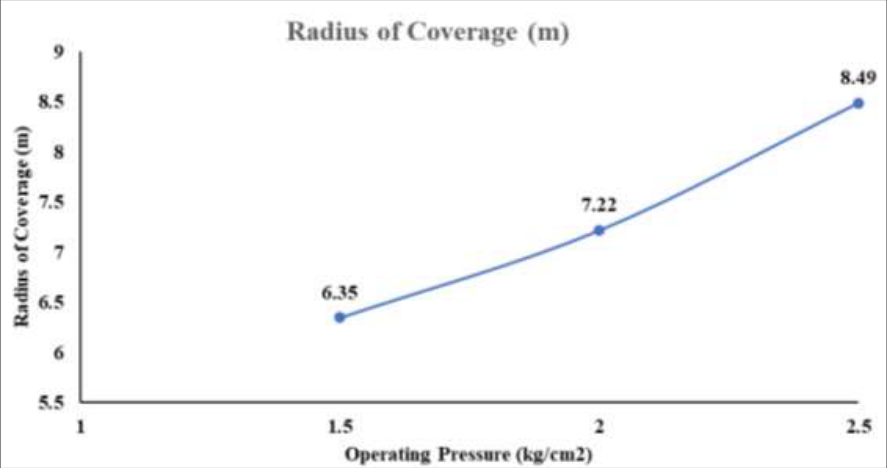 Figure 7
Introduction
Water is indeed unequally distributed across the Earth's surface, with the majority being saline water in the oceans. Here's a breakdown of the distribution you mentioned About 97% of Earth's water is saline, found in the oceans. Only around 3% is freshwater of this 3% freshwater, Approximately, 68.7% is trapped in ice caps and glaciers, about 30% is stored underground as groundwater, Less than 1% is available as surface water in lakes, rivers, and other freshwater sources. This distribution highlights the scarcity of accessible freshwater for human use and the importance of managing and conserving this vital resource (Keskar PK et al., 2023) [10] . Emission uniformity, a measurement of the variation amongst individual emitters within an irrigation block, is one aspect of the performance evaluation of micro jet sprinklers. The average discharge of the 25% of sampled emitters with the least discharge and the average discharge of all sampled emitters with more than 90% discharge are compared to determine the emission uniformity (Bhagwat et al., 2023) [2] . Usually, this assessment is carried out at a variety of stake heights (0 to 10 cm) and pressures (0.5 to 1.7 kg/cm²) (Bansod R. D. 2002) [1] . Singh et al., (2001) [9] conducted a study on tiny jet sprinklers to assess how consistently they emit light under different circumstances. Their results would help evaluate the irrigation system's performance by illuminating the efficient way in which the sprinklers disperse water throughout the irrigated region. When planned, executed, cared for, and controlled appropriately, micro jet sprinklers can prove to be a worthwhile investment (Frank L. 2009) [11] . Sprinklers provide more uniformity and efficiency in water delivery when compared to conventional surface irrigation systems, increasing yields per unit of water sprayed per unit area (Hill & Heaton, 2001) [5] . This consistency is essential for reducing variation in plant quality or crop production, especially in applications like turf grass and landscapes. (Dukes et al., 2006) [3] . Overall, to ensure effective water distribution, maximize crop output, and reduce water waste, micro jet sprinkler performance evaluation-including emission uniformity-is necessary. To maximize the advantages of sprinkler irrigation and achieve optimal performance, proper design and management techniques are essential (Dwivedi et al., 2015) [4] .
In fact, the regularity of water distribution in mini-sprinkler irrigation systems plays a critical role in determining their performance. In addition to careful design, achieving ideal uniformity necessitates consideration of the hydraulic properties of individual system components as well as the impact of external factors such nozzle size and operating pressure. In order to keep operating costs down and initial equipment expenditures as low as possible, efficient and economical design is crucial (Topak et al., 2005) [22] . This is essential to guaranteeing the delivery of high-quality crops and optimizing returns on investment. But as you correctly point out, poor consideration of hydraulic properties and variable effects can result in less-thanideal performance, which can cause uneven water distribution and water loss. In order to determine whether an irrigation system is effective, performance measurement becomes essential (Mantovani et al., 1995) [7] . In order to do this assessment, the system will be tested in a variety of operational environments, and variables such water losses, application efficiency, and distribution uniformity will be examined. Enhancing the overall effectiveness of the system can be accomplished by identifying inefficient or underperforming regions and making necessary improvements. The performance of an irrigation system is influenced by several factors, including the layout of the system, operating pressure, nozzle size, and sprinkler spacing. Farmers can maximize crop yields while minimizing expenses by optimizing their mini-sprinkler irrigation systems to achieve maximum uniformity of water distribution, decrease water losses, and implement required adjustments (Siosemarde et al., 2015) [8] .
Materials and Methods
The current study, "Hydraulic performance evaluation of minisprinklers system," was conducted from September 2023 to November 2023 at the Instructional Farm of the Department of Irrigation and Drainage Engineering, College of Agricultural Engineering and Technology, D Y Patil Agriculture & Technical University, Talsande.
Experimental setup
A distinct experimental setup was created in an open area for the hydraulic experiments of the tiny sprinkler irrigation system. The aim of this study was to maximize many design characteristics, including sprinkler discharge under various situations, operating pressure, radius of influence, and nozzle size. Pump, main and sub main pipe, filters, laterals, risers, sprinkler head, and pressure gauge made up the experimental setup.
A) Statistical design
In the current study, a two factorial totally randomized design with four replications was used.
B) Treatments
The experiment comprises of 9 treatment combinations and four replications.
Water source
Water was supplied by a sump well to run a small sprinkler irrigation system.
Pump
Water was pumped from the sump well using a horizontal open well submersible pump with a 10 HP motor attached.
Mains and sub mains
A 90 mm (class II) PVC pipe was used to transfer irrigation water from the well to the field. The main supply pipe for the mini sprinkler irrigation system was connected to a separate PVC pipe measuring 63 mm in diameter, which was equipped with control valves. the mainline and submain line installations.
Filter
In the laboratory of the Irrigation and Drainage Engineering Department, C.A.E.T., D Y Patil Agriculture & Technical University, Talsande, all filter arrangements were made on the delivery side of the pump. There were primarily two kinds of filters installed. i) Sand filter: Immediately following delivery, a 25 m3 hr-1 sand filter was installed. ii) Sand filter installation: A 25 m3 hr-1 screen filter was installed in conjunction with a sand filter.
Pressure gauge
The pressure over the mini sprinkler will be measured using a dial pressure gauge with a range of 0 to 7 kg/cm 2 . To track the pressure in the main line in kilograms per square centimeter, a dial pressure gauge will be mounted on the main pipe. A by-pass valve was utilized to control the pressure so that sprinklers could be operated at 1.5, 2, or 2.5 kg/cm 2 .
Lateral lines
Through lateral lines, irrigation water was redirected from the submain line to the sprinkler head. The class n, PE 25 lateral line JISL (IS-12786) with a 25 mm diameter was employed.
Anemometer
The anemometer was used to measure the wind velocity.
Mini sprinkler assembly
The "Double Nozzle-full circle" mini sprinkler irrigation company was used in the current study. It was installed on a 1.2 m long installation stake with an 8 mm ae sprinkler. The lateral was linked to the mini sprinkler through a 1.2 m vinyl tube with a 12 mm inner diameter. There were two nozzles on the tiny sprinkler.
Range nozzle (Purple): 2.5 mm Φ Spray nozzle (Orange): 1.8 mm Φ
Resources and materials
The resources and materials which were required for conducting the experiment are briefed as below.
a) Water Resource
Water resources were obtained from a 30-centimeter-diameter tube well that was 75 meters deep overall. Throughout the season, the water level at the surface varied from 10 to 20 meters.
Pumping system
The electric submersible motor of 7.5 HP X 6 stage X 3-Phase X 65 mm was used for pumping the water from the well. The delivery line was of GI having size of 65 mm.
b) Conveyance pipe
The existing PVC pipe of 110 mm X 4 kg/cm 2 (ISI) was used for conveying the water to the experimental site.
Hydraulic evaluation of Mini Sprinklers
In order to calculate the index of jet break up (Pd), sprinkler discharge (q), Christiansen's uniformity coefficient (CU), distribution uniformity (DU), and water spread area (A), three distinct pressures of 1.5, 2, and 2.5 kg/cm 2 and three distinct spacing configurations of 16 m × 16 m, 14 m × 14 m, and 12 m × 12 m were assessed for the mini sprinklers. First, a 12-by-12meter spacing will be set up, and the pressure level must remain at 1.5 kg/cm 2 . As a result, the distribution uniformity (DU), index of jet break up (Pd), Christiansen's uniformity coefficient (CU), and weted area (A) will be calculated. This procedure will be repeated four times, and the average of the aforementioned parameters will be found for the same pressure of 1.5 kg/cm 2 and spacing of 12 m × 12 m. After that, the spacing will be maintained at 14 m × 14 m and the pressure level will be kept at 2 kg/cm 2 . Four repetitions of the previously described process will yield an average of the necessary parameters. After that, the spacing was maintained at 16 m × 16 m and the pressure level was kept at 2.5 kg/cm 2 . Four times through the same process, the average of the necessary parameters was found.
Determination of index of Jet break-up (Pd)
In order to minimize droplet size and achieve uniform coverage, the water jet must be broken up. Jets have a built-in tendency to fragment due to air resistance. Generally speaking, break up rises with pressure and nozzle slot presence. Good coverage is achieved with slow rotation sprinklers, which rotate at 0.67 to 1 revolution per minute (rpm) for small sprinklers and 0.25 to 0.5 rpm for large sprinklers. The following empirical formula for an index of jet break up is derived from Tanda (Pillsbury, 1968).
Where, Pdindex of jet breaks up, h = pressure head at sprinkler nozzle, m, q = sprinkler discharge, lps. If value of Pd is greater than 2, the condition of drop size is considered to be good. If the value of Pd is 4, the condition of drop size is considered to be the best and if it is greater than 4 then pressure is being wasted.
Determination of Sprinkler discharge (q)
The water emitted by the sprinkler is collected into a bucket every two minutes to measure the sprinkler discharge. By dividing the collected volume by the filling time, the discharge was computed. For every operating pressure, three discharge observations were made. With the orifice flow equation, one can calculate the sprinkler nozzle's theoretical discharge. (Dwivedi et al., 2015) [4] .
Where, q = Nozzle discharge, m 3 /s, a = Cross sectional area of sprinkler nozzle, m 2 , h = Pressure head at the nozzle, m, Cd = Coefficient of discharge.
Uniformity Coefficient
The average depth of water collected in the catch cans were used to compute Christiansen CU (Christiansen, 1941) [13] for each test run of mini sprinkler system using the following equation:
Where, CU = coefficient of uniformity (%), Xi = precipitation measured at any sample point, X = mean precipitation and n = number of observations.
Result and Discussion Determination of index of Jet break-up (Pd)
The pressure head and average discharge at the mini sprinkler nozzle were measured when the sprinkler was operated at 1.5, 2.0, and 2.5 kg/cm 2 pressure. These values were then used in the empirical equation 1 to obtain the index of jet break up that is shown in Table 2 and Fig. 1. 1 show that the value of the jet break up index was 3.48 when the pressure was kept at 1.5 kg/cm 2 . The droplet size is subpar at a pressure of 2.0 kg/cm 2 , as indicated by this value of the jet breakup index, which is close to 1.5 kg/cm 2 .
In the event that the droplet size is not acceptable, the yield and uniformity will also suffer. After that, the pressure was increased to 2.0 kg/cm 2 and kept there to get more observations. A good droplet size is indicated by the index of jet breakup value, which was found to be 3.48 when the pressure was maintained at 2.0 kg/cm 2 . This value falls very well between 2.00 and 4.00 values.
If the value of the index of jet break up is 4, the droplet size is deemed optimal.
Discharge from mini sprinkler
Finally average discharge was obtained at various operating pressures for mini sprinkler was determined and presented in the table below. The relationship of discharge against operating pressure is shown in Fig. 2 and presented in Table 3.
Pressure-discharge relationship from mini sprinkler
The 5022-U dual nozzle mini-sprinkler (orange and purple) was observed to discharge at various operating pressures between 1.5 and 2.5 kg/cm -2 . Table 3 reports the average discharges for every kind of mini-sprinkler nozzle. Fig. 2 shows a graphical representation of the pressure to discharge relationship. The three observations' average values are displayed in the table. Table 3 shows that at an operating pressure of 1.5 kg/cm 2 , the Dual Nozzle Mini Sprinkler had a minimum discharge of 0.440 m 3 /hr.
Uniformity Coefficient
Operation pressures for the mini sprinkler were 1.5 kg/cm 2 , 2.0 kg/cm 2 , and 2.5 kg/cm 2 . To determine the uniformity coefficient, catch cans were positioned two meters apart in a grid with miniature sprinklers surrounding them. The volume of water that collected in the cans over a predetermined amount of time was then recorded. Table 4 displays the uniformity coefficient that was determined for various spacing while maintaining a constant pressure. The findings are displayed in Fig. 3, which displays the uniformity coefficient at different operating pressures. The data presented in Figure 3 indicates that the maximum uniformity coefficient was achieved with a spacing of 12 m × 12 m between mini sprinklers and a pressure of 2.5 kg/cm 2 . The uniformity coefficient with the lowest value was measured at a 16 m × 16 m spacing and 1.5 kg/cm 2 . There was a statistically significant variation between the treatments. Figure .4 presents the results for the uniformity coefficient at different spacings as well. The highest uniformity coefficient is achieved with a spacing of 12 m ×12 m at an operating pressure of 2.5 kg/cm 2 . However, this will require a greater number of mini sprinklers if the sprinkler arrangement is to be set up over an area of one hectare or more, which will not be advantageous from an economic standpoint.
| Operating Pressure (kg/cm2) | Spacing (m) | Uniformity Coefficient (%) |
|---|---|---|
| 1.5 | 16 m x 16 m | 81.28 |
| 14 m x 14 m | 84.54 | |
| 12 m x 12 m | 87.66 | |
| 2.0 | 16 m x 16 m | 83.06 |
| 14 m x 14 m | 86.65 | |
| 12 m x 12 m | 89.06 | |
| 2.5 | 16 m x 16 m | 85.26 |
| 14 m x 14 m | 91.14 | |
| 12 m x 12 m | 92.23 |
Table text extracted from the original PDF; superscript letters are shown inline. The original table image is below.
View original table image
Distribution Uniformity (DU)
The pressures at which the tiny sprinkler was operated were 1.5 kg/cm 2 , 2.0 kg/cm 2 , and 2.5 kg/cm 2 . To achieve uniform distribution, catch cans were spaced two meters apart in a grid encircled by miniature sprinklers. The amount of water that collected in the cans over a predetermined amount of time was recorded. Table 5 shows the distribution uniformity attained for various spacing while maintaining a constant pressure.
| Operating Pressure (kg/cm2) | Spacing (m) | Distribution Uniformity (%) |
|---|---|---|
| 1.5 | 16 m x 16 m | 64.54 |
| 14 m x 14 m | 68.42 | |
| 12 m x 12 m | 74.78 | |
| 2.0 | 16 m x 16 m | 72.34 |
| 14 m x 14 m | 75.66 | |
| 12 m x 12 m | 78.16 | |
| 2.5 | 16 m x 16 m | 76.36 |
| 14 m x14 m | 82.24 | |
| 12 m x 12 m | 84.78 |
Table text extracted from the original PDF; superscript letters are shown inline. The original table image is below.
View original table image
The distribution uniformity reached its maximum value when the spacing mini sprinkler was maintained at 12 m × 12 m and the pressure was 2.5 kg/cm 2 , as illustrated in Figure 5. The distribution uniformity coefficient with the lowest value was measured at a 16 m × 16 m spacing and 1.5 kg/cm 2 . Significant statistical disparity between the treatments. Fig. 6 made it abundantly evident that the distribution uniformity coefficient decreased as the distance between the mini sprinklers increased and vice versa. If the setup is to be done in an area of one hectare or more, fewer mini sprinklers are needed because the distribution uniformity obtained at a sprinkler spacing of 14 m ×14 m is close to 80% at different operating pressures. As a result, compared to the tiny sprinkler spacing of 12 m × 12 m, the 14 m x 14 m sprinkler spacing will also be advantageous economically and distribution uniformity won't be significantly reduced. Although 12 m × 12 m spacing yields the best distribution uniformity, 14 m x 14 m spacing is advised because it is more cost-effective and yields satisfactory distribution uniformity as well. It is not recommended because the distribution uniformity value is significantly lower at 16 m × 16 m spacing, especially at lower operating pressure. With a spacing of 14 m × 14 m and an optimal pressure of 2.0 kg/cm 2 , a distribution uniformity coefficient of 75.66% can be achieved.
Radius and Area of Coverage
The radius and area of coverage were measured around the mini sprinklers and its average values are presented in Table 6. The results of Fig. 7 indicate that the mini sprinkler operated at 1.5 kg/cm 2 pressure resulted in the least radius of coverage, while 2.5 kg/cm 2 pressure produced the maximum radius of coverage.
| Sr. No. | Operating Pressure (kg/cm2) | Radius of Coverage (m) | Area of Coverage (m2) |
|---|---|---|---|
| 1 | 1.5 | 6.35 | 126.67 |
| 2 | 2.0 | 7.22 | 163.76 |
| 3 | 2.5 | 8.49 | 226.44 |
Table text extracted from the original PDF; superscript letters are shown inline. The original table image is below.
View original table image
There is a 2.14meter difference between the maximum and minimum coverage radius. The radius of coverage obtained at 2.0 kg/cm 2 is 7.22 meters, which is only 1.27 meters less than the value obtained at the maximum operating pressure of 2.5 kg/cm 2 . Similarly, as the figure illustrates, the mini sprinkler operating at 1.5 kg/cm 2 pressure produced the least amount of coverage, while operating at 2.5 kg/cm 2 pressure produced the greatest area of coverage. There is a 99.77 square meter difference between the minimum and maximum area of coverage. 163.76 square meters of coverage are obtained at a pressure of 2.0 kg/cm 2 .
Application rate of mini sprinkler
Application rate at various operating pressures and spacings were obtained during the experiment and its values are presented in Table7.
| Operating Pressure (kg/cm2) | Spacing (m) | Application rate (mm/h) |
|---|---|---|
| 1.5 | 16 m X 16 m | 2.7 |
| 14 m X 14 m | 2.9 | |
| 12 m X 12 m | 3.15 | |
| 2.0 | 16 m X 16 m | 3 |
| 14 m X 14 m | 3.2 | |
| 12 m X 12 m | 3.85 | |
| 2.5 | 16 m X 16 m | 3.4 |
| 14 m X 14 m | 3.7 | |
| 12 m X 12 m | 4.2 |
Table text extracted from the original PDF; superscript letters are shown inline. The original table image is below.
View original table image
Figures and tables from the paper
References
9 in the original paper- Bhagwat SM, Ingle PM, Kadam US, Patil ST, Bansode PB. Effect of different irrigation and fertigation levels on water use efficiency, fertilizer use efficiency and biometric parameter of strawberry crop under coastal climatic condition of Konkan region. The Pharma Innovation Journal. 2023;12(7S):2564-2569.
- Dukes MD. Effect of wind speed and pressure on linear move irrigation system uniformity. Applied Engineering in Agriculture. 2006;22(4):541-548.
- Dwivedi DK, Gontia NK, Chavda JM. Hydraulic performance evaluation of mini sprinkler system. African Journal of Agricultural Research. 2015;10(53):4950-4966.
- Li J, Rao M. Field evaluation of crop yield as affected by non-uniformity of sprinkler-applied water and fertilizers. Agricultural Water Management. 2003;59(1):1-13.
- Mantovani E, Villalobos FJ, Organ F, Fereres E. Modeling the effect of sprinkler irrigation uniformity on crop yield. Agricultural Water Management. 1995;27(3-4):243-257.
- Siosemarde M, Byzedi M, Nodehi DA. The evaluation of water distribution uniformity in solid set sprinkler systems. Journal of Food, Agriculture & Environment. 2012;10(2):818-822.
- Keskar PK, Ayare BL, Bhange HN, Ingle PM, Kolhe PR. Identification of groundwater potential zones in Kajali river basin using remote sensing and GIS. The Pharma Innovation Journal. 2023;12(10S):2137-2144.
- Topak R, Heri S, Kara M, Alisir SC. Investigation of the energy efficiency for raising crops under sprinkler irrigation in a semi-arid area. Applied Engineering in Agriculture. 2005;21(5):761-768.
- Christiansen JE. Irrigation by Sprinkler. University of California Agricultural Experiment Station Bulletin. 1942;670-124.
Cited by 1
From OpenAlex, OpenCitations and reference lists read by Scinovex
- Performance Evaluation and Adaptation of Mini-sprinkler Irrigation through Cabbage Production ↗
Lalisa Ofga, Jemal Nur, Ayala Tade · American Journal of Water Science and Engineering · 2025
The activity was conducted with the objectives of adapting and evaluating the performance of mini sprinkler irrigation technology through cabbage production. The result indicates that the distribution uniformity obtained was 78.60%, uniformity coefficient determined was 81.5% and application efficiency was 80.70%. From the result, all performance indicators for min-sprinkler irrigation; distribution uniformity, coefficient of uniformity and application efficiency were in…
❝ 0PDF