
Research article · 2024 · Full text
International Journal of Geography Geology and EnvironmentTemporal analysis of urban development and changing land use patterns in Gurugram district
Volume 6(1) · Pages 468–472 · DOI: 10.22271/27067483.2024.v6.i1f.251 ↗
Research areasLand Use and Ecosystem Services
Abstract
Author-writtenGurugram district’s urban regions’ historical development as well as how land use has changed through time are both examined during a temporal analysis of urban development and shifting land use patterns in the district. Here is a general description of how such an analysis might be conducted. Compile information from a range of sources over a wide time range, such as public records, satellite photography, surveys, and research studies. Land usage, population expansion, infrastructural growth, and urban planning guidelines should all be covered in this data. Gurugram district’s history and its transition from a rural to an urbanized area should be given first. Highlight significant anniversaries, such as the founding of industrial zones or the growth of residential districts. Examine the patterns of land use over time. Land can be classified into many types, such as open areas, infrastructure, commercial, industrial, and residential, using satellite photography and GIS (Geographic Information System) software. Compare the evolution of land use through time. Consider the trends in population increase and how they affect urban planning. Understanding population trends, migration patterns, and how they relate to shifts in land use requires analysis of census data or demographic surveys.Research the creation of physical infrastructure, including public facilities (parks, hospitals, and transit networks), utilities (water, electricity, and sewage), and roads. Determine the schedule for infrastructure projects and evaluate the impact they will have on future land use decisions. Evaluation of urban planning legislation and policies that impacted land use choices in the Gurugram district. Review the zoning laws, development policies, and master plans that have been in place at various times. Describe their success in directing sustainable urban expansion. Analyse the effects of urban development and shifting land use patterns on the environment. Think of things like the destruction of agricultural land, deforestation, pollution, and the effect on ecosystems. Investigate methods to lessen these effects, such as conservation programs or green projects. Identify the socioeconomic effects of urban development through socioeconomic analysis. Examine the effects on the district’s social dynamics, living standards, income levels, and employment prospects. Determine any inequities or inequalities brought on through alterations in land usage. Make future estimates or scenarios for Gurugram district’s urban development and land use patterns based on the examination of historical data. Discuss potential difficulties and opportunities while offering plans for growth that is both inclusive and sustainable.
Summary
Source-checkedPlain-language reading of the full paper, prepared with AI and checked against the text. Each point links to the authors' own words.
Why it matters
- Urban expansion typically occurs on prime agricultural land, leading to the loss of productive farming areas. View evidence ↗
- Land use and land cover change (LULCC) can cause serious environmental issues, including biodiversity loss and forest fragmentation. View evidence ↗
- The growth of built-up urban areas impacts pollution, water management, and the creation of urban heat islands. View evidence ↗
The question
- The study aims to analyze the rapid changes in land use patterns around the developing Gurgaon urban complex. View evidence ↗
What they did
- The researchers performed a GIS-based temporal analysis using Landsat satellite imagery from 2011, 2014, and 2019. View evidence ↗
- The methodology involved georeferencing satellite imagery using Ground Control Points and digitizing land use patterns with Arc GIS. View evidence ↗
- Population and agriculture statistics were used to analyze the socioeconomic impacts of land use changes over time. View evidence ↗
What they found
- Agricultural land decreased by 4.39%, falling from 112,292.4 hectares in 1990 to 106,770.3 hectares in 2017. View evidence ↗
- The built-up area grew substantially from 623.95 hectares in 1990 to 7,336.6 hectares in 2017. View evidence ↗
- Barren land remained constant at 10,903.6 hectares throughout the study period. View evidence ↗
- Vegetation cover showed a consistent decline from 798.65 hectares in 1990 to 485.9 hectares in 2017. View evidence ↗
- Water bodies increased from 14.08 hectares in 1990 to 172.6 hectares in 2000, before decreasing to 78.25 hectares by 2017. View evidence ↗
- Settlement area increased from 3% of the total area in 1989 to 16% in 2011, and eventually to 32%. View evidence ↗
- The number of households grew from 14,817 in 2001 to 54,074 in 2011, with a projection of 67,476 by 2021. View evidence ↗
What it means
- The authors conclude that accurate and thorough land use change data is essential for planning a sustainable urban and environmental future. View evidence ↗
- GIS data can help minimize the negative effects of urban growth and improve the delivery of municipal services by tracking LULC evolution. View evidence ↗
Visual summary
1 visualsIllustrations explain the paper; they do not show study data.
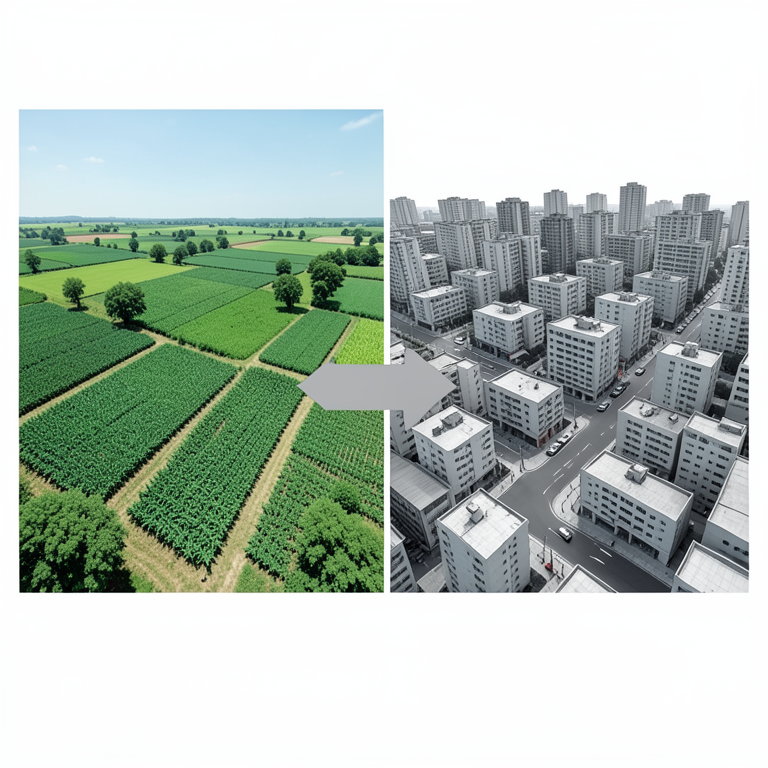
Land Use Shift
AI-generated conceptual illustration (Gurugram district landscape). It explains the idea and does not show study data.
View source evidence ↗Figures & tables
From the original paper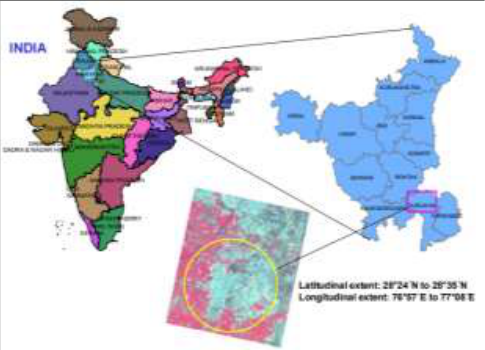 Figure 1
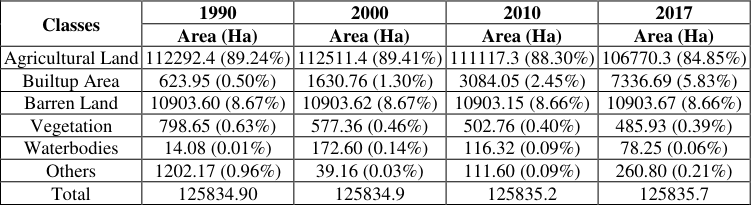 Table 1
Introduction
This study's goal is to examine how the area surrounding the anticipated Gurgaon urban complex development has been quickly altering in recent years in terms of land use patterns. Materials and Techniques Using Landsat satellite imagery for the years 2011, 2014, and 2019, a GIS-based temporal analysis of land use patterns was conducted. In the initial phase of georeferencing the satellite imagery, Ground Control Point was used, and in the second phase, Arc GIS was used to digitize the land use pattern. To assess the socioeconomic impact, the distinct land use during prior years was then analysed using population and agriculture statistics. Findings: Immigrants and infrastructure projects Population growth has led to an increase in settlement area, which has grown from 3% of the total area in 1989 to 16% in 2011 and now makes up 32% of the total area. The number of households, which rose from 14817 in 2001 to 54074 in 2011, and is projected to rise to 67476 by the year 2021, is directly impacted by the growing settlements area. The findings imply that Gurugram and other villages within the tehsil would soon see spatial expansion.
High water consumption will be a result of increasing population density. Since the water table is being drained by 1-1.4 meters year, the dependency on groundwater may get worse in the coming days, according to the Central Groundwater Board (CGWB). Additionally, there were several unplanned developments and the erection of real estate structures that did not adhere to the standards of a planned city. The mistake made in planning the city of Gurugram must be remembered, and coordination between the various government agencies must be balanced for quick settlement of outstanding issues and quicker decisionmaking. This could pave the way for improving egovernance. Novelty/Applications: To take into account the numerous new planning strategies, the rules for obtaining different permissions throughout the government machinery must be changed. The greatest strategy may be a publicprivate cooperation, which would allow for speedier construction with top-notch amenities, which are more severely missing right now. Gurugram is around 10 kilometres from the sub-city of Dwarka and is located 30 kilometres south of New Delhi. Rajasthan, Uttar Pradesh, and Delhi are its neighbours. It is extremely well connected to other states by the broad-gauge rail route between Delhi, Jaipur, and Ahmedabad as well as NH 8 and the New Delhi Metro. The city has experienced considerable development and construction during the last 40 years. Gurugram is a satellite town of Delhi and a part of the National Capital Area. The district, the second-largest city in the Indian state of Haryana, serves as the state's commercial, financial, and industrial hub. Gurgaon's contemporary history began in 1861, when the district of which it was a part was divided into five tehsils: Gurgaon, Ferozepur Jhirka, Nuh, Palwal, and Rewari (10), and the present-day city came under Gurgaon tehsil's rule. Gurgaon joined independent India in 1947 and was incorporated into the Punjab Indian state. With the establishment of the new state in 1966, the city was placed under Haryana's control. With effect from August 15, 1979, the state of Haryana further divided the Gurgaon district into two districts, namely Gurgaon and Faridabad. Ancient India has witnessed the river Valley civilization where society with large settlements flourished using river water as a prime source for drinking and agriculture. In parallel with that, the food, fodder, and fuel wood concept for limited exploitation of natural resources kept the ecosystem sustainable, intact, and healthy. Currently rapidly increasing population has shifted the pattern of settlements near to the industrial area or existing urban center, which is now identified as alternate sources of livelihood other than agriculture. A Report published by the UN Department of Economic and Social Affairs (UNDESA), suggests that currently, 48% of the world population lives in urban areas. This is expected to grow to 48% by 2040. The report suggests that Gurugram will become the most populated city and that too in less than 10 years. With the cooperation of Suzuki Motors of Japan and Maruti Udyog Limited in the early 1980s, the modern history of the growth of the city of Gurgaon can be traced. Following then, Gurgaon began to rapidly industrialize in a new location. When the Narasimha Rao government implemented market economic reforms in 1991, demand for housing slowly rose, then for commercial space, and Gurgaon became a centre for MNC and IT businesses. The Haryana government formally declared the city and district would be renamed as Gurugram going forward on September 27, 2016. Gurgaon has a population of 9,77,337 in 2011, according to preliminary Census of India estimates. Gurgaon/ Gurugram City is a part of the NCR and is situated in the Gurgram district of the state of Haryana. Both the Gurgaon (Vidhan Sabha) and Gurgaon (Lok Sabha) constituencies include the city. The Lok Sabha MP for Gurgaon is Rao Inderjit Singh, while the current Gurgaon MLA is Sudhir Singhla. After Chandigarh and Mumbai, it has the third-highest per capita income in the country. Urbanization and industry both grew dramatically in Gurgaon. It is a center for huge industries, multinational corporations, BPO, IT/ITES firms, and shopping centers. Automobiles, telecommunications gear, electrical goods, sporting goods, rubber goods, ready-towear, and IT/ITES firms are all present. Light engineering products, medicines, agro-based and food processing, leather, terry towels, air conditioners, shoes, pesticides, insecticides, etc. are some more industries. Urban growth is now a commonly acknowledged truth. In contrast, just 8.2% of people on Earth lived in areas with 22,000 or more residents in 1800. The percentage increased to 43.5% in 1990. The surrounding prime agricultural land is where cities and towns most frequently grow, therefore the physical growth of urban areas always encroaches on the nation's agriculturally productive land. Thus, the surrounding countryside of the cities and towns serves as a foundation for urban expansion.
Study Area
The study area covers latitudes 28 0 24'N to 28 0 35'N and longitudes 76°57' to 77°08'E. Gurgaon is a significant satellite city located approximately 32 kilometers from New Delhi, the capital of India. As per the 2001 national census, Gurgaon has a population of around 228,820, with a growth rate of 68.39% between 1991 and 2001. (Source: NCR Regional Plan 2021).
Fig 1: The location of study area
Fig 1: The location of study area
Urban Development
The terms 'rapid urbanization' and "urban development" refer to an increase in the percentage of people who live in cities, while 'urbanization' is a term used to characterize this rapid growth. Slums have proliferated all over the world as a result of the recent fast urbanization. Only 14% of the world's population, as estimated by the United Nations, resided in cities in 1990. By the middle of the 1990s, a third of the population had been added. Over the previous 20 years, urban populations have already grown much faster than their counterparts in the periphery. By 2050, it is anticipated that 64% of the world's population will live in urban areas. 2015 United Nations Over the next three decades, it is estimated that urbanization rates in Africa and Asia will make up nearly 92% of the global total. The developing world is urbanizing at a rate of 5% per year, which is quicker than the developed world (which is urbanizing more slowly). Despite these differences, emerging nations are urbanizing faster than developed ones. In the industrialized world, the rate of urbanization has remained constant or even decreased as a result of regular settlement patterns and generally steady population growth. One of the most important human alterations to the earth's surface in recent times has been the alteration of land use and land cover. The study of the causes, mechanisms, and impacts of LULCC is one of the most significant research topics in landscape ecology. Landscapes might be viewed in this light as the arbitrary and dynamic result of the combination of socioeconomic and biophysical phenomena. You must understand how LULCC functions and how it interacts with other groups in order to make scientific and governmental judgments. Changes in land use and land cover are the most obvious indicators of environmental change, which is believed to be the primary cause of change on all spatial and temporal dimensions. Forest fragmentation, loss of biodiversity, and interactions between the Earth's atmosphere are all serious issues brought on by LULCC. Monitoring environmental change and managing natural resources are becoming increasingly crucial. Currently, one of the most crucial challenges is this. Globally, governments from various nations and areas have declared the need for immediate action at all levels to combat LULCC and its consequences on terrestrial ecosystems, including forestry, agriculture, and biodiversity. The fundamental spatial components of a landscape, land use and land cover, are vital to consider when discussing landscape ecology. Current social demands on the land are changing, and the land is adapting to meet these demands by providing new ways and circumstances for human habitation. New land uses may become more necessary as a result of developments in technology as well as shifts in a society's size, makeup, and needs. Some of these adjustments are transient, while others show a more constant need for land. The most fundamental resource at the disposal of human society is land, which can be used for a number of planning activities. As evidenced by its exploitation, there is a symbiotic relationship between man and the dominant natural features of a place. The cosmos was created as a result of an intricate interaction between natural and human origins, both of which have had an impact historically and are still having an impact today. The intended use of a piece of land is carried out through land use. The terms 'apartment buildings, industrial sites, and agricultural operations' refer to a system of land use that includes roads, neighbourhoods, industries, and retail and service establishments, whereas 'apartment buildings, industrial sites, and retail and service establishments' are all examples of land use. Field investigation, the creation of field maps, a quick plan for village surveys, the design of sampling, and the presentation of formulas that have been researched by experts in various areas of land use study are all techniques utilized in land use research. The techniques of land use analysis call for a comprehensive examination of land use in a formal scientific setting.
Land Use and Urban Development
Land use land cover change (LULCC) is a critical issue today because of the rapid development and expansion of cities, as well as the scarcity of land, which necessitates the need for more masterpieces. LULCC react to financial, political, social, statistical, and ecological conditions and powers that are to a large extent characterised by large human populations. LULCC has emerged as one of the most serious sources of concern for experts and business leaders all around the world today. The essential key components, for illustration, have been proved to alter geolocation in this demonstration. 1) Agricultural Land 2) Barren Land 3) Follow Land 4) Settlement 5) Vegetation 6) Water Body
Land Use Changing Pattern
We can better understand the landscape as a whole with ongoing innovation. You must examine both what changes frequently and what changes frequently in order to comprehend how land cover and land use change. You can use geo-registered, multi-temporal remote sensing data to search for changes in attributes of land use and cover when using digital change detection in remote sensing. First off, it makes it easier to spot differences between two or more dates that don't fit the mold of regular fluctuation. Accurate change detection is necessary to account for land use changes, habitat destruction, deforestation rates, coastal changes, urban sprawl, and other cumulative changes. To detect these changes, they also employ digital image processing tools. Both at the micro level of macro planning and at the macro level, it is critical to monitor changes in land use and cover. To effectively use and prepare for our resources, we need more information regarding the rates of change in land use and cover. There are two different sorts of land cover changes: those that occur suddenly and unexpectedly as a result of human activity, and those that occur gradually and steadily through time. Real-time and highly accurate measurements of the Earth's surface help us better understand how people and natural phenomena interact, which in turn helps us manage and utilize the natural resources on our planet. Change detection frequently uses multi-temporal datasets to examine how a certain thing changes statistically over time. It is a method for determining or describing changes in land use or cover over time using data from remote sensing sensors. Researchers have investigated how to use remotely sensed data to monitor changes in land use and cover across a variety of environments. There are a lot of people who need to be able to learn about changes in land use and land cover at all levels, from local to national to macro-level planning. This indicates a manifold growth in the built-up area by 5.33 percent over the same period. Interestingly, the barren land in the study region remained constant throughout the period, maintaining a total area of 10,903.6 hectares. However, the other land use categories exhibited continuous changes. The vegetal cover, for instance, consistently decreased from 798.65 hectares in 1990 to 485.9 hectares in 2017. Furthermore, the area occupied by water bodies witnessed an initial increase from 14.08 hectares in 1990 to 172.6 hectares in 2000. However, after 2000, the area under water bodies decreased to 78.25 hectares in 2017. Despite this decline, the water bodies' area in 2017 still exceeded the area present in 1990. Lastly, the area under other land use categories experienced a decline from 1,202.1 hectares in 1990 to 260.8 hectares in 2017. This indicates a significant reduction in the area allocated to these categories over the studied period.
Temporal Technologies GIS and Remote Sensing
Prior to the invention of computers and remote sensing, the LULC shift was identified using a topographic map and a piece of lined paper. Nonetheless, when applied to a large area, this procedure was extremely time-consuming, exhausting, and labour-intensive. In the past, land mapping was a time-intensive and imprecise process. In the context of data collection from the air and space, the term 'Remote Sensing' has assumed a new technological connotation. In recent years, geospatial technology has experienced remarkable growth, resulting in an increase in the transmission and application of geographic data via GPS, remote sensing, and Geographic Information Systems (GIS) (GIS). The user-friendliness of these technologies made it possible to quickly and easily complete a variety of tasks with varying degrees of complexity. People are getting better at utilizing GIS and imaging systems to demonstrate connections, patterns, and trends between distinct information layers in a novel manner. Software companies such as ESRI and ERDAS make it simple to store, analyse, and display geographical data. They also make it simple to see how locations appear. Geographic information systems (GIS) professionals can utilize common database tools, such as querying and statistical analysis with maps (GIS). In geographic information systems (GIS), there are a number of tools for displaying and analysing different categories of data. It facilitates the connection of datasets and maps for the purpose of creating evocative descriptions and meaningful interrelationships. Standard spreadsheets lack features such as the capacity to visualize searches and overlay databases. Since GIS is unique in its ability to explain occurrences, predict ramifications, and strategize tactics for a wide variety of space-related phenomena, it is of great value to many public and private organizations. In contrast, remote sensing is a branch of science that employs sensors mounted on aircraft or satellites to collect data about the Earth's surface. Images are used to capture data, which can then be processed, analysed, and displayed in numerous ways. Land use/land cover change evaluation is one of the most important methods to examine global change in numerous locations and eras. Since then, these images have been utilized to monitor the environment and make decisions. Thematic environmental information, such as urban and agricultural areas, forests, wetland areas, and water surface areas, can be extracted from Earth's remote sensing data.
Conclusion
To examine the variations in LULC caused by a variety of environmental and human factors, it is necessary to utilize a large number of multidata images. The successful use of satellite images for the detection of LULC changes is contingent, among other things, on a comprehensive understanding of landscape characteristics, imaging technologies, and assessment-related techniques. A number of times, historical land use data has been supplemented with RS data products. It appears that RS technology will have an even greater impact in the future on monitoring changes in land cover and land use. This is because there is an increasing quantity of historical RS data, as well as decreased data costs and improved resolution from satellite platforms. Data from Geographic Information Systems (GIS) can be used to determine how LULC patterns evolve over time. This can assist you in minimizing the cumulative consequences of urban growth and ensuring that municipal services are provided in the most effective manner. Planning for a sustainable urban and environmental future necessitates accurate and thorough data on land use change. Over the past two decades, a number of international, multidisciplinary research efforts have been put up for this goal, but none have been carried out. The development of an accurate and current database with data on these changes, their importance, their frequency, and the causes of them was required for both of these programs. This is because one of the major forces influencing the change in land use is urban growth. Temporal Resolution in transient assessment, the amount of time that is supposed to pass between returning to and gaining knowledge on the same is defined as follows: Even though cities differ greatly in terms of both space and color, remote sensing appears to be a dependable technique to learn about a variety of urban features. Despite the fact that remote sensing platforms have been around for a while, they haven't been utilized as much as they could to analyse, describe, and model the fundamental characteristics of spatial processes. It is necessary to create a framework that can be modified to keep track of changes in order to comprehend spatial and temporal patterns in built-up or unbuilt-up environments. In this article, we'll demonstrate how to consider urban patterns in terms of both time and space. The traditional viewpoint, which takes a top-down perspective, sees urban structures as the end consequence of planned changes in the city (from process to structure). This is a common style of thinking in many fields, including planning, geography, and economics, to mention a few. Because it doesn't demonstrate all of the various ways that cities change, there has been some scepticism regarding this methodology. Early demographic and socioeconomic research could not be conducted at a level more granular than the aggregate level due to the inability to perform thorough temporal pattern analysis at any level other than the aggregate level. In the study of urban theory, the topic of 'How do cities grow over time?' is still open, but advancements in technology have had a significant impact. Recent research has begun to explore the concept of dynamic processes in many different areas of urban study. As a result, academics are increasingly concentrating on identifying the causes of growth rather than on new spatial patterns. Despite the fact that new urban models have improved our understanding of how things move, we still lack sufficient knowledge of the patterns and processes of urbanization due to a lack of adequate data and the appropriate theory. Urban growth, which is frequently associated with an increase in demographic, economic, social, or political activities, has a detrimental impact on LULC alterations. The expansion of urban sprawl, which is propelled by the construction of infrastructure including buildings, roads, parking lots, and other impermeable surfaces, is a sign of urbanization and poor environmental quality. The built-up area's growth has an effect on urban heat islands, pollution, water management, and the structure and functioning of cities. Therefore, the types of land cover and their geographical distribution have an impact on people's quality of life. Urban sprawl, as its name implies, is a type of urban development in which residential areas are dispersed over a considerable amount of land and great distances exist between key public services and workplaces. Because of increased population and a rise in new development, it is more prevalent in the suburbs.
Figures and tables from the paper
| Classes | 1990 | 2000 | 2010 | 2017 |
|---|---|---|---|---|
| Area (Ha) | Area (Ha) | Area (Ha) | Area (Ha) | |
| Agricultural Land | 112292.4 (89.24%) | 112511.4 (89.41%) | 111117.3 (88.30%) | 106770.3 (84.85%) |
| Builtup Area | 623.95 (0.50%) | 1630.76 (1.30%) | 3084.05 (2.45%) | 7336.69 (5.83%) |
| Barren Land | 10903.60 (8.67%) | 10903.62 (8.67%) | 10903.15 (8.66%) | 10903.67 (8.66%) |
| Vegetation | 798.65 (0.63%) | 577.36 (0.46%) | 502.76 (0.40%) | 485.93 (0.39%) |
| Waterbodies | 14.08 (0.01%) | 172.60 (0.14%) | 116.32 (0.09%) | 78.25 (0.06%) |
| Others | 1202.17 (0.96%) | 39.16 (0.03%) | 111.60 (0.09%) | 260.80 (0.21%) |
| Total | 125834.90 | 125834.9 | 125835.2 | 125835.7 |
Table text extracted from the original PDF; superscript letters are shown inline. The original table image is below.
View original table image
References
5 in the original paper- Ahmad A, Ali MJ. Levels of urbanization in West Bengal: A quantitative approach. Geogr Rev India. 2006;68(4):407-416.
- Bansal A, Karwariya S, Goyal S. Change detection in land use/land cover in Sewan watershed using remote sensing and GIS technique. Int J Adv Remote Sens GIS. 2012;1(2):208-217.
- Bhardwaj P, Kumar S. Urban expansion and land use change analysis of Karnal city in Haryana: A study based on open-source satellite data. Int J Emerg Technol Adv Eng. 2012;2(12):182-186.
- Deal B, Schunk D. Spatial dynamic modeling and urban land use transformation: A simulation approach to assessing the costs of urban sprawl. Ecol Econ. 2004;51(1-2):79-95.
- Fazal S. Urban expansion and loss of agricultural land - a GIS based study of Saharanpur city, India. Environ Urban. 2000;12(2):133-149.