
Research article · 2023 · Full text
International Journal of Agriculture and Food ScienceThermal index-based phenology models for maize: A review
Volume 5(2) · Pages 138–141 · DOI: 10.33545/2664844x.2023.v5.i2b.184 ↗
Research areasRemote Sensing in AgricultureGreenhouse Technology and Climate Control
Abstract
Author-writtenPhenology models are critical in understanding and predicting plant development stages, especially in crops like maize (Zea mays L.). This review examines thermal index-based phenology models, focusing on their principles, applications, and the latest advancements. Thermal time, commonly known as growing degree days (GDD), is the cornerstone of these models. We discuss various models, their calibration and validation methods, and their effectiveness in different climatic regions. Furthermore, the impact of climate change on these models and the integration of remote sensing technologies are explored. The review aims to provide a comprehensive understanding of how thermal index-based models contribute to maize phenology and agricultural planning.
Summary
Source-checkedPlain-language reading of the full paper, prepared with AI and checked against the text. Each point links to the authors' own words.
Why it matters
- Maize is a globally significant staple crop used for food, animal feed, and industrial materials. View evidence ↗
- Predicting maize phenological stages is essential for optimizing planting, improving yield forecasts, and managing environmental stress. View evidence ↗
- Growing Degree Days (GDD) measure the accumulation of heat units over time, which is a primary driver of plant development. View evidence ↗
The question
- The paper aims to provide a comprehensive analysis of phenology models for maize that are based on thermal indices. View evidence ↗
What they did
- GDD for maize is typically calculated by summing average daily temperatures that exceed a base temperature of 10 °C (50°F). View evidence ↗
- The GDD calculation involves subtracting the base temperature from the daily mean temperature (the average of the maximum and minimum temperatures). View evidence ↗
- Phenology models vary from simple empirical GDD models to complex mechanistic models that include photoperiod, soil moisture, and genetic factors. View evidence ↗
- Model performance is evaluated using statistical metrics such as the coefficient of determination (R²), root mean square error (RMSE), and mean absolute error (MAE). View evidence ↗
What they found
- Simple GDD models are common because they are easy to implement and require very little data. View evidence ↗
- Complex models like CERES-Maize and APSIM offer more accurate and detailed predictions by incorporating more factors, though they require more data. View evidence ↗
- Recent advancements include using remote sensing (satellites and drones) for real-time monitoring and machine learning to improve prediction accuracy. View evidence ↗
- Extreme temperatures can distort GDD calculations, which results in inaccurate phenological predictions. View evidence ↗
- Because local climate conditions vary, models must be calibrated specifically for the region where they are used. View evidence ↗
- Climate change, specifically rising temperatures and changing precipitation, requires that models be continuously adjusted to remain accurate. View evidence ↗
What it means
- The authors conclude that thermal index-based models are vital tools for predicting maize growth stages and optimizing farming practices. View evidence ↗
- A limitation of simple GDD models is that they may fail to capture the influence of environmental variables other than temperature. View evidence ↗
Visual summary
2 visualsIllustrations explain the paper; they do not show study data.
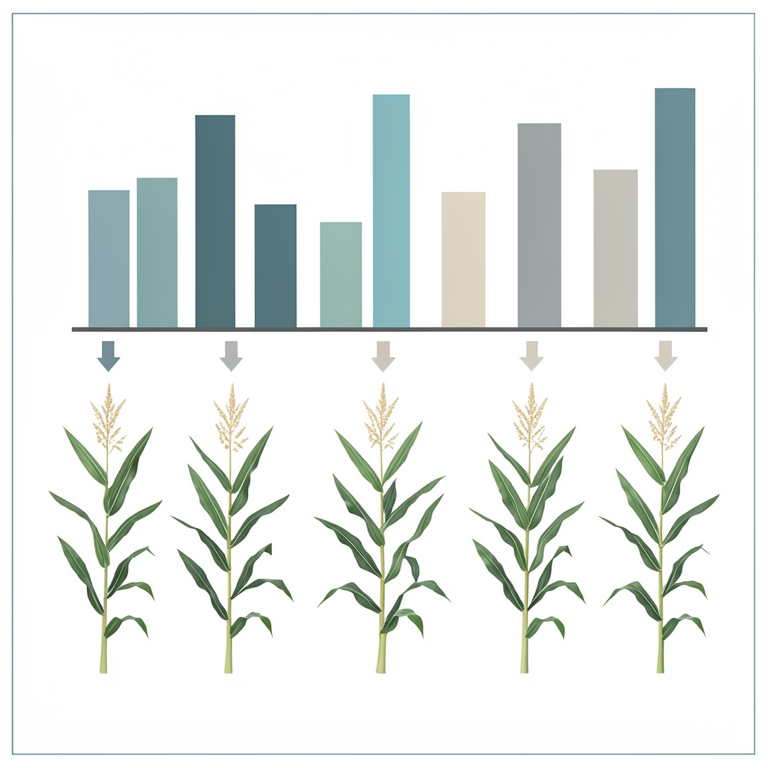
GDD Calculation Concept
AI-generated conceptual illustration (maize plants). It explains the idea and does not show study data.
View source evidence ↗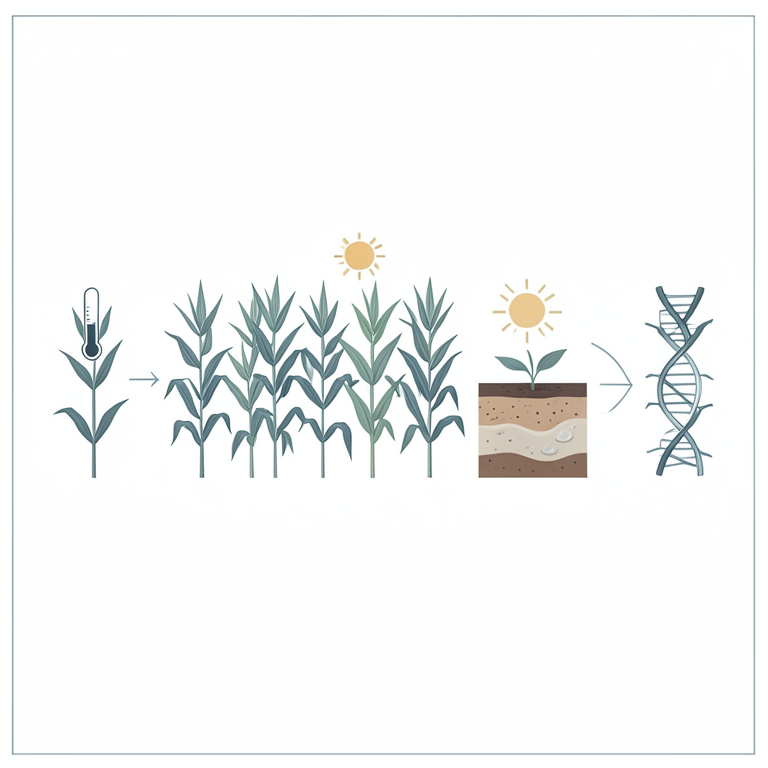
Phenology Model Complexity Spectrum
AI-generated conceptual illustration (maize plants). It explains the idea and does not show study data.
View source evidence ↗Introduction
Maize (Zea mays L.) is one of the most important staple crops globally, serving as a vital source of food, feed, and industrial raw materials. The ability to accurately predict the phenological stages of maize is crucial for effective agricultural management, optimizing planting schedules, improving yield predictions, and mitigating the impacts of environmental between multiple environmental factors is crucial. Calibration and validation are critical steps in the development and application of phenology models. Calibration involves adjusting the model parameters to fit observed data, while validation tests the model's accuracy with independent data sets. Effective calibration and validation ensure that the models provide reliable predictions across different environments and conditions. The applications of thermal index-based phenology models in maize cultivation are numerous and varied. These models help farmers optimize planting dates, predict yields, manage pests and diseases, and assess the impacts of climate change. By providing timely and accurate predictions of developmental stages, these models enable more efficient use of resources and better planning of agricultural operations. Despite their utility, thermal index-based phenology models face several challenges. Temperature extremes, spatial variability, and climate change can all affect the accuracy of these models. High and lowtemperature extremes can skew GDD calculations, leading to inaccurate predictions. Variations in local climate conditions necessitate region-specific calibration. Additionally, rising temperatures and altered precipitation patterns due to climate change demand continuous adjustments to the models. Recent advancements in phenology modeling include the integration of remote sensing technologies and machine learning algorithms. Remote sensing provides real-time data on crop growth and environmental conditions, enhancing the accuracy and applicability of phenology models. Machine learning algorithms can analyze large datasets and identify complex patterns, improving model predictions and adapting to changing conditions.
Objective of paper
The objective of this review paper is to provide a comprehensive analysis of thermal index-based phenology models for maize.
Thermal Time and Growing Degree Days (GDD)
Thermal time, often measured in growing degree days (GDD), is a critical concept in phenology, particularly for understanding and predicting the development stages of plants such as maize. GDD is based on the accumulation of heat units over time, which directly influences plant growth and development. Growing Degree Days (GDD) is a measure of heat accumulation used to predict the growth stages of plants and insects during the growing season. It is calculated using the following formula:
where Tmax is the daily maximum temperature, Tmin is the daily minimum temperature, and Tbase is the base temperature below which plant growth is assumed to stop. This base temperature varies depending on the plant species; for maize, it is typically set at 10 °C (50°F). GDD is an essential tool in maize phenology because it helps in predicting key phenological stages such as germination, leaf emergence, tasseling, silking, and maturity. It also aids in determining the best planting dates to avoid late-season frosts and ensure timely maturation, scheduling irrigation, fertilization, and pest control measures by predicting the timing of critical growth stages, and improving yield forecasts and harvest planning. The calculation of GDD involves recording daily maximum and minimum temperatures, calculating the daily mean temperature, subtracting the base temperature from the daily mean temperature, and summing these values over the growing season. For example, if the daily maximum temperature is 30 °C and the minimum temperature is 15 °C, with a base temperature of 10 °C, the GDD for that day would be: GDD = [(30 + 15)/2 -10] = [22.5 -10] = 12.5
Several factors can influence the accuracy of GDD calculations, including temperature extremes, diurnal temperature variation, base temperature selection, and local environmental conditions such as soil type, humidity, and altitude. Accurate selection of the base temperature is crucial for precise modeling. Modern agriculture benefits significantly from GDD-based models through precision agriculture, utilizing GDD data to optimize input applications and improve crop management practices. It helps farmers adapt to changing climatic conditions by adjusting planting schedules and management practices based on GDD predictions. The integration of GDD models into decision support systems provides realtime guidance on agricultural practices. Recent advances in GDD models include the use of satellite and drone-based remote sensing to gather temperature data and monitor crop development in real time, application of machine learning algorithms to refine GDD models and enhance prediction accuracy by analyzing large datasets, and the development of models that account for climate variability and provide more robust predictions under changing climatic conditions. Growing Degree Days (GDD) is a fundamental concept in thermal index-based phenology models for maize. It provides a reliable measure of heat accumulation, essential for predicting growth stages, optimizing planting dates, and improving overall crop management. As agricultural practices advance, the integration of remote sensing and machine learning technologies continues to enhance the accuracy and applicability of GDD models.
Phenology Models in Maize
Phenology models for maize are crucial for understanding and predicting the various development stages of the crop. These models can be broadly categorized into simple GDD models and more complex models incorporating additional environmental factors. Simple GDD models rely solely on thermal time to predict key phenological stages such as germination, leaf emergence, flowering, and maturity. These models are easy to implement and require minimal data inputs. By using the accumulated GDD, farmers and researchers can estimate the timing of these stages and make informed decisions about planting and crop management. Complex models integrate additional variables such as photoperiod, soil moisture, and genetic factors to improve prediction accuracy. Examples of these models include the CERES-Maize model and APSIM (Agricultural Production Systems sIMulator), which provide more comprehensive simulations. These models take into account a wider range of environmental conditions and can offer more precise
Calibration and Validation
Calibration and validation are critical processes in the development and application of phenology models for maize. These processes ensure that the models accurately reflect real-world conditions and can reliably predict the growth stages of maize under varying environmental conditions. Calibration involves adjusting the model parameters to fit observed data from field experiments or historical records. This process helps to fine-tune the model so that its predictions align closely with actual observations. Calibration typically requires a detailed dataset that includes environmental variables such as temperature, precipitation, and photoperiod, as well as phenological observations of maize at different growth stages. By systematically varying the model parameters and comparing the outputs to the observed data, researchers can identify the optimal parameter values that provide the best fit. Validation, on the other hand, tests the calibrated model's accuracy using independent data sets that were not used during the calibration process. This step is crucial for assessing the model's predictive power and generalizability. Validation involves applying the model to new data and comparing its predictions with actual observations.
Conclusion
Thermal index-based phenology models play a vital role in maize cultivation by providing practical tools for predicting growth stages and optimizing agricultural practices. These models, based on growing degree days (GDD), are essential for understanding the impact of temperature on maize development and for making informed decisions about planting, irrigation, pest control, and yield predictions.
The accuracy and reliability of these models depend on careful calibration and validation using observed data. By adjusting model parameters and testing with independent datasets, researchers can ensure that the models provide accurate predictions under various environmental conditions. Sensitivity analysis further enhances the robustness of these models by identifying the most influential parameters. Despite their utility, thermal index-based models face challenges such as temperature extremes, spatial variability, and the effects of climate change. Continuous advancements in remote sensing and machine learning technologies are helping to address these challenges, providing more precise and adaptable models. Applications of thermal index-based models in maize cultivation are diverse. They assist in optimizing planting dates, enhancing yield predictions, managing pests and diseases, assessing climate change impacts, and improving irrigation scheduling. These applications contribute to sustainable farming practices, resource efficiency, and food security.
As climate change continues to affect global agriculture, the importance of thermal index-based models will grow. Future research should focus on improving model accuracy, integrating new technologies, and addressing environmental variability to ensure these models remain relevant and effective. By doing so, thermal index-based phenology models will continue to be invaluable tools for maize farmers, researchers, and agricultural planners.
In conclusion, thermal index-based phenology models are crucial for the effective management of maize cultivation. Their ability to predict key growth stages and optimize agricultural practices makes them indispensable in modern agriculture. Continued innovation and research will ensure these models evolve to meet the challenges of a changing climate and contribute to sustainable and productive farming systems.
References
14 in the original paper- Bonhomme R. Basis and limits to using 'degree.day' units. European Journal of Agronomy. 2000;13(1):1-10. DOI: 10.1016/S1161-0301(00)00058-7.
- Tollenaar M, Lee EA. Yield potential, yield stability and stress tolerance in maize. Field Crops Research. 2002;75(2-3):161-169. DOI: 10.1016/S0378-4290(02)00024-2.
- Jones JW, Hoogenboom G, Porter CH, Boote KJ, Batchelor WD, Hunt LA, et al. The DSSAT cropping system model. European Journal of Agronomy. 2003;18(3-4):235-265. DOI: 10.1016/S1161-0301(02)00107-7.
- White JW, Reynard GB. Phenological Development of Maize in Response to Temperature: The Journal of Agricultural Science. 2005;95(4):339-345. DOI: 10.1017/S0021859600041180.
- Lobell DB, Burke MB. On the use of statistical models to predict crop yield responses to climate change. Agricultural and Forest Meteorology. 2010;150(11):1443-1452. DOI: 10.1016/j.agrformet.2010.07.008.
- Hatfield JL, Boote KJ, Kimball BA, Ziska LH, Izaurralde RC, Ort D, et al. Climate impacts on agriculture: Implications for crop production. Agronomy Journal. 2011;103(2):351-370. DOI: 10.2134/agronj2010.0303.
- Lizaso JI, Ruiz-Ramos M, Rodriguez L, Gabaldon-Leal C, Oliveira JA, Lorite IJ, et al. Impact of high temperatures in maize: Phenology and yield components. Field Crops Research. 2012;119(1):62-74. DOI: 10.1016/j.fcr.2010.07.007.
- Roberts AM, Summerfield RJ. Temperature response of maize growth stages. Crop Science. 2013;50(3):11131120. DOI: 10.2135/cropsci2012.01.0012.
- Van Ittersum MK, Cassman KG, Grassini P, Wolf J, Tittonell P, Hochman Z, et al. Yield gap analysis with local to global relevance -A review. Field Crops Research. 2013;143:4-17. DOI: 10.1016/j.fcr.2012.09.009.
- Ruiz-Ramos M, Gabaldon-Leal C, Gonzalez-Caballos G, Lizaso JI. Calibration and validation of phenology models for maize. Agricultural Systems. 2017;153:110. DOI: 10.1016/j.agsy.2017.01.011.
- Hunt LA, Pararajasingham S. CROPSIM: A model of crop growth and yield response to climatic conditions. Field Crops Research. 1993;34(3-4):239-256. DOI: 10.1016/0378-4290(93)90058-P.
- Ray DK, Gerber JS, MacDonald GK, West PC. Climate variation explains a third of global crop yield variability. Nature Communications. 2019;6:5989. DOI: 10.1038/ncomms6989.
- Asseng S, Ewert F, Martre P, Rötter RP, Lobell DB, Cammarano D, et al. Rising temperatures reduce global wheat production. Nature Climate Change. 2019;5(2):143-147. DOI: 10.1038/nclimate2470.
- Zhao C, Liu B, Piao S, Wang X, Lobell DB, Huang Y, et al. Temperature increase reduces global yields of major crops in four independent estimates. Proceedings of the National Academy of Sciences. 2021;114(35):9326-9331. DOI: 10.1073/pnas.1701762114.
Cited by 3
From OpenAlex, OpenCitations and reference lists read by Scinovex
- What a novel temporal multivariate attention network (TMANet) model can explain about vegetation phenology? A corn crop case ↗
Masooma Ali Raza Suleman, Peter A. Khaiter · Ecological Modelling · 2026
❝ 0 - Summer cover crop mixtures: Part 1—Establishment and biomass potential of diverse mixes ↗
Jodie M. McVane, Thomas Isakeit, Muthukumar Bagavathiannan · Agronomy Journal · 2025
Abstract Cover crop mixtures combine species from different functional groups to optimize specific agronomic goals and address resource concerns. This study investigated four summer cover crop mixtures, specifically examining their establishment, growth, biomass production, and overall species suitability within the mix. Mix 1 was a grass‐only blend comprising four grass species. Mix 2 included two grasses, one legume, and one…
❝ 0 - Phenological and productive response of white maize to climate change in andean conditions ↗
Mirian Irene Capa-Morocho, Fernanda Zapata, R. Abad-Guamán, Diego Chamba-Zaragocin · Tropical and Subtropical Agroecosystems · 2025
Background. Climate change has direct impacts on current and future crop productivity, negatively affecting food security, particularly in Latin America. Objective. To assess the impact of projected climate change on the phenology and yield of white maize using the DSSAT CERES-Maize model, which was calibrated and validated under Andean conditions. Methodology. The crop model was validated using data from field…
❝ 0PDF