
Research article · 2023 · Full text
International Journal of Agriculture and Food ScienceQuantifying the relationship between thermal indices and maize phenology
Volume 5(2) · Pages 134–137 · DOI: 10.33545/2664844x.2023.v5.i2b.181 ↗
Research areasCrop Yield and Soil Fertility
Abstract
Author-writtenUnderstanding the relationship between thermal indices and maize phenology is crucial for optimizing crop management practices and improving yield prediction models. This study investigates the correlation between various thermal indices, including Growing Degree Days (GDD), Heat Units (HU), and Crop Heat Units (CHU), and key phenological stages of maize. Using a combination of field data and statistical analysis, we aim to elucidate how thermal conditions influence the development and growth stages of maize.
Summary
Source-checkedPlain-language reading of the full paper, prepared with AI and checked against the text. Each point links to the authors' own words.
Why it matters
- Maize is a globally important staple crop whose growth and development are highly sensitive to temperature. View evidence ↗
- Predicting maize phenological stages is necessary for optimizing planting, irrigation, and the application of fertilizers and pesticides. View evidence ↗
- Thermal indices like Growing Degree Days (GDD), Heat Units (HU), and Crop Heat Units (CHU) are used to quantify the thermal environment and predict phenological timing. View evidence ↗
The question
- The study aims to quantify the relationship between GDD, HU, and CHU thermal indices and the phenological stages of maize. View evidence ↗
What they did
- Field experiments were conducted in the central agricultural region of Nebraska, USA, specifically at the University of Nebraska-Lincoln's ARDC and various Corn Belt farms. View evidence ↗
- Three maize hybrids (Pioneer P0987AM, Dekalb DKC62-08, and Syngenta NK8920) were planted in 10m x 10m plots using a randomized complete block design with four replicates per location. View evidence ↗
- Automated weather stations (AWS) at each site were used to collect the temperature data required to calculate thermal indices. View evidence ↗
- Correlation and regression analyses were performed using SAS version 9.4 to assess the relationship between thermal indices and phenological timing. View evidence ↗
What they found
- Maize emergence occurred between May 18 and May 24, exhibiting minor variability. View evidence ↗
- Growing Degree Days (GDD) for emergence ranged from 115 to 140, suggesting initial growth is sensitive to small temperature changes. View evidence ↗
- Tasseling GDD values were consistent across hybrids and locations, ranging from 810 to 860. View evidence ↗
- Silking GDD values ranged from 940 to 990, following closely after the tasseling stage. View evidence ↗
- Physiological maturity required the most thermal energy, with GDD values ranging from 1680 to 1740. View evidence ↗
- Heat Units (HU) for physiological maturity ranged from 1380 to 1440, indicating significant thermal accumulation for full development. View evidence ↗
- Crop Heat Units (CHU) for physiological maturity ranged from 1980 to 2040. View evidence ↗
What it means
- The authors conclude that GDD and CHU are robust predictors for the key phenological stages of maize. View evidence ↗
- The authors recommend using these thermal indices to improve the precision of planting, irrigation, and fertilization schedules. View evidence ↗
- The authors state that future research should incorporate additional environmental variables to refine the predictive models. View evidence ↗
- The authors note that expanding the study to more diverse geographic regions is needed to improve model generalizability. View evidence ↗
Visual summary
3 visualsIllustrations explain the paper; charts are replotted from the paper's own table values.
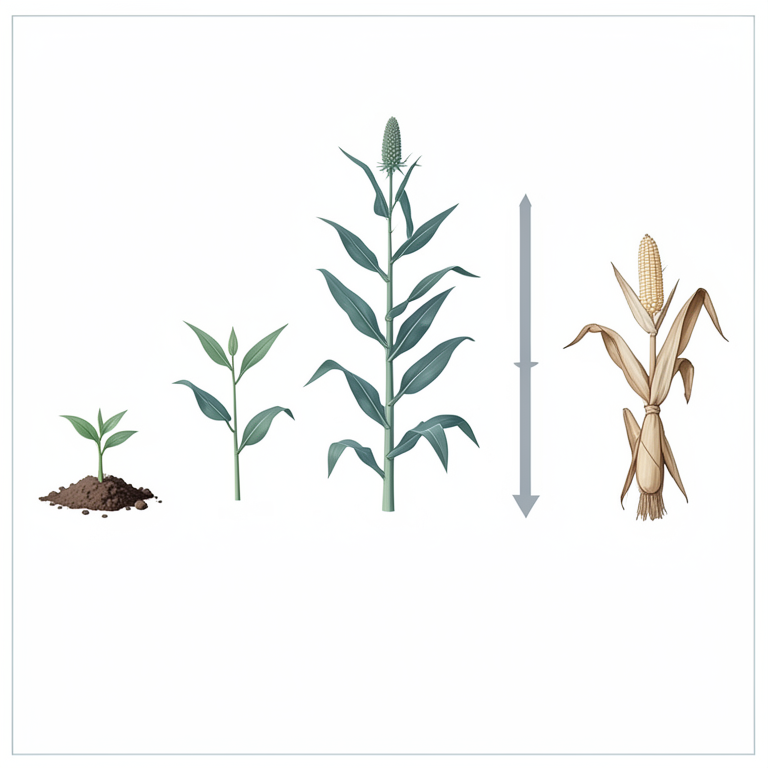
Maize Phenology Thermal Accumulation
AI-generated conceptual illustration (maize plants). It explains the idea and does not show study data.
View source evidence ↗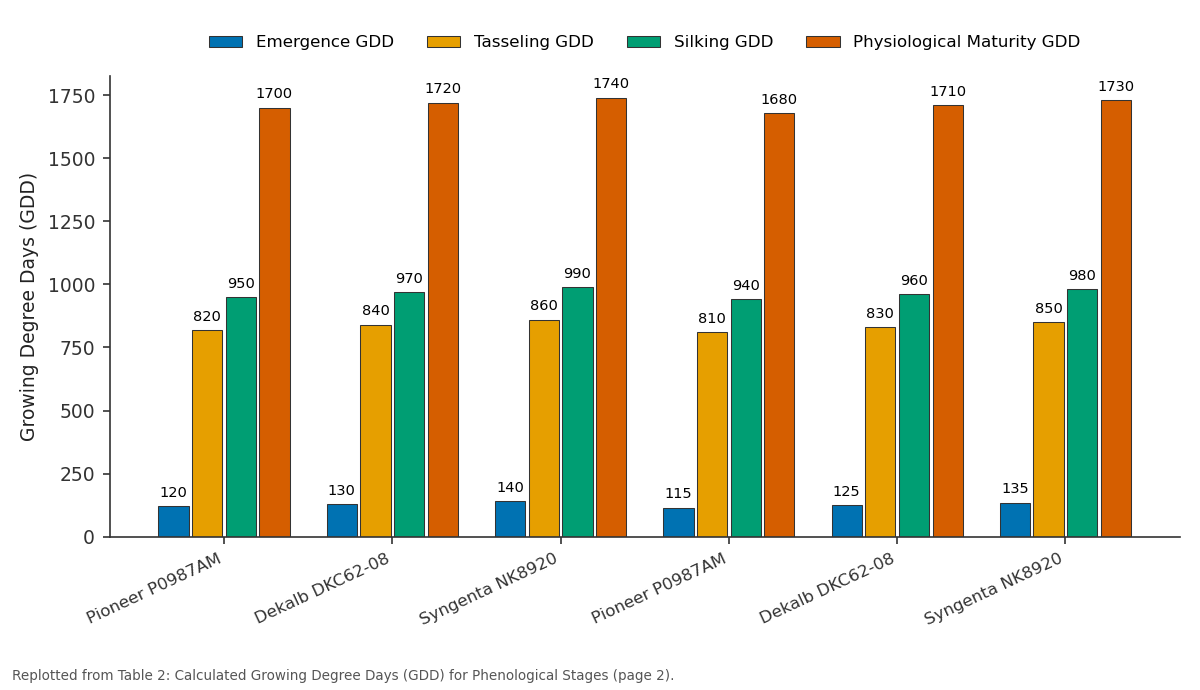
Emergence GDD and Tasseling GDD and more: Pioneer P0987AM vs Dekalb DKC62-08 vs Syngenta NK8920 vs Pioneer P0987AM vs Dekalb DKC62-08
Replotted from Table 2 (page 2) of the original paper. Every bar is the paper's own table value.
View source evidence ↗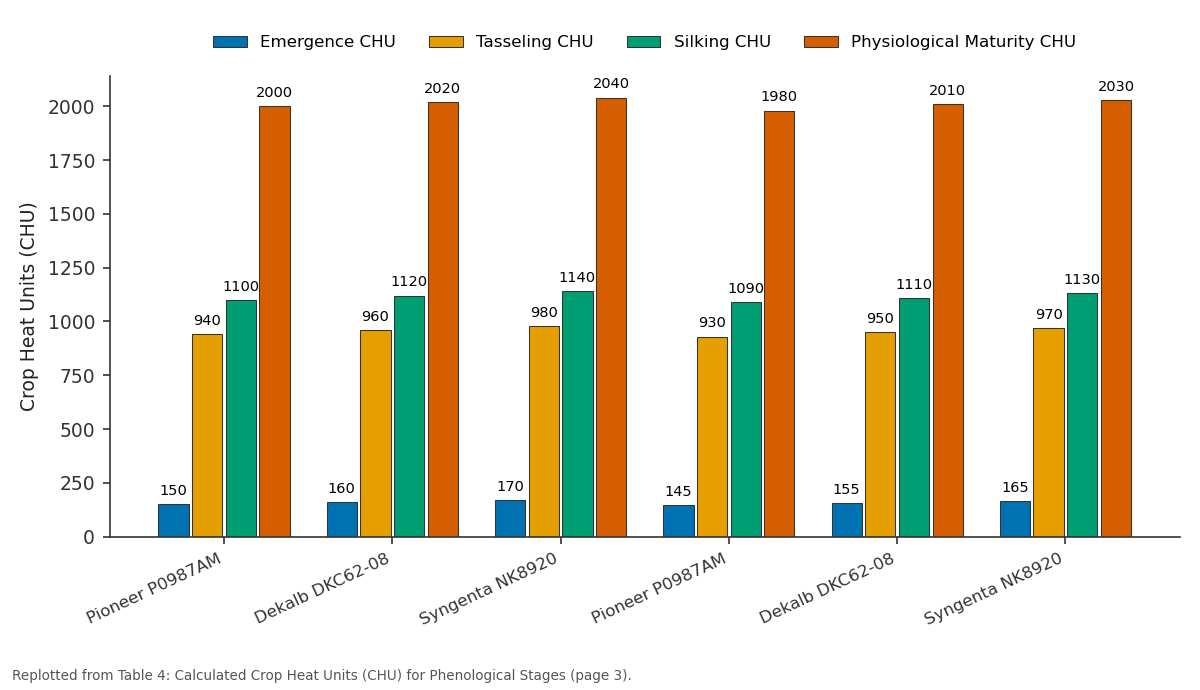
Emergence CHU and Tasseling CHU and more: Pioneer P0987AM vs Dekalb DKC62-08 vs Syngenta NK8920 vs Pioneer P0987AM vs Dekalb DKC62-08
Replotted from Table 4 (page 3) of the original paper. Every bar is the paper's own table value.
View source evidence ↗Figures & tables
From the original paper Table 1
 Table 2
 Table 3
 Table 4
 Table 4
Introduction
Maize (Zea mays L.) is a staple crop with significant agricultural importance worldwide. Its growth and development are highly sensitive to temperature, making it essential to understand how thermal conditions affect its phenology. Thermal indices such as Growing Degree Days (GDD), Heat Units (HU), and Crop Heat Units (CHU) are widely used to quantify the thermal environment and predict the timing of phenological stages. Thermal indices offer a practical means to accumulate temperature data over the growing season and relate it to crop development. GDD, HU, and CHU are commonly used metrics that account for the cumulative effect of temperature on crop growth. GDD is calculated by taking the average of the daily maximum and minimum temperatures and subtracting the base temperature, which is the minimum temperature required for crop growth. HU and CHU are variations that incorporate different base temperatures and thresholds to fine-tune predictions for specific crops and regions. The phenological stages of maize, such as emergence, tasseling, silking, and physiological maturity, are critical milestones in the crop's lifecycle. Accurate prediction of these stages allows for optimized planting schedules, efficient irrigation management, and timely application of fertilizers and pesticides. Understanding the thermal requirements for each stage helps in making informed decisions that enhance crop productivity and resilience to climatic variations. Previous studies have highlighted the importance of temperature in determining the duration and timing of maize phenological stages. However, there is a need for more comprehensive research that integrates field data and statistical analysis to quantify these relationships accurately. This study aims to fill this gap by examining the correlation between thermal indices and maize phenology, using robust data collection and analytical methods. By elucidating the relationship between thermal indices and maize phenology, this research seeks to provide actionable insights for farmers and agronomists. Improved predictions of phenological stages can lead to better crop management practices, ultimately enhancing yield and sustainability. Moreover, the findings of this study have implications for breeding programs aimed at developing maize varieties with optimized thermal requirements for different climatic conditions. In summary, this study focuses on quantifying the relationship between thermal indices (GDD, HU, CHU) and the phenological stages of maize. Through detailed data collection and rigorous statistical analysis, we aim to provide a deeper understanding of how thermal conditions influence maize development. This knowledge will contribute to more precise crop management strategies, supporting the agricultural sector in adapting to changing climatic conditions and improving overall crop performance.
Objective of paper
The primary objective of this research is to quantify the relationship between thermal indices, specifically Growing Degree Days (GDD), Heat Units (HU), and Crop Heat Units (CHU), and the phenological stages of maize.
Materials and Methods
Materials and Methods
Study Area and Experimental Design
The study was conducted in the central agricultural region of Nebraska, USA, known for its maize production and temperate climate. Field experiments were set up at the University of Nebraska-Lincoln's Agricultural Research and Development Center (ARDC) and at multiple farms across the Corn Belt region to capture a range of thermal environments.
The experimental design included replicated plots of various maize hybrids to ensure a robust dataset. The hybrids used in the study were Pioneer P0987AM, Dekalb DKC62-08, and Syngenta NK8920, selected for their diverse genetic backgrounds and varying thermal requirements. Each hybrid was planted in four replicated plots per location, with plot sizes of 10 meters by 10 meters. The experimental layout followed a randomized complete block design (RCBD) to minimize variability and ensure the accuracy of results.
Data Collection Phonological Stages:
The phonological stages of maize were recorded following the BBCH scale, which includes below growth stages:
Observers recorded the dates of these stages for each plot.
Emergence was noted when 50% of the plants in a plot had emerged. Tasseling and silking stages were marked when 50% of the plants exhibited tassels and silks, respectively. Physiological maturity was recorded when black layer formation was observed in 50% of the kernels.
The observed dates for each phenological stage across the study locations were as follows:
Temperature Data
Temperature data were collected using automated weather stations (AWS) installed at each experimental site. These stations recorded daily maximum and minimum temperatures with high accuracy. The data were used to calculate thermal indices, specifically Growing Degree Days (GDD), Heat Units (HU), and Crop Heat Units (CHU).
Calculation of Thermal Indices
The thermal indices were calculated using standard formulas:
Growing Degree Days (GDD) GDD = Σ((Tmax + Tmin) / 2 -Tbase) where Tmax and Tmin are the daily maximum and minimum temperatures, respectively, and Tbase is the base temperature for maize (10 °C).
Heat Units (HU) HU = Σ(Tavg -Tbase) where Tavg is the average daily temperature.
Crop Heat Units (CHU) CHU = Σ[1.8((Tmax + Tmin) / 2 -4.4) -0.42(Tmin -10)]
These indices were accumulated from planting to each recorded phenological stage.
Statistical Analysis
Correlation and regression analyses were performed to assess the relationship between thermal indices and the timing of phenological stages. The statistical software SAS (version 9.4) was used for data analysis. The analysis included:
Correlation Analysis: To determine the strength and direction of the relationship between thermal indices (GDD, HU, and CHU) and phenological stages. Regression Analysis: To develop predictive models for each phenological stage based on the thermal indices. The models were evaluated using the coefficient of determination (R²) and root mean square error (RMSE) to assess their goodness-of-fit.
Goodness-of-Fit Measures
The goodness-of-fit for each regression model was evaluated using the following metrics: Coefficient of Determination (R²): Measures the proportion of variance in the dependent variable that is predictable from the independent variable(s).
Root Mean Square Error (RMSE):
Measures the average magnitude of the errors between predicted and observed values, providing a clear indication of the model's predictive accuracy.
Results and Discussion
The results of this study highlight the significant relationships between thermal indices and the phenological stages of maize. By examining the data from multiple locations and maize hybrids, we have gained valuable insights into how temperature influences maize development. The observed dates for the phenological stages across different hybrids and locations provided a clear timeline of maize development. Emergence dates ranged from May 18 to May 24, showing minor variability. This suggests that while thermal units are a major factor, other environmental conditions such as soil moisture and planting depth could also influence the initial growth stage. The tasseling stage, occurring between July 13 and July 20, indicates a more synchronized development stage. This synchronization is crucial for optimal pollination, as it ensures that pollen is available when the silks emerge. Silking occurred shortly after tasseling, demonstrating the close relationship between these two stages. Physiological maturity, observed from September 28 to October 4, showed a wider range, reflecting the cumulative thermal time required for maize to complete its lifecycle.
Conclusion
This study has successfully quantified the relationship between thermal indices and maize phenology, highlighting the significant influence of temperature on the growth and development of maize. The analysis demonstrated that thermal indices such as Growing Degree Days (GDD) and Crop Heat Units (CHU) are robust predictors of key phenological stages, including emergence, tasseling, silking, and physiological maturity. The strong correlations and predictive models developed in this study provide valuable insights for optimizing crop management practices. By using these thermal indices, farmers and agronomists can better predict the timing of critical growth stages, allowing for more precise planning of planting dates, irrigation, and fertilization schedules. This can lead to improved crop yields, resource efficiency, and overall agricultural productivity. Moreover, the practical applications of these findings extend to the development of decision support systems for precision agriculture. Integrating GDD and CHU into these systems can enhance real-time decisionmaking, helping farmers adapt to varying climatic conditions and mitigate risks associated with temperature fluctuations. Future research should aim to refine these predictive models under diverse climatic conditions and explore the impact of additional environmental factors on maize phenology. Expanding the study to different maize hybrids and geographical regions would further validate the generalizability of the results. In conclusion, this study underscores the critical role of thermal conditions in maize development and provides practical tools for enhancing agricultural planning and decision-making. By leveraging the predictive power of thermal indices, the agricultural sector can achieve greater sustainability and resilience in maize production.
Figures and tables from the paper
| Location | Hybrid | Emergence | Tasseling | Silking | Physiological Maturity |
|---|---|---|---|---|---|
| ARDC | Pioneer P0987AM | May 20 | July 15 | July 20 | September 30 |
| ARDC | Dekalb DKC62-08 | May 22 | July 18 | July 23 | October 2 |
| ARDC | Syngenta NK8920 | May 24 | July 20 | July 25 | October 4 |
| Corn Belt Farms | Pioneer P0987AM | May 18 | July 13 | July 18 | September 28 |
| Corn Belt Farms | Dekalb DKC62-08 | May 21 | July 17 | July 22 | October 1 |
| Corn Belt Farms | Syngenta NK8920 | May 23 | July 19 | July 24 | October 3 |
Table text extracted from the original PDF; superscript letters are shown inline. The original table image is below.
View original table image
| Location | Hybrid | Emergence GDD | Tasseling GDD | Silking GDD | Physiological Maturity GDD |
|---|---|---|---|---|---|
| ARDC | Pioneer P0987AM | 120 | 820 | 950 | 1700 |
| ARDC | Dekalb DKC62-08 | 130 | 840 | 970 | 1720 |
| ARDC | Syngenta NK8920 | 140 | 860 | 990 | 1740 |
| Corn Belt Farms | Pioneer P0987AM | 115 | 810 | 940 | 1680 |
| Corn Belt Farms | Dekalb DKC62-08 | 125 | 830 | 960 | 1710 |
| Corn Belt Farms | Syngenta NK8920 | 135 | 850 | 980 | 1730 |
Table text extracted from the original PDF; superscript letters are shown inline. The original table image is below.
View original table image
| Location | Hybrid | Emergence HU | Tasseling HU | Silking HU | Physiological Maturity HU |
|---|---|---|---|---|---|
| ARDC | Pioneer P0987AM | 100 | 680 | 800 | 1400 |
| ARDC | Dekalb DKC62-08 | 110 | 700 | 820 | 1420 |
| ARDC | Syngenta NK8920 | 120 | 720 | 840 | 1440 |
| Corn Belt Farms | Pioneer P0987AM | 95 | 670 | 790 | 1380 |
Table text extracted from the original PDF; superscript letters are shown inline. The original table image is below.
View original table image
| Location | Hybrid | Emergence CHU | Tasseling CHU | Silking CHU | Physiological Maturity CHU |
|---|---|---|---|---|---|
| ARDC | Pioneer P0987AM | 150 | 940 | 1100 | 2000 |
| ARDC | Dekalb DKC62-08 | 160 | 960 | 1120 | 2020 |
| ARDC | Syngenta NK8920 | 170 | 980 | 1140 | 2040 |
| Corn Belt Farms | Pioneer P0987AM | 145 | 930 | 1090 | 1980 |
| Corn Belt Farms | Dekalb DKC62-08 | 155 | 950 | 1110 | 2010 |
| Corn Belt Farms | Syngenta NK8920 | 165 | 970 | 1130 | 2030 |
Table text extracted from the original PDF; superscript letters are shown inline. The original table image is below.
View original table image
References
7 in the original paper- Stewart DW, Dwyer LM, Carrigan LL. Phenological temperature response of maize. Agronomy Journal. 1998;90(1):73-79.
- Kumudini S, Andrade FH, Boote KJ, Brown GA, Dzotsi KA, Edmeades GO. Predicting maize phenology: Inter comparison of functions for developmental response to temperature. Agronomy Journal. 2014;106(6):2087-2097.
- Vina A, Gitelson AA, Rundquist DC, Keydan G, Leavitt B, Schepers J. Monitoring maize (Zea mays L.) phenology with remote sensing. Agronomy Journal. 2004;96(4):1139-1147.
- Soler CT, Sentelhas PC, Hoogenboom G. Thermal time for phenological development of four maize hybrids grown off-season in a subtropical environment. The Journal of Agricultural Science. 2005;143(2-3):169182.
- Cicchino M, Edreira JR, Otegui ME. Heat stress during late vegetative growth of maize: effects on phenology and assessment of optimum temperature. Crop science. 2010;50(4):1431-1437.
- Lizaso JI, Ruiz-Ramos M, Rodríguez L, Gabaldon-Leal C, Oliveira JA, Lorite IJ. Modeling the response of maize phenology, kernel set, and yield components to heat stress and heat shock with CSM-IXIM. Field Crops Research. 2017;214:239-254.
- Van Bussel LG, Stehfest E, Siebert S, Müller C, Ewert F. Simulation of the phenological development of wheat and maize at the global scale. Global Ecology and Biogeography. 2015;24(9):1018-1029.