
Research article · 2024 · Full text
International Journal of Research in AgronomyResponse of composts and biofertilizers on growth of black soybean (Glycine max (L.) Merrill) variety-VL 201(Bhat)
Volume 7(6) · Pages 429–435 · DOI: 10.33545/2618060x.2024.v7.i6f.905 ↗
Research areasSoybean genetics and cultivationAgronomic Practices and Intercropping Systems
Abstract
Author-writtenA field experiment was conducted at agriculture field of Himalayan University, Jollang during kharif season of 2023 and 2024 to study the response of composts and bio-fertilizers on growth and yield of black soybean [Glycine max (L.) Merr.]. The experiment was laid out in randomized block design with eight treatments and three replications. Results revealed that use of treatment T4 (Vermicompost at 2.5 kg/ha + Phosphate solubilizing bacteria at 2.5 kg/ha) recorded significantly higher plant height (14.7 cm, 25.5cm, 35.3 cm) at 30 DAS,60 DAS, 90 DAS, leave length (5.73,7.7, 9.03) at 30 DAS, 60 DAS, 90 DAS, number of leaves of plant (17.3, 26.6, 38) at 30 DAS, 60 DAS, 90 DAS, However, lowest plant height (9.9 cm, 21.6 cm, 31.6 cm) at 30 DAS, 60 DAS, 90 DAS, lowest leave length (3.96, 4.8, 7.46) at 30 DAS, 60 DAS, 90 DAS, number of leaves (12, 22, 32) at 30 DAS, 60 DAS, 90 DAS was obtained in control treatment T1. Dual inoculation of vermicompost and phosphate solubilizing bacteria improved the quality of soybean in presence of chemical fertilizers. The use of treatment T5 (Vermicompost @ 5 kg/ha + Rhizobium @ 2.5 kg/ha) and treatment T4 (Vermicompost at 2.5 kg/ha + Phosphate solubilizing bacteria at 2.5 kg/ha) gave at par results but statistically superior to control. Fresh weight at 30 DAS,60 DAS, 90 DAS (11.5 g, 20.1g, 27.1g) and dry weight at 30 DAS, 60 DAS, 90 DAS (10.3 g, 20.1 g, 30.2 g) were recorded highest with T4 (Vermicompost at 2.5 kg/ha + Phosphate solubilizing bacteria at 2.5 kg/ha).
Summary
Source-checkedPlain-language reading of the full paper, prepared with AI and checked against the text. Each point links to the authors' own words.
Why it matters
- Soybean is a globally significant legume crop valued for its nutritional properties and versatility. View evidence ↗
- Compost can enrich the soil for black soybean by improving structure, increasing water retention, and providing essential nutrients. View evidence ↗
- Biofertilizers use beneficial microorganisms, including nitrogen-fixing bacteria and phosphate solubilizing fungi, to enhance plant growth. View evidence ↗
The question
- The study aimed to evaluate how different composts and biofertilizers affect the growth and yield of black soybean. View evidence ↗
What they did
- The field experiments took place at Himalayan University, Jollang, during the kharif seasons of 2023 and 2024. View evidence ↗
- The study used a randomized block design with three replications and eight treatments, ranging from a control to various combinations of coir compost, vermicompost, biochar, and biofertilizers. View evidence ↗
- Plant height was measured in centimeters from five randomly selected plants per plot at 30, 60, and 90 days after sowing (DAS). View evidence ↗
What they found
- Treatment T4 (Vermicompost 2.5 kg/ha + PSB 2.5 kg/ha) produced the highest plant height (14.7, 25.5, and 35.3 cm at 30, 60, and 90 DAS), while the control (T1) had the lowest (9.9, 21.6, and 31.6 cm). View evidence ↗
- The number of leaves was highest in T4 (17.3, 26.6, and 38 at 30, 60, and 90 DAS) and lowest in T1 (12, 22, and 32). View evidence ↗
- T4 achieved the highest fresh weight (11.5, 20.1, and 27.1 g at 30, 60, and 90 DAS), whereas the control T1 had the lowest fresh weight (e.g., 7.8 g at 30 DAS). View evidence ↗
- Dry weight was highest in T4 (10.3, 20.1, and 30.2 g at 30, 60, and 90 DAS) and lowest in T1 (e.g., 6.8 g at 30 DAS). View evidence ↗
- Treatment T4 also performed best in terms of Crop Growth Rate (CGR) and Relative Growth Rate (RGR). View evidence ↗
What it means
- The authors conclude that integrating compost and biofertilizers can increase yields and reduce the need for synthetic fertilizers, promoting sustainability. View evidence ↗
- The authors recommend further research and the adoption of organic amendments to optimize black soybean growth. View evidence ↗
Visual summary
1 visualsIllustrations explain the paper; they do not show study data.
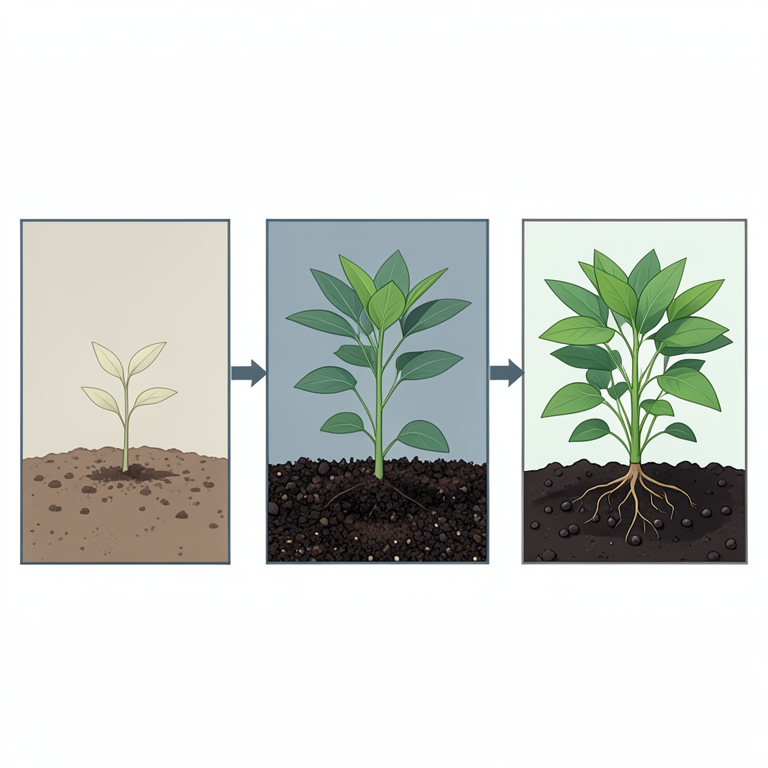
Experimental Treatment Layout
AI-generated conceptual illustration (black soybean plants (Glycine max)). It explains the idea and does not show study data.
View source evidence ↗Figures & tables
From the original paper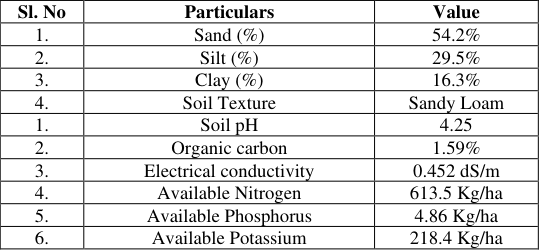 Table 1
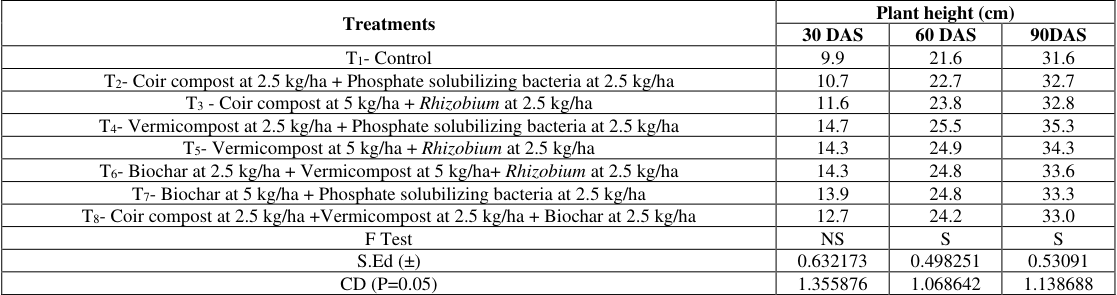 Table 2
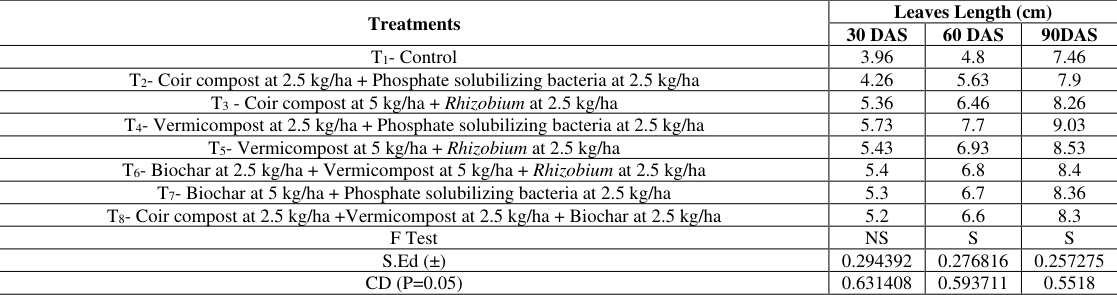 Table 3
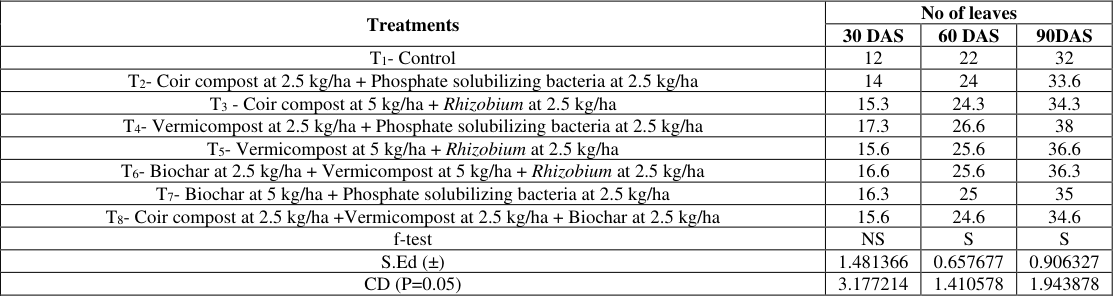 Table 4
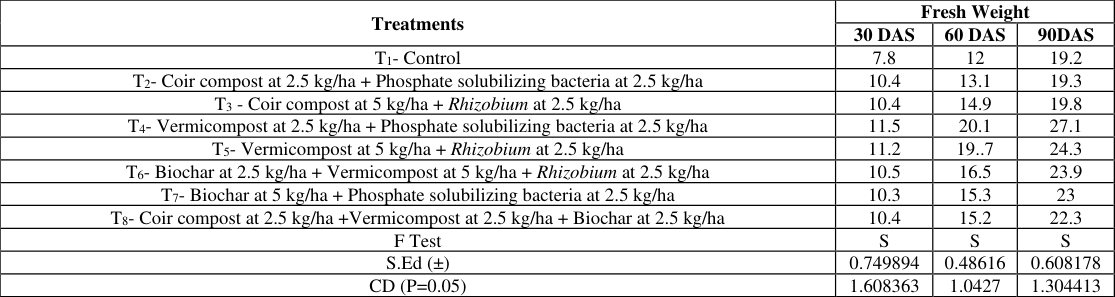 Table 5
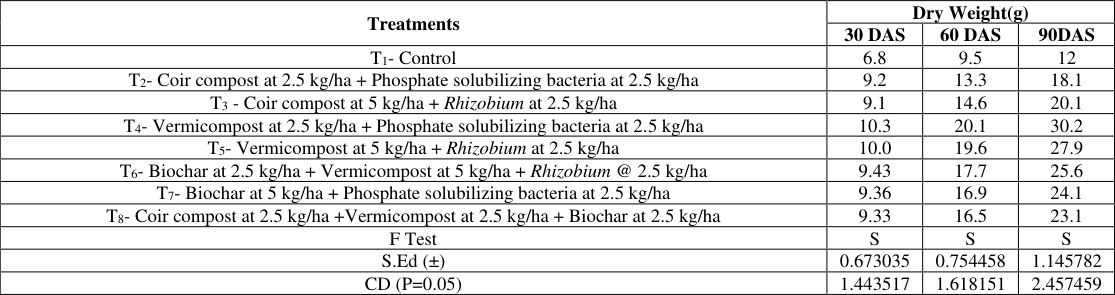 Table 6
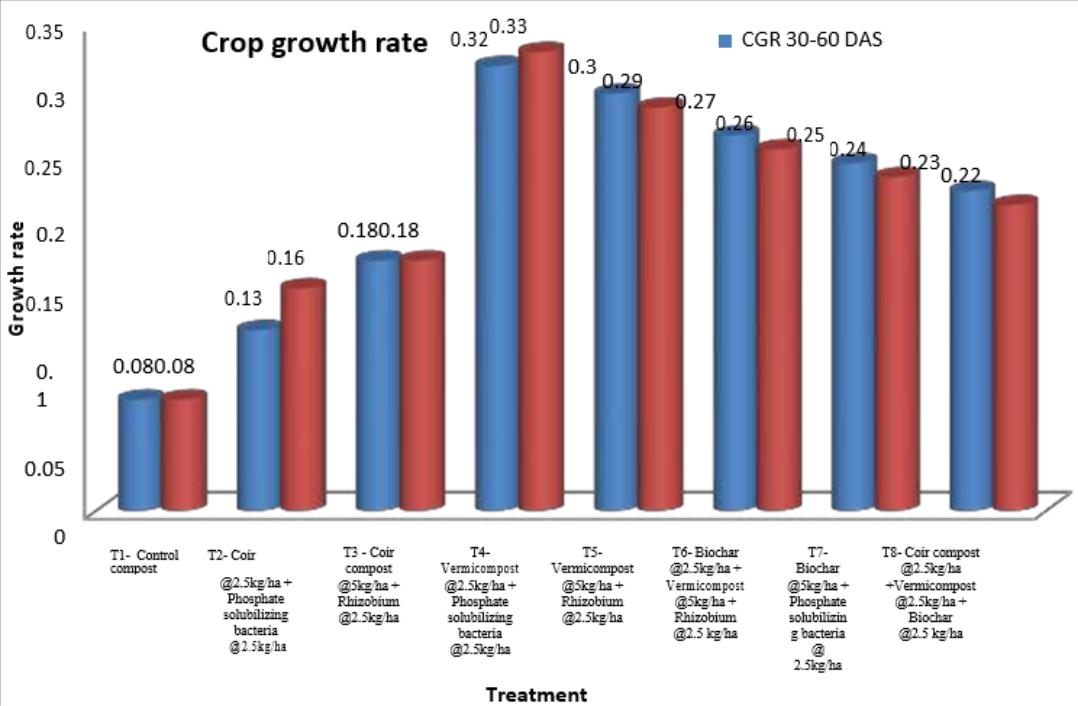 Figure 1
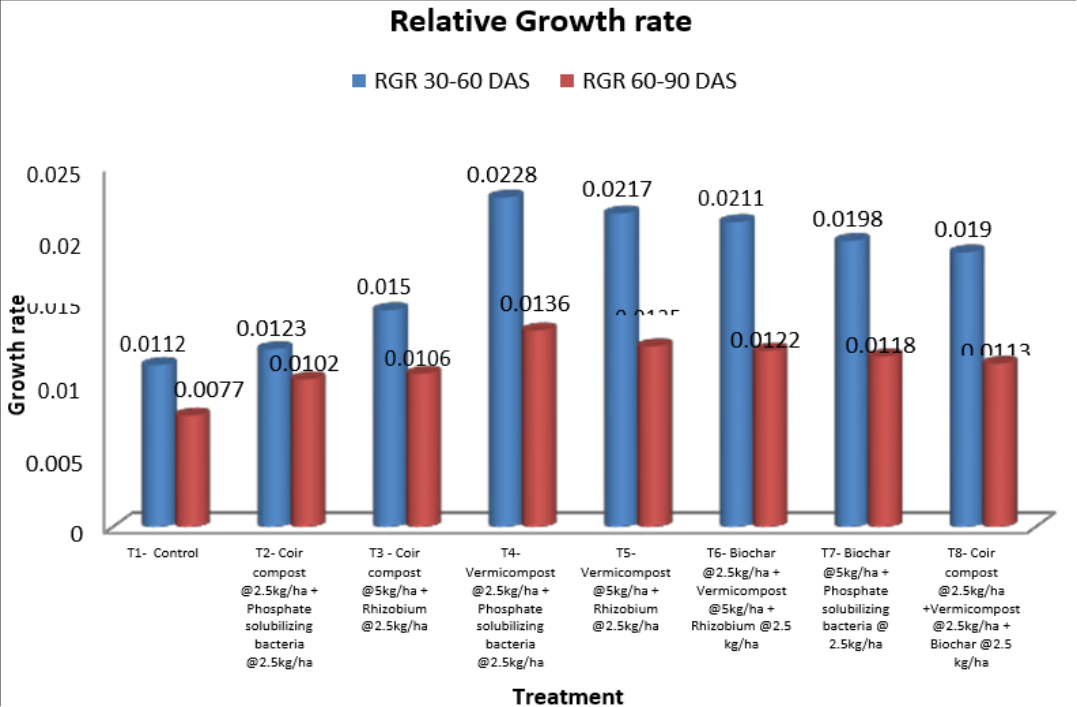 Figure 2
Introduction
Soybean (Glycine max) is an important legume crop that is widely cultivated globally due to its versatility and nutritional value. Originating from East Asia, soybean has become a major crop in countries such as the United States, Brazil, Argentina, and China. The state with the highest production of soybean in India is Madhya Pradesh. Madhya Pradesh is known as the "Soybean Bowl of India" and contributes significantly to the country's soybean production. Other major soybean-producing states in India include Maharashtra, Rajasthan, Uttar Pradesh, and Gujarat. It is valued for its high protein content, oil production, and wide range of uses in both human and animal consumption (Morya et al., 2018) [5] . Compost, known for its ability to improve soil structure, increase water retention, and provide a balanced supply of essential nutrients, serves as a valuable resource for enriching the soil environment in which black soybean plants grow. The organic matter in compost releases nutrients slowly over time, ensuring a steady supply of nitrogen, phosphorus, potassium, and micronutrients essential for plant growth. Additionally, compost enhances soil microbial activity, fostering a healthy rhizosphere environment that supports nutrient cycling and promotes plant root growth. By incorporating compost into the soil, black soybean farmers can potentially improve soil fertility, reduce the reliance on synthetic fertilizers, and enhance the overall productivity of their crops (Yaduwanshi et al., 2018) [9] . Biofertilizers, on the other hand, offer a unique approach to enhancing plant growth by harnessing the power of beneficial microorganisms such as nitrogen-fixing bacteria, phosphate solubilizing fungi, and plant growth-promoting rhizobacteria. These biofertilizers play a crucial role in improving nutrient availability and uptake by forming symbiotic relationships with plant roots, facilitating nutrient transfer and enhancing plant resilience to stress. By inoculating black soybean plants with biofertilizers, farmers can potentially increase nitrogen fixation, improve phosphorus and potassium uptake, and stimulate root development, leading to enhanced crop growth and productivity. Furthermore, the use of biofertilizers can contribute to the development of sustainable agricultural practices by reducing the reliance on chemical fertilizers and promoting eco-friendly farming methods (Soverda et al., 2009) [6] . The incorporation of composts and biofertilizers in the cultivation of black soybean has emerged as a sustainable practice with significant implications for enhancing crop growth and yield. Additionally, certain biofertilizers contain nitrogenfixing bacteria that aid in converting atmospheric nitrogen into a form usable by plants, thereby reducing the reliance on synthetic nitrogen fertilizers. Research studies, such as those conducted by Kumar et al. (2018) [4] and Singh et al. (2013) [7] , have demonstrated the effectiveness of composts and biofertilizers in improving the growth and yield of black soybean.
Materials and Methods
Field experiments were carried out during kharif season of 2023 and 2024 at agriculture field, Himalayan University, Jollang. The experimental soil belongs to the order of Vertisol, slightly acidic (4.25) in nature, high in available N (613.5 kg ha -1 ), low in available P (4.86 kg ha -1 ) and medium in available K (218.4 kg ha -1 ). The organic C content in soil was 1.59 g kg -1 . The experiment consisted of eight treatments namely T1-control, T2 (Coir compost at 2.5 kg/ha + Phosphate solubilizing bacteria at 2.5 kg/ha), T3 (Coir compost at 5 kg/ha + Rhizobium at 2.5 kg/ha), T4 (Vermicompost at 2.5 kg/ha + Phosphate solubilizing bacteria at 2.5 kg/ha), T5 (Vermicompost at 5 kg/ha + Rhizobium at 2.5 kg/ha), T6 (Biochar at 2.5 kg/ha + Vermicompost at 5 kg/ha + Rhizobium at 2.5 kg/ha), T7 (Biochar at 5 kg/ha + Phosphate solubilizing bacteria at 2.5 kg/ha), T8 (Coir compost at 2.5 kg/ha + Vermicompost at 2.5 kg/ha + Biochar at 2.5 kg/ha).Treatments were tested in RBD with three replications. The recommended dose of vermicompost and phosphate solubilizing bacteria as per treatments was first mixed in clean water to make thick slurry. This slurry was mixed with required quantity of seeds before sowing. The various methods for calculation of growth parameters are given below Plant height Plant height was taken in cm from the growth level to the tip of the plant from randomly selected 5 (five) plants in each individual plot and these plants were tagged for subsequent observation. A total of 3 (three) observation 30 DAS, 60 DAS and 90 DAS were recorded from the same plants in each plot and the average height of plant in each treatment was worked out for each observation.
Number of leaves per plant
The total number of leaves per plant was recorded 30DAS, 60DAS and 90 DAS and average number of each leaf per plant was calculated.
Fresh weight
The fresh weight of plants refers to the weight of the plant or plant parts immediately after harvest, including the water content present in the product.
Dry weight
The dry weight of a plant is the weight of the plant after all its water content has been removed. This is typically done by drying the plant material at temperatures higher than ambient temperature until all moisture is evaporated.
Crop growth rate (CGR)
The CGR explains the dry matter accumulated per unit land area per unit time (g m -2 day -1 )
Where, W1 and W2 are whole plant dry weight at time T1 -T2 respectively, ρ is the ground area on which W1 and W2 are recorded. CGR of a species are usually closely related to interception of solar radiation.
Relative growth rate (RGR)
Relative Growth Rate (RGR) expresses the total plant dry weight increase in a time interval in relation to the initial weight or dry matter increment per unit biomass per unit time or grams of dry weight increase per gram of dry weight and expressed as unit dry weight / unit dry weight / unit time (g g -1 day -1 )
Where, W1 and W2 are whole plant dry weight at T1 and T2 respectively and T1 and T2 are time interval in days.
At 30 DAS the maximum increase in plant height was observed and recorded in treatment T4(Vermicompost at 2.5 kg/ha + Phosphate solubilizing bacteria at 2.5 kg/ha),) i,e. 14.7 cm and T5 (Vermicompost at 5 kg/ha + Rhizobium at 2.5 kg/ha), i,e., 14.3 cm was found to be statistically at par with T4 (Vermicompost at 2.5 kg/ha + Phosphate solubilizing bacteria at 2.5 kg/ha). Lowest plant height was observed in treatment T1 (Control) i,e.,9.9 cm. At 60 DAS the maximum plant height was observed to be statistically significant in treatment T4 (Vermicompost at 2.5 kg/ha + Phosphate solubilizing bacteria at 2.5 kg/ha) i,e., 25.5 cm and T5 (Vermicompost at 5 kg/ha + Rhizobium at 2.5 kg/ha), i,e., 24.9 cm was found to be statistically at par with T4 (Vermicompost at 2.5 kg/ha + Phosphate solubilizing bacteria at 2.5 kg/ha). Lowest plant height was observed in treatment T1 (control) i,e., 21.6 cm. At 90 DAS the maximum plant height was observed to be statistically significant in treatment T4 (Vermicompost at 2.5 kg/ha + Phosphate solubilizing bacteria at 2.5 kg/ha),) i,e., 35.3 cm and T5 (Vermicompost at 5 kg/ha + Rhizobium at 2.5 kg/ha), i,e., 34.3 cm was found to be statistically at par with T4 (Vermicompost at 2.5 kg/ha+ Phosphate solubilizing bacteria at 2.5 kg/ha). Lowest plant height was observed in treatment T1 (Control) i,e., 31.6 cm. The probable reason for higher plant height in the T4 (Vermicompost at 2.5 kg/ha + Phosphate solubilizing bacteria at 2.5 kg/ha), tretament could be the synergistic effects of plant growth promoting bacteria (PSB) and vermicompost on plant growth. Phosphate solubilizing bacteria can enhance nutrient availability, while vermicompost provides nutrients and improves soil structure, leading to increased plant growth and height. The combination of these two factors in the T4 treatment may have resulted in optimal conditions for plant growth, hence the higher plant height compare to other treatments (Sunil et al., 2013) [8] .
Leave length
At 30 DAS the maximum increase in leave length was observed and recorded in treatment T4 (Vermicompost at 2.5 kg/ha+ Phosphate solubilizing bacteria at 2.5 kg/ha) i,e. 5.73 cm and T5 (Vermicompost at 5 kg/ha + Rhizobium at 2.5 kg/ha), i,e., 5.43 cm was found to be statistically at par with T4 (Vermicompost at 2.5 kg/ha + Phosphate solubilizing bacteria at 2.5 kg/ha). Lowest leave length was observed in treatment T1 (Control) i,e., 3.96 cm. At 60 DAS the maximum leave length was observed to be statistically significant in treatment T4 (Vermicompost at 2.5 kg/ha + Phosphate solubilizing bacteria at 2.5 kg/ha), i,e., 7.7 cm and T5 (Vermicompost at 5 kg/ha + Rhizobium at 2.5 kg/ha), i,e., 6.9 cm was found to be statistically at par with T4 (Vermicompost at 2.5 kg/ha + Phosphate solubilizing bacteria at 2.5 kg/ha),). Lowest leave length was observed in treatment T1 (control) i,e.,4.8 cm. At 90 DAS the maximum plant leave length was observed to be statistically significant in treatment T4 (Vermicompost at 2.5 kg/ha + Phosphate solubilizing bacteria at 2.5 kg/ha), i,e., 9.03 cm and T5 (Vermicompost at 5 kg/ha + Rhizobium at 2.5 kg/ha) i,e., 8.53 cm was found to be statistically at par with T4 (Vermicompost at 2.5 kg/ha + Phosphate solubilizing bacteria at 2.5 kg/ha). Lowest leave length was observed in treatment T1 (Control) i,e., 7.46 cm. The higher leaf length observed in the T4 (Vermicompost at 2.5 kg/ha + Phosphate solubilizing bacteria at 2.5 kg/ha), can be attributed to the combined effects of enhanced nutrient availability, improved soil structure, and beneficial microbial interactions. The presence of vermicompost in the T4 treatment may have contributed to improved soil structure, moisture retention, and nutrient availability, which are beneficial for leaf growth and development. The combination of Phosphate solubilizing bacteria and vermicompost in the T4 treatment likely created a synergistic effect, enhancing the plant's ability to uptake nutrients and support optimal leaf growth. The presence of beneficial microorganisms and a nutrient-rich environment may have stimulated leaf elongation and expansion, leading to the observed higher leaf length in the plants Dusane et al. (2018) [2] . [1] . Fresh Weight (g) At 30 DAS the maximum increase in fresh weight was observed and recorded in treatment T4 (Vermicompost at 2.5 kg/ha + Phosphate solubilizing bacteria at 2.5 kg/ha), i,e. 11.5 g and T5 (Vermicompost at 5 kg/ha + Rhizobium at 2.5 kg/ha), i,e., 11.2 g was found to be statistically at par with T4 (Vermicompost at 2.5 kg/ha + Phosphate solubilizing bacteria at 2.5 kg/ha). Lowest fresh weight was observed in treatment T1 (Control) i,e.,7.8 g. At 60 DAS the maximum fresh weight was observed to be statistically significant in treatment T4 (Vermicompost at 2.5 kg/ha + Phosphate solubilizing bacteria at 2.5 kg/ha), i,e., 20.1 g and T5 (Vermicompost at 5 kg/ha + Rhizobium at 2.5 kg/ha) i,e., 19.7 g was found to be statistically at par with T4 (Vermicompost at 2.5 kg/ha + Phosphate solubilizing bacteria at 2.5 kg/ha). Lowest fresh weight was observed in treatment T1 (control) i,e., 12 g.At 90 DAS the maximum fresh weight was observed to be statistically significant in treatment T4 (Vermicompost at 2.5 kg/ha + Phosphate solubilizing bacteria at 2.5 kg/ha),)i,e., 27.1 g and T5 (Vermicompost at 5 kg/ha + Rhizobium at 2.5 kg/ha), i,e., 24.3 g was found to be statistically at par with T4 (Vermicompost at 2.5 kg/ha + Phosphate solubilizing bacteria at 2.5 kg/ha). Lowest fresh weight was observed in treatment T1 (Control) i,e., 19.2 g. The probable reason for the higher fresh weight in the T4 treatment combination of (Vermicompost at 2.5 kg/ha + Phosphate solubilizing bacteria at 2.5 kg/ha), can be linked to the synergistic effects of improved nutrient availability, enhanced soil fertility, and beneficial microbial interactions. Phosphate solubilizing bacteria can enhance nutrient availability to plants by solubilizing phosphorus, which is essential for plant growth. Vermicompost, on the other hand, is a natural fertilizer that provides a wide range of nutrients and beneficial microorganisms that support plant growth. The synergistic action of phosphate solubilizing bacteria and vermicompost in the T4 treatment may have resulted in better nutrient uptake, improved growth, and ultimately higher fresh weight in the plants (Jaga et al., 2015) [3] . [8] .
Conclusion
The utilization of compost and biofertilizers represents a promising avenue for enhancing the growth and productivity of black soybean crops. Compost provides a valuable source of nutrients, improves soil structure, and supports microbial activity, leading to enhanced plant growth and soil fertility. Biofertilizers, with their beneficial microorganisms, contribute to nutrient availability, root development, and stress tolerance in black soybean plants, promoting sustainable agricultural practices. Results revealed that use of treatment T4 (Vermicompost at 2.5 kg/ha + Phosphate solubilizing bacteria at 2.5 kg/ha) recorded significantly higher plant height, number of leaves, dry weight, fresh weight and T4 (Vermicompost at 2.5 kg/ha + Phosphate solubilizing bacteria at 2.5 kg/ha) was also observed best in CGR (g m -2 day -1 ) and RGR (g g -1 day -1 ). By integrating compost and biofertilizers into cultivation techniques, farmers can improve crop yields, reduce reliance on synthetic fertilizers, and foster environmental sustainability in black soybean production. Further research and adoption of these organic amendments are key to realizing the full potential of compost and biofertilizers in optimizing the growth of black soybean and contributing to a more resilient and productive agricultural ecosystem.
Acknowledgement
AcknowledgementI would like to take this opportunity to express my deepest gratitude to the many individuals who have supported and guided me throughout the journey of completing this thesis. First and foremost, I extend my heartfelt thanks to my supervisor, Dr. Kasinam Doruk, for her invaluable mentorship, patience, and encouragement. Her expertise and unwavering support have been instrumental in shaping this research. I also appreciate the assistance provided by the technical staff and the financial support received from my parents, which made this study possible.
Figures and tables from the paper
| Sl. No | Particulars | Value |
|---|---|---|
| 1. | Sand (%) | 54.2% |
| 2. | Silt (%) | 29.5% |
| 3. | Clay (%) | 16.3% |
| 4. | Soil Texture | Sandy Loam |
| 1. | Soil pH | 4.25 |
| 2. | Organic carbon | 1.59% |
| 3. | Electrical conductivity | 0.452 dS/m |
| 4. | Available Nitrogen | 613.5 Kg/ha |
| 5. | Available Phosphorus | 4.86 Kg/ha |
| 6. | Available Potassium | 218.4 Kg/ha |
Table text extracted from the original PDF; superscript letters are shown inline. The original table image is below.
View original table image
| Treatments | Plant height (cm) | — | — |
|---|---|---|---|
| 30 DAS | 60 DAS | 90DAS | |
| T1- Control | 9.9 | 21.6 | 31.6 |
| T2- Coir compost at 2.5 kg/ha + Phosphate solubilizing bacteria at 2.5 kg/ha | 10.7 | 22.7 | 32.7 |
| T3 - Coir compost at 5 kg/ha + Rhizobium at 2.5 kg/ha | 11.6 | 23.8 | 32.8 |
| T4- Vermicompost at 2.5 kg/ha + Phosphate solubilizing bacteria at 2.5 kg/ha | 14.7 | 25.5 | 35.3 |
| T5- Vermicompost at 5 kg/ha + Rhizobium at 2.5 kg/ha | 14.3 | 24.9 | 34.3 |
| T6- Biochar at 2.5 kg/ha + Vermicompost at 5 kg/ha+ Rhizobium at 2.5 kg/ha | 14.3 | 24.8 | 33.6 |
| T7- Biochar at 5 kg/ha + Phosphate solubilizing bacteria at 2.5 kg/ha | 13.9 | 24.8 | 33.3 |
| T8- Coir compost at 2.5 kg/ha +Vermicompost at 2.5 kg/ha + Biochar at 2.5 kg/ha | 12.7 | 24.2 | 33.0 |
| F Test | NS | S | S |
| S.Ed (±) | 0.632173 | 0.498251 | 0.53091 |
| CD (P=0.05) | 1.355876 | 1.068642 | 1.138688 |
Table text extracted from the original PDF; superscript letters are shown inline. The original table image is below.
View original table image
| Treatments | Leaves Length (cm) | — | — |
|---|---|---|---|
| 30 DAS | 60 DAS | 90DAS | |
| T1- Control | 3.96 | 4.8 | 7.46 |
| T2- Coir compost at 2.5 kg/ha + Phosphate solubilizing bacteria at 2.5 kg/ha | 4.26 | 5.63 | 7.9 |
| T3 - Coir compost at 5 kg/ha + Rhizobium at 2.5 kg/ha | 5.36 | 6.46 | 8.26 |
| T4- Vermicompost at 2.5 kg/ha + Phosphate solubilizing bacteria at 2.5 kg/ha | 5.73 | 7.7 | 9.03 |
| T5- Vermicompost at 5 kg/ha + Rhizobium at 2.5 kg/ha | 5.43 | 6.93 | 8.53 |
| T6- Biochar at 2.5 kg/ha + Vermicompost at 5 kg/ha + Rhizobium at 2.5 kg/ha | 5.4 | 6.8 | 8.4 |
| T7- Biochar at 5 kg/ha + Phosphate solubilizing bacteria at 2.5 kg/ha | 5.3 | 6.7 | 8.36 |
| T8- Coir compost at 2.5 kg/ha +Vermicompost at 2.5 kg/ha + Biochar at 2.5 kg/ha | 5.2 | 6.6 | 8.3 |
| F Test | NS | S | S |
| S.Ed (±) | 0.294392 | 0.276816 | 0.257275 |
| CD (P=0.05) | 0.631408 | 0.593711 | 0.5518 |
Table text extracted from the original PDF; superscript letters are shown inline. The original table image is below.
View original table image
| Treatments | No of leaves | — | — |
|---|---|---|---|
| 30 DAS | 60 DAS | 90DAS | |
| T1- Control | 12 | 22 | 32 |
| T2- Coir compost at 2.5 kg/ha + Phosphate solubilizing bacteria at 2.5 kg/ha | 14 | 24 | 33.6 |
| T3 - Coir compost at 5 kg/ha + Rhizobium at 2.5 kg/ha | 15.3 | 24.3 | 34.3 |
| T4- Vermicompost at 2.5 kg/ha + Phosphate solubilizing bacteria at 2.5 kg/ha | 17.3 | 26.6 | 38 |
| T5- Vermicompost at 5 kg/ha + Rhizobium at 2.5 kg/ha | 15.6 | 25.6 | 36.6 |
| T6- Biochar at 2.5 kg/ha + Vermicompost at 5 kg/ha + Rhizobium at 2.5 kg/ha | 16.6 | 25.6 | 36.3 |
| T7- Biochar at 5 kg/ha + Phosphate solubilizing bacteria at 2.5 kg/ha | 16.3 | 25 | 35 |
| T8- Coir compost at 2.5 kg/ha +Vermicompost at 2.5 kg/ha + Biochar at 2.5 kg/ha | 15.6 | 24.6 | 34.6 |
| f-test | NS | S | S |
| S.Ed (±) | 1.481366 | 0.657677 | 0.906327 |
| CD (P=0.05) | 3.177214 | 1.410578 | 1.943878 |
Table text extracted from the original PDF; superscript letters are shown inline. The original table image is below.
View original table image
| Treatments | Fresh Weight | — | — |
|---|---|---|---|
| 30 DAS | 60 DAS | 90DAS | |
| T1- Control | 7.8 | 12 | 19.2 |
| T2- Coir compost at 2.5 kg/ha + Phosphate solubilizing bacteria at 2.5 kg/ha | 10.4 | 13.1 | 19.3 |
| T3 - Coir compost at 5 kg/ha + Rhizobium at 2.5 kg/ha | 10.4 | 14.9 | 19.8 |
| T4- Vermicompost at 2.5 kg/ha + Phosphate solubilizing bacteria at 2.5 kg/ha | 11.5 | 20.1 | 27.1 |
| T5- Vermicompost at 5 kg/ha + Rhizobium at 2.5 kg/ha | 11.2 | 19..7 | 24.3 |
| T6- Biochar at 2.5 kg/ha + Vermicompost at 5 kg/ha + Rhizobium at 2.5 kg/ha | 10.5 | 16.5 | 23.9 |
| T7- Biochar at 5 kg/ha + Phosphate solubilizing bacteria at 2.5 kg/ha | 10.3 | 15.3 | 23 |
| T8- Coir compost at 2.5 kg/ha +Vermicompost at 2.5 kg/ha + Biochar at 2.5 kg/ha | 10.4 | 15.2 | 22.3 |
| F Test | S | S | S |
| S.Ed (±) | 0.749894 | 0.48616 | 0.608178 |
| CD (P=0.05) | 1.608363 | 1.0427 | 1.304413 |
Table text extracted from the original PDF; superscript letters are shown inline. The original table image is below.
View original table image
| Treatments | Dry Weight(g) | — | — |
|---|---|---|---|
| 30 DAS | 60 DAS | 90DAS | |
| T1- Control | 6.8 | 9.5 | 12 |
| T2- Coir compost at 2.5 kg/ha + Phosphate solubilizing bacteria at 2.5 kg/ha | 9.2 | 13.3 | 18.1 |
| T3 - Coir compost at 5 kg/ha + Rhizobium at 2.5 kg/ha | 9.1 | 14.6 | 20.1 |
| T4- Vermicompost at 2.5 kg/ha + Phosphate solubilizing bacteria at 2.5 kg/ha | 10.3 | 20.1 | 30.2 |
| T5- Vermicompost at 5 kg/ha + Rhizobium at 2.5 kg/ha | 10.0 | 19.6 | 27.9 |
| T6- Biochar at 2.5 kg/ha + Vermicompost at 5 kg/ha + Rhizobium @ 2.5 kg/ha | 9.43 | 17.7 | 25.6 |
| T7- Biochar at 5 kg/ha + Phosphate solubilizing bacteria at 2.5 kg/ha | 9.36 | 16.9 | 24.1 |
| T8- Coir compost at 2.5 kg/ha +Vermicompost at 2.5 kg/ha + Biochar at 2.5 kg/ha | 9.33 | 16.5 | 23.1 |
| F Test | S | S | S |
| S.Ed (±) | 0.673035 | 0.754458 | 1.145782 |
| CD (P=0.05) | 1.443517 | 1.618151 | 2.457459 |
Table text extracted from the original PDF; superscript letters are shown inline. The original table image is below.
View original table image
References
9 in the original paper- Alizadeh M, Naderi MR, Mohammadi M. Effects of inorganic fertilizers on growth, yield, and yield components of soybean. Journal of Plant Nutrition. 2019;42(4):452-458.
- Dusane SS, Mukherjee S, Juwarkar AA. Influence of organic compost and phosphorus fertilization on growth, yield and nutrient uptake of soybean (Glycine max L.) in Vertisols of India. International Journal of Recycling of Organic Waste in Agriculture. 2018;7(2):109-120.
- Jaga PK, Sharma S. Effect of biofertilizer and fertilizers on productivity of soybean. Annals of Plant and Soil Research. 2015;17(2):171-174.
- Merril). Agronomy Thesis, Junagadh Agricultural University. 2009. Pages 177.
- Morya J, Tripathi RK, Kumawat N, Singh M, Yadav RK, Tomar IS, Sahu YK. Influence of organic and inorganic fertilizers on growth, yields and nutrient uptake of soybean (Glycine max Merril L.) under Jhabua Hills. International Journal of Current Microbiology and Applied Sciences. 2018;7:725-730.
- Soverda N, Hernawati T. Response of soybean crops (Glycine max (L.) Merr.) to the application of various concentrations of biological fertilizers. Journal of Agronomy. 2009;13(1):115-122.
- Singh R, Sharma HB, Kumar P, Paliwal DK, Kumar P. Effect of integrated nutrient management on growth, yield and nutrient uptake by soybean (Glycine max) cultivars. Indian Journal of Agronomy. 2013;58:379-383.
- Sunil K, Gowda A, Nagaraj R, Veeranagappa P, Jayaprakash R, Patil S. Influence of integrated nutrient management on growth, yield, nutrient uptake and economics of vegetable soybean. International Journal for Crop Improvement. 2013;4(1):24-27.
- Yaduwanshi D, Unni SPK, Khandkar UR. Response of rainfed soybean to micronutrient application in Vertisols. International Journal of Current Microbiology and Applied Sciences. 2018;7:210-220.