
Research article · 2024 · Full text
International Journal of Research in AgronomyEffect of nitrogen and phosphorus on growth and yield attributes of sweet corn
Volume 7(6S) · Pages 307–309 · DOI: 10.33545/2618060x.2024.v7.i6se.859 ↗
Research areasCrop Yield and Soil FertilityPlant nutrient uptake and metabolismRice Cultivation and Yield Improvement
Abstract
Author-writtenA field experiment was conducted during Rabi 2023 at Crop Research Farm, Department of Agriculture, Ideal college of Arts and Sciences, Vidyut Nagar, Kakinada, Andhra Pradesh. The experiment was laid out in Randomized Block Design with ten treatments which are replicated thrice on the basis of one year experimentation. The treatments consisted of 3 levels of Nitrogen (80, 100, 120 kg/ha), and Phosphorus (40, 60, 80 kg/ha) and a control. Application of Nitrogen (100 kg/ha) + Phosphorus 80 kg/ha (Treatment 9) recorded maximum Plant height (221.47 cm), Dry weight (91.01 g) per plant, Number of cobs per plant (2.17), Number of rows per cobs (16.47), cob yield (6.46 t/ha).
Summary
Source-checkedPlain-language reading of the full paper, prepared with AI and checked against the text. Each point links to the authors' own words.
Why it matters
- Maize (Zea mays L.) is a globally significant cereal crop used extensively in food and commercial products. View evidence ↗
- Nitrogen is recognized as the primary factor that limits growth in many field experiments. View evidence ↗
- Phosphorus is the second most critical nutrient for plants, playing a vital role in nucleic acids and other life-controlling processes. View evidence ↗
The question
- The study aimed to evaluate how different levels of nitrogen and phosphorus, alongside recommended fertilizer doses, affect the growth and yield of sweet corn. View evidence ↗
What they did
- The field experiment took place during the Rabi 2023 season at the Crop Research Farm in Kakinada, Andhra Pradesh. View evidence ↗
- The researchers used a Randomized Block Design with ten treatments, each replicated three times over one year. View evidence ↗
- Treatments included three levels of nitrogen (80, 100, 120 kg/ha) and phosphorus (40, 60, 80 kg/ha), plus a control group. View evidence ↗
- Seeds were sown at a rate of 8 kg/ha with a spacing of 45 x 20 cm. View evidence ↗
What they found
- The highest plant height (221.47 cm) was achieved with 100 kg/ha Nitrogen and 80 kg/ha Phosphorus, while the lowest (188.66 cm) was in the control group. View evidence ↗
- Plant dry weight peaked at 91.01 g with 100 kg/ha Nitrogen and 80 kg/ha Phosphorus, compared to a minimum of 71.82 g in the control. View evidence ↗
- The maximum number of cobs per plant (2.17) occurred with 100 kg/ha Nitrogen and 80 kg/ha Phosphorus, while the control had the fewest (1.34). View evidence ↗
- The treatment of 100 kg/ha Nitrogen and 80 kg/ha Phosphorus resulted in the most rows per cob (16.47), whereas the control had the least (10.11). View evidence ↗
- The maximum cob yield (6.46 t/ha) was recorded with 100 kg/ha Nitrogen and 80 kg/ha Phosphorus, while the control yielded the minimum (3.89 t/ha). View evidence ↗
What it means
- The study's results confirm that applying nitrogen significantly improves the grain yield of sweet corn. View evidence ↗
Visual summary
3 visualsIllustrations explain the paper; charts are replotted from the paper's own table values.
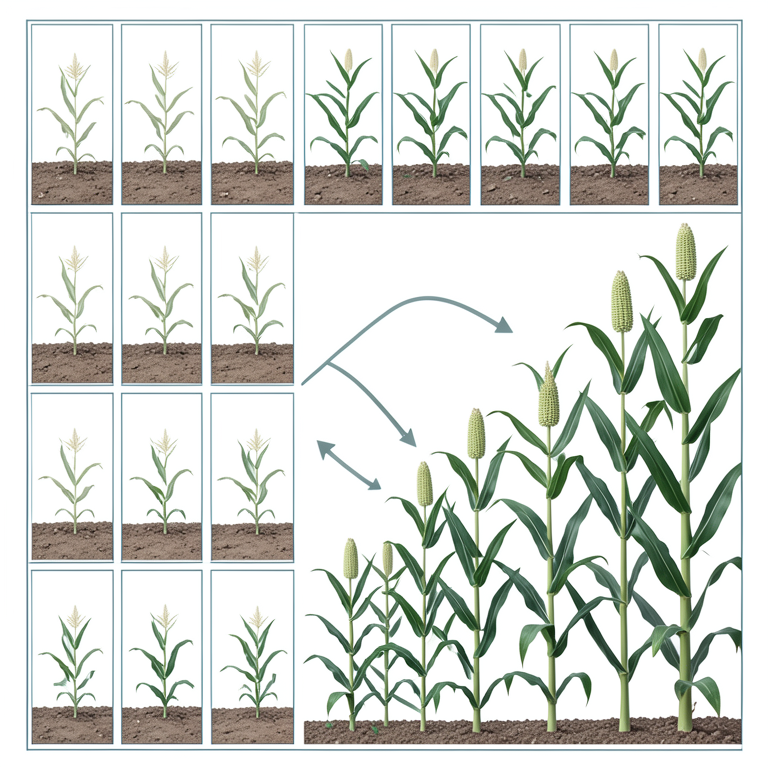
Experimental Treatment Matrix
AI-generated conceptual illustration (sweet corn plants). It explains the idea and does not show study data.
View source evidence ↗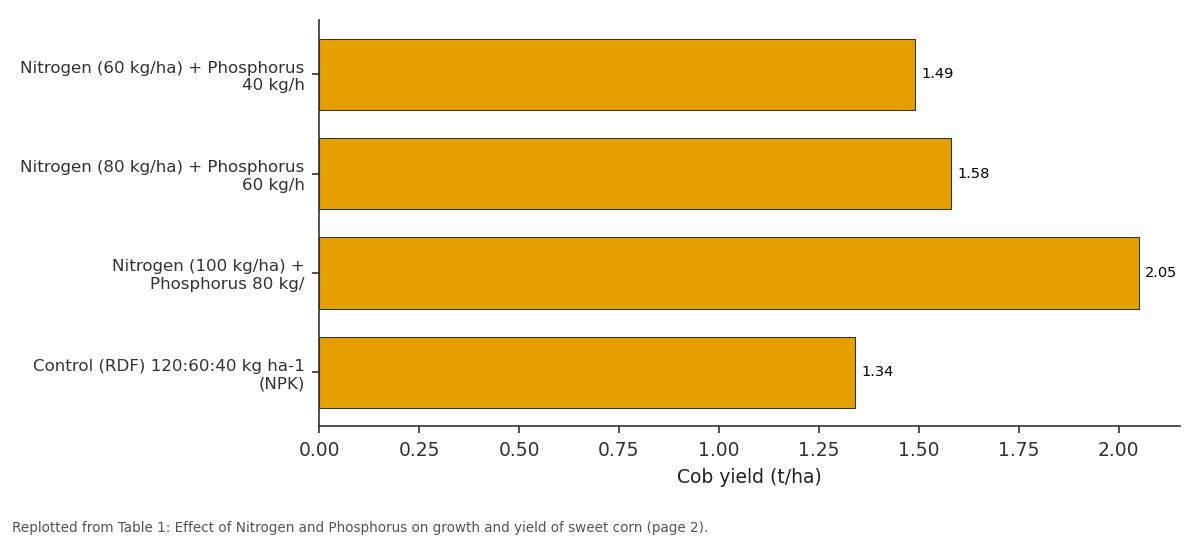
Number of cobs per plant: Nitrogen (60 kg/ha) +... vs Nitrogen (80 kg/ha) +... vs Nitrogen (100 kg/ha) +... vs Control (RDF) 120:60:40...
Replotted from Table 1 (page 2) of the original paper. Every bar is the paper's own table value.
View source evidence ↗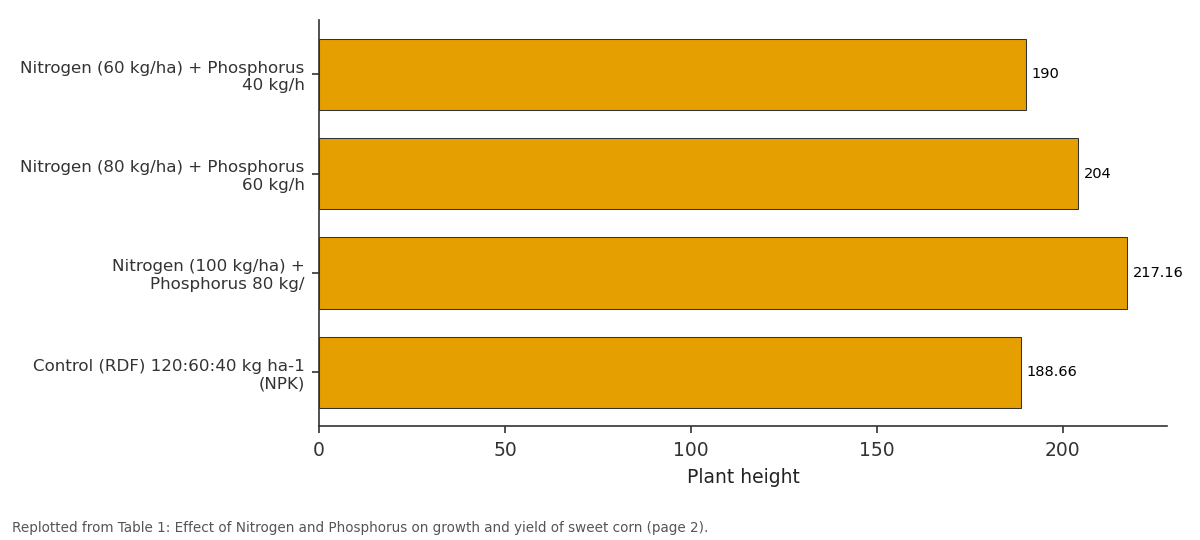
Plant height: Nitrogen (60 kg/ha) +... vs Nitrogen (80 kg/ha) +... vs Nitrogen (100 kg/ha) +... vs Control (RDF) 120:60:40...
Replotted from Table 1 (page 2) of the original paper. Every bar is the paper's own table value.
View source evidence ↗Figures & tables
From the original paper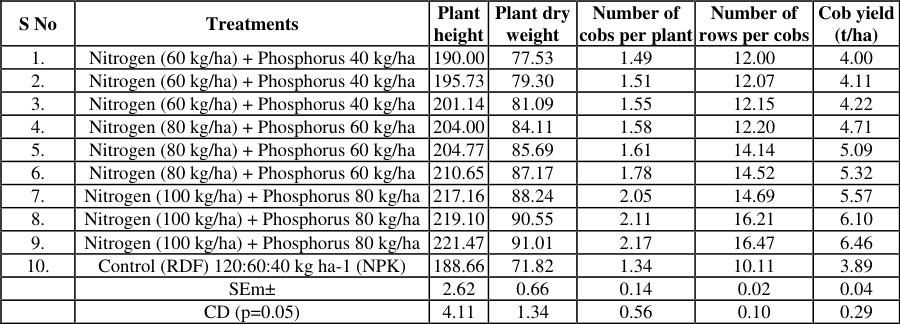 Table 1
Introduction
Maize, scientifically referred to as Zea mays L., is one of the most extensively cultivated cereals in the world and serves as a key aspect in various meals and business products. Maize, additionally referred to as corn, belongs to the circle of relatives of cornflowers and has been cultivated by way of numerous civilizations for thousands of years. Maize is broadly grown for its nutritious and flexible grain, that's used for human consumption, livestock feed and numerous commercial functions. The crop's adaptability, excessive yield capacity and flexibility make it a staple of many farming systems. After rice and wheat, corn is the 1/3 most crucial cereal crop. (Mahapatra et al. 2018) [4] . It has sturdy stems, massive leaves and produces each male flowers (tassels) and woman flora (ears) on the same plant, that is referred to as a monoecious flowering dependancy. Maize is characterised by means of tall, grass-like stalks that produce ears or cobs included with rows of seeds referred to as kernels, the main made from the crop. Kernels can vary in shade, size and form relying on the variety they may be rich in carbohydrates, vital nutrients (e.g. diet A, B vitamins), minerals (e.g. iron, zinc) and fiber further to getting used as a staple meals in numerous bureaucracy, corn is also processed into diverse merchandise consisting of corn flour, corn oil, corn syrup, corn starch, and animal feed. Corn nutritional profile (in keeping with 100 g): four g protein, 30 g carbohydrates, 3.five g fiber, 1.5 g fat, 3.6 g sugar, 4 mg calcium, zero.72 mg zinc, etc. (Tiwari et al. 2022) [5] . Nitrogen is one of the most abundant elements and is part of amino acids, proteins, nucleic acids, chlorophyll and many other metabolites necessary for plant survival. Numerous field experiments conducted around the world have shown that nitrogen is the most important growth limiting factor. Nitrogen application is one of the important soil nutrient amendments to improve the growth and yield of many crops (Reddy, 2006) [8] . Nitrogen deficiency profoundly affects the morphology and physiology of plants. Plants with low nitrogen levels will develop an increased root:shoot ratio with shortened lateral branches. Higher levels of NO3 -inhibit root growth and lead to a reduced root:shoot ratio. Phosphorus is the second important nutrient that plants need. It is an essential part of nucleic acids, phosphorylated sugars, lipids and proteins that control all life processes. Phosphorus forms high-energy phosphate bonds with adenine, guanine, and uridine, which act as energy carriers for many biological reactions. Since phosphate availability is usually low in soil, plants have developed special adaptations to acquire it using several high-affinity transporters (Raghothama, 1999) [7] .
Materials and Methods
The experiments on the effect of Nitrogen and Phosphorus along with recommended dose of fertilizers (RDF) on the growth and yield enhancement of sweet corn were conducted at Rabi season of 2023 at Crop Research Farm, Department of Agriculture, Ideal college of Arts and Sciences, Vidyut nagar, Kakinada, Andhra Pradesh. Before seed sowing operation, it was ensured that sufficient moisture for germination of seed is present in the soil. The seed was sown at the rate of 8 kg/ha. In the lines at spacing of 45 x 20 cm. Immediately after sowing the lines were closed with soil and slightly pressed so as to have good contact of seed with soil to ensure good germination.
Results: Plant height
Maximum plant height (221.47 cm) was recorded with application of Nitrogen (100 kg/ha) + Phosphorus 80 kg/ha. Whereas the minimum plant height (188.66 cm) was recorded with Control (RDF) 120:60:40 kg/ha (NPK). There was significant difference between different treatment combinations. However, Nitrogen (100 kg/ha) + Phosphorus 80 kg/ha (219.10 cm) are found statistically at par toT9.
Plant dry weight
Maximum plant dry weight (91.01 gm) was recorded with application of Nitrogen (100 kg/ha) + Phosphorus 80 kg/ha. Whereas the minimum plant dry weight (71.82 gm) was recorded with Control (RDF) 120:60:40 kg/ha (NPK). There was significant difference between different treatment combinations. However, Nitrogen (100 kg/ha) + Phosphorus 80 kg/ha (90.55 gm) are found statistically at par toT9.
Number of cobs per plant
The highest number of cobs per plant (2.17) was observed in treatment Nitrogen (100 kg/ha) + Phosphorus 80 kg/ha, whereas the lowest number of cobs per plant (1.34) was found in treatment Control (RDF) 120:60:40 kg/ha (NPK). There was significant difference between different treatment combinations. However, Nitrogen (100 kg/ha) + Phosphorus 80 kg/ha (2.11) are found statistically at par toT9.
Number of rows per cob
The highest number of rows per cob (16.47) was observed in treatment Nitrogen (100 kg/ha) + Phosphorus 80 kg/ha, whereas the lowest number of rows per cob (10.11) was found in treatment Control (RDF) 120:60:40 kg/ha (NPK). There was significant difference between different treatment combinations. However, Nitrogen (100 kg/ha) + Phosphorus 80 kg/ha (16.21) are found statistically at par toT9.
The highest cob yield (t/ha) (6.46 t/ha) was observed in treatment Nitrogen (100 kg/ha) + Phosphorus 80 kg/ha, whereas the lowest cob yield (t/ha) (3.89 t/ha) was found in treatment Control (RDF) 120:60:40 kg/ha (NPK). There was significant difference between different treatment combinations. However, Nitrogen (100 kg/ha) + Phosphorus 80 kg/ha (6.10 t/ha) are found statistically at par toT9.
Discussion
Phosphorus fertilization, also called "energy currency", improves numerous metabolic and physiological functions. Increase in growth parameters with increase in phosphorus fertilizer was also reported by Sankadiya and Sanodiya (2021) [9] . Both levels of 90 and 60 kg N/ha were significantly better than 60 kg N/ha and absolute control of yield parameters. Lower revenue records were found with absolute control. Increase in yield parameters with increase in nitrogen fertilizers was also reported by Pal et al. (2017) [6] , Singh et al. (2017) [11] , Sharma et al. (2019) [10] . These results are consistent with the findings of Reed et al. (1988) [3] , who reported that grain yield in maize is primarily due to grain number and ear weight. In addition, they reported that ear height, number of grains in a row and number of grains in an ear were the main factors of increased grain yield. Anderson et al. (1985) [1] expressed that nitrogen application resulted in increase in number of grain rows, number of grains per ear, 1000 grain weight, ear weight and grain yield as well as harvest index. The present results support a previous study by Fathi (1999) [2] who argued that nitrogen application could increase grain yield of sweet corn.
Conclusion
In conclusion, phosphorus fertilization, often referred to as the "energy currency" in plants, enhances a multitude of metabolic and physiological processes crucial for growth. Sankadiya and Sanodiya (2021) [9] demonstrated significant improvements in growth parameters with increased phosphorus fertilizer levels.
Similarly, studies by Pal et al. (2017) [6] , Singh et al. (2017) [11] , Sharma et al. (2019) [10] underscore the positive impact of nitrogen fertilizers on yield parameters. These findings align with earlier research indicating that maize grain yield depends primarily on factors such as grain number and ear weight, as reported by Reed et al. (1988) [3] . Anderson et al. (1985) [1] further support this by highlighting nitrogen's role in enhancing grain yield through increased grain rows, grains per ear, and overall harvest index. The present results affirm Fathi's (1999) [2] assertion that nitrogen application contributes significantly to enhancing sweet corn grain yield.
Figures and tables from the paper
| S No | Treatments | Plant height | Plant dry weight | Number of cobs per plant | Number of rows per cobs | Cob yield (t/ha) |
|---|---|---|---|---|---|---|
| 1. | Nitrogen (60 kg/ha) + Phosphorus 40 kg/ha | 190.00 | 77.53 | 1.49 | 12.00 | 4.00 |
| 2. | Nitrogen (60 kg/ha) + Phosphorus 40 kg/ha | 195.73 | 79.30 | 1.51 | 12.07 | 4.11 |
| 3. | Nitrogen (60 kg/ha) + Phosphorus 40 kg/ha | 201.14 | 81.09 | 1.55 | 12.15 | 4.22 |
| 4. | Nitrogen (80 kg/ha) + Phosphorus 60 kg/ha | 204.00 | 84.11 | 1.58 | 12.20 | 4.71 |
| 5. | Nitrogen (80 kg/ha) + Phosphorus 60 kg/ha | 204.77 | 85.69 | 1.61 | 14.14 | 5.09 |
| 6. | Nitrogen (80 kg/ha) + Phosphorus 60 kg/ha | 210.65 | 87.17 | 1.78 | 14.52 | 5.32 |
| 7. | Nitrogen (100 kg/ha) + Phosphorus 80 kg/ha | 217.16 | 88.24 | 2.05 | 14.69 | 5.57 |
| 8. | Nitrogen (100 kg/ha) + Phosphorus 80 kg/ha | 219.10 | 90.55 | 2.11 | 16.21 | 6.10 |
| 9. | Nitrogen (100 kg/ha) + Phosphorus 80 kg/ha | 221.47 | 91.01 | 2.17 | 16.47 | 6.46 |
| 10. | Control (RDF) 120:60:40 kg ha-1 (NPK) | 188.66 | 71.82 | 1.34 | 10.11 | 3.89 |
| SEm± | 2.62 | 0.66 | 0.14 | 0.02 | 0.04 | |
| CD (p=0.05) | 4.11 | 1.34 | 0.56 | 0.10 | 0.29 |
Table text extracted from the original PDF; superscript letters are shown inline. The original table image is below.
View original table image
References
10 in the original paper- Anderson EL, Kamprath EJ, Moll RH. Prolificacy and N fertilizer effects on yield and N utilization in maize. Crop sci. 1985;25:598-602.
- Fathi Gh. Crop growth and nutrient. Jahade Daneshgahi Publications, 1999, p. 372.
- Reed AJ, Singletary GW, Schussler JR, Williamson DR. and Christy, A.L., Shading effects on dry matter and nitrogen partitioning, kernel number, and yield of maize. Crop Sci. 1988;28:819-825.
- Mahapatra A, Barik AK, Mishra GC. Integrated nutrient management on baby corn (Zea mays L.). International Journal of Bio-resource and Stress Management. 2018;9:044-048.
- Tiwari DK, Chaturvedi DP, Singh T, Kumar T, Prachi Awadhiya Y. Effect of nitrogen and sulphur levels on growth, yield and quality of maize (Zea mays L.). Pharma Innovation J. 2022;11:418-22.
- Pal B, Hirpara DS, Vora VD, Vekaria PD, Sutaria GS, Akbari KN, et al. Effect of nitrogen and phosphorus on yield and yield attributes of maize in South Saurashtra, India. International Journal of Current Microbiology and Applied Sciences. 2017;6(3):1945-1949.
- Raghothama KG. Phosphate acquisition. Annu. Rev. Plant Physiol. Plant Mol. Biol. 1999;50:665-693.
- Sankadiya S, Sanodiya L. Effect of phosphorus and potassium levels on growth and yield of maize (Zea mays L.). Pharma Innov. J. 2021;10(10):1347-1350.
- Sharma R, Adhikari P, Shrestha J, Acharya BP. Response of maize (Zea mays L.) hybrids to different levels of nitrogen. Archives of Agriculture and Environmental Science. 2019;4(3):295-299.
- Singh J, Partap R, Singh A. Effect of nitrogen and zinc on growth and yield of maize (Zea mays L.). International Journal of Bio-resource and Stress Management. 2021;12:179-185.
Cited by 1
From OpenAlex, OpenCitations and reference lists read by Scinovex
- Application of Microbial Extracellular Polymeric Substances on the Growth and Yield of Sweet Corn (Peaches and Cream) ↗
Jonathan Alunge Metuge, Erneste Havugimana, Umuraza Noella Rutayisire, Zachary Ngewoh Senwo · Open Journal of Soil Science · 2026
❝ 1PDF