
Research article · 2024 · Full text
International Journal of Agriculture Extension and Social DevelopmentPerformance of different strains of white leghorn layers
Volume 7(6S) · Pages 87–96 · DOI: 10.33545/26180723.2024.v7.i6sb.701 ↗
Research areasTree Root and Stability StudiesAgroforestry and silvopastoral systemsAgronomic Practices and Intercropping Systems
Abstract
Author-writtenAn essential tool for the formulation and assessment of selection programmes is the estimation of genetic parameters for performance traits. According to the findings of several studies, it is essential to identify and make use of birds with higher genetic potential. In order to estimate the least square mean and standard error, heritability, and genetic and phenotypic correlations for a variety of traits, including body weight at 20 weeks (BW20) and 40 weeks (BW40) and age at first egg (AFE), total eggs produced up to 40 weeks of age (EN40), egg weight at 40 weeks (EW40), and total egg mass produced up to 40 weeks of age (EM40). Some researchers reported a high value, but others reported a heritability value that was between low and moderate. The inconsistent results may be due to variations in the strains, lines, and makeup of birds utilised in the estimation procedures as well as variations in the techniques and software used to estimate genetic parameters. Planning effective breeding programmes in animal husbandry requires an understanding of genetic and phenotypic characteristics. Animal geneticists can decide whether or not a specific characteristic can be enhanced by selection, by changing management practises, or by both methods based on their heritability estimates. Egg production efficiency has increased as a result of successful selection for performance traits. Since farmers are incharge of poultry farms, which has a tiny, scattered population and minimal pedigree history, the performance testing, selection, and breeding programmes have not been carried out throughout time. Because of changes in management, a growth in the number of flocks, and an increase in flock size, estimation of phenotypic and genetic performance over time is required. For reliable genetic evaluation and the development of breeding objectives, more precise estimates of genetic parameters are needed, particularly heritability, phenotypic and genetic correlations between economic traits.
Summary
Source-checkedPlain-language reading of the full paper, prepared with AI and checked against the text. Each point links to the authors' own words.
Why it matters
- The poultry sector in India is growing rapidly, with an annual growth rate exceeding 14%. View evidence ↗
- India has a significant supply-demand gap for eggs, as the per-capita availability of 95 eggs/year/person is well below the ICMR recommendation of 182 eggs/year/person. View evidence ↗
- White Leghorn strains are used to develop egg-type chickens suited to various agro-climatic conditions through long-term selection for egg production. View evidence ↗
The question
- The study aims to estimate means, heritability, and genetic and phenotypic correlations for key performance traits: body weight (at 20 and 40 weeks), age at first egg, total eggs, egg weight, and total egg mass up to 40 weeks. View evidence ↗
What they did
- The review examines various White Leghorn lines, including IWN, IWP, IWF, IWD, IWH, IWI, and IWK, managed across different centers like the Anand Centre and ICAR-DPR in Hyderabad. View evidence ↗
- The authors use phenotypic means to assess population variations and performance levels as a basis for selection programs. View evidence ↗
- Heritability estimates are utilized to plan breeding systems and predict the response to selection. View evidence ↗
What they found
- The mean body weight at 20 weeks of age across different studies ranged from 884.61 g to 1412.25 g. View evidence ↗
- The average age at first egg (AFE) across populations ranged from 133.94 to 178.15 days. View evidence ↗
- Total egg production up to 40 weeks (EN40) ranged from 74.14 to 129.90 eggs across different populations. View evidence ↗
- Total egg mass produced up to 40 weeks (EM40) ranged from 1.41 kg to 6.07 kg. View evidence ↗
- Egg weight at 40 weeks (EW40) ranged from 47.86 g to 59.86 g. View evidence ↗
- Heritability for total egg mass (EM40) ranged from 0.07±0.07 in the IWP strain to 0.39±0.12 in the IWN strain, indicating low to medium-high heritability for performance traits. View evidence ↗
What it means
- The authors conclude that understanding heritability and correlations is essential for creating effective breeding strategies to optimize genetic potential in White Leghorn strains. View evidence ↗
- The authors recommend continued research into genetic selection methodologies to sustain and enhance the productivity and profitability of the Indian poultry sector. View evidence ↗
Visual summary
1 visualsIllustrations explain the paper; they do not show study data.
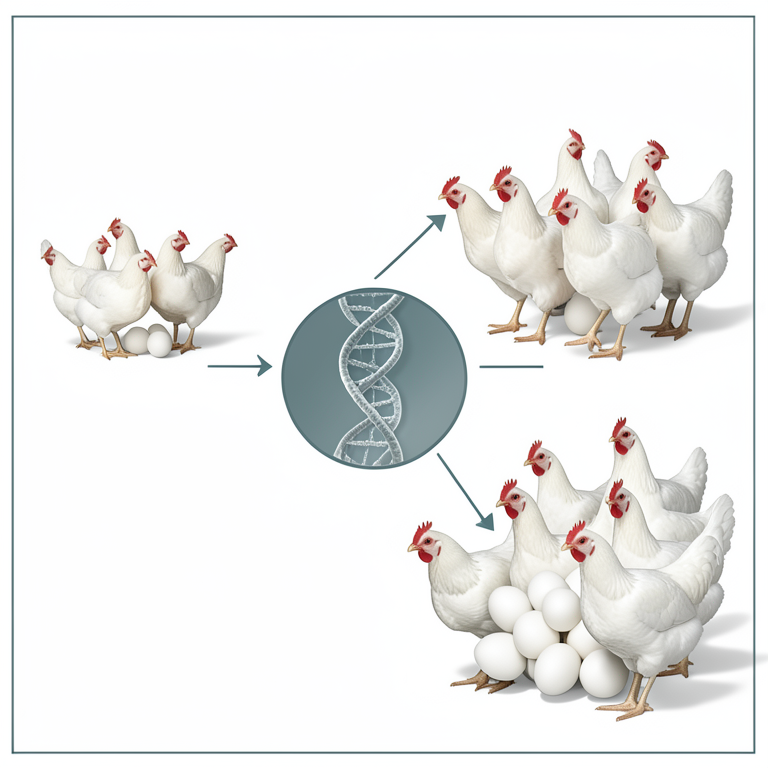
The Cycle of Genetic Improvement
AI-generated conceptual illustration (White Leghorn chickens). It explains the idea and does not show study data.
View source evidence ↗Figures & tables
From the original paper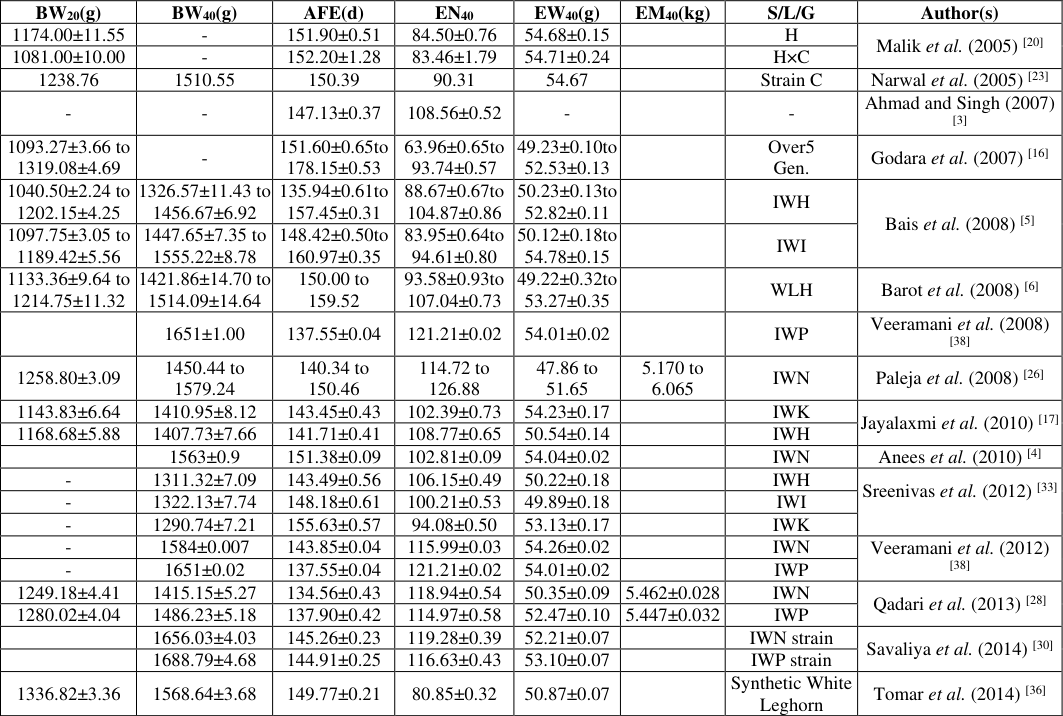 Table 1
 Table 2
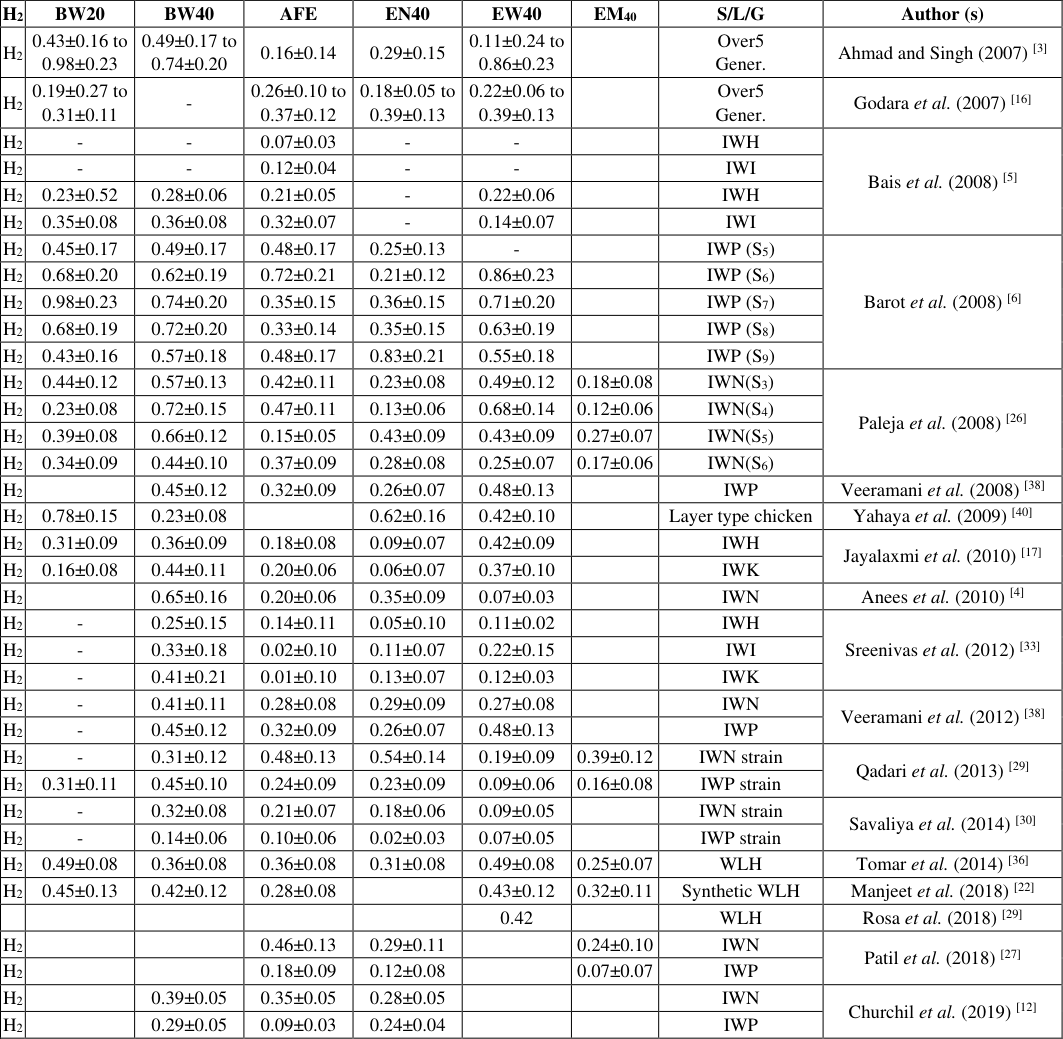 Table 2
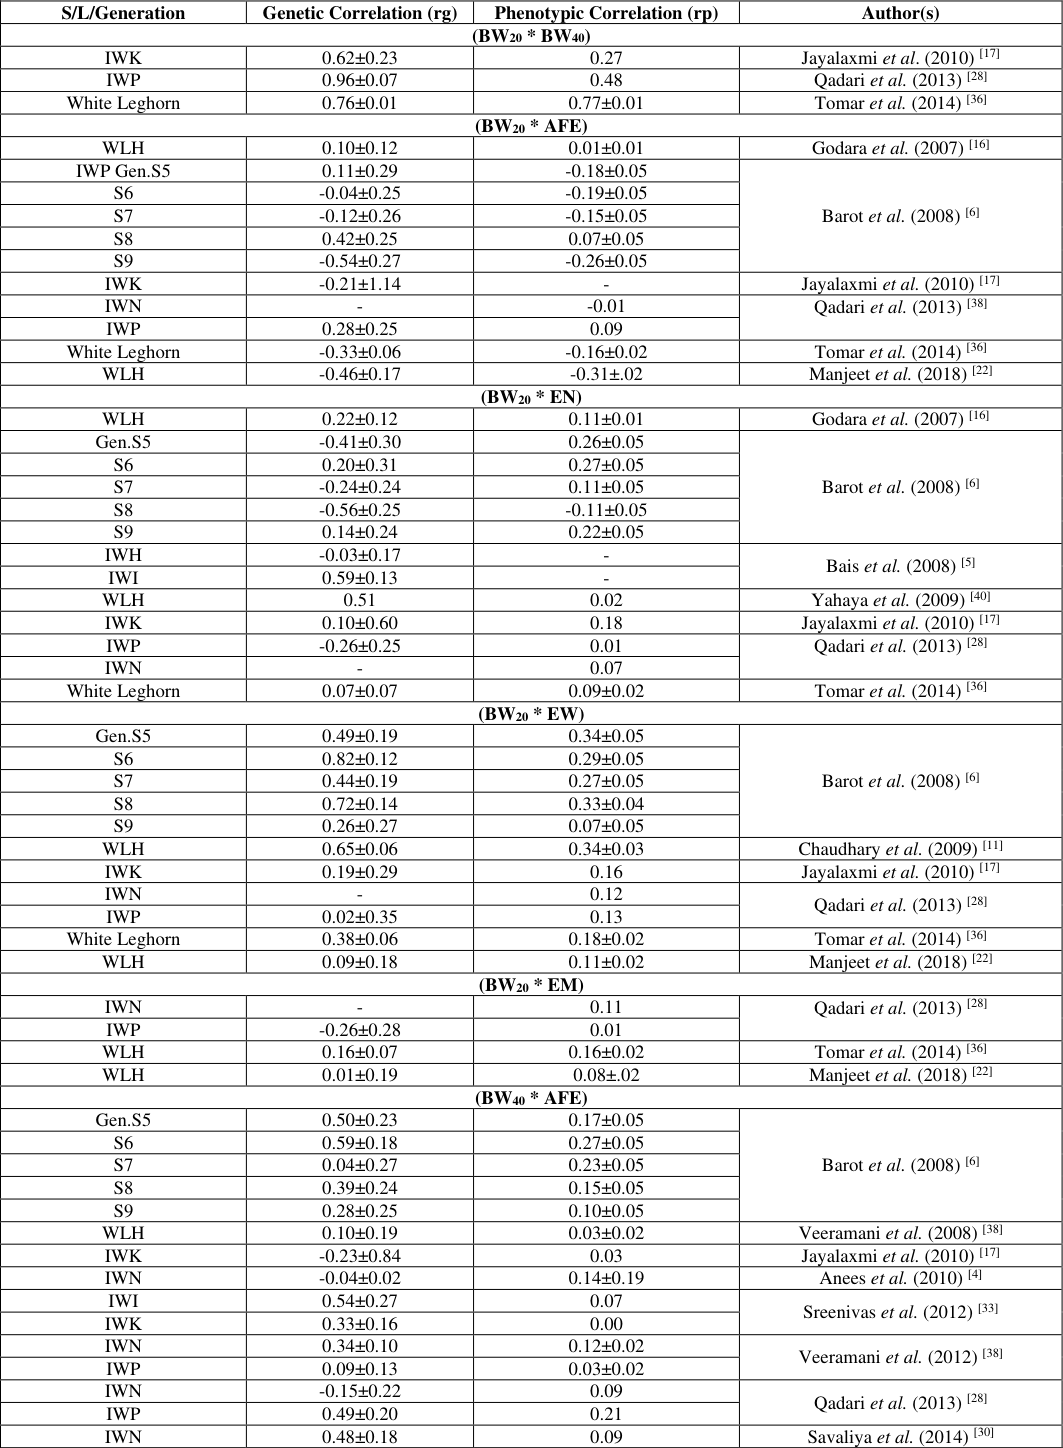 Table 3
Introduction
Poultry is one of the agricultural sectors in India that is expanding most rapidly, holding a significant position with an annual growth rate of more than 14%, contributing million tonnes or 3.6% of the world's egg production, with an annual growth rate of 6-7% (Anonyms, 2020) [2] . Poultry industry contributes about Rs. 125 trillion accounting for about 1% of the national GDP and 14% of the livestock GDP. India accounts for about 7% of global egg production and stands 3 rd in egg production while ranks 5 th in case of poultry production (FAOSTAT, 2022) [15] . The population of poultry in India was 851.81 million with an increase of 16.8% over the previous census. Total backyard poultry was 317.07 million in 2019 with an increase of 45.78%, whereas, total commercial poultry was 534.74 million in 2019 with an increase of 4.5% (20 th Livestock Census, 2019). In India, egg production is around 129.60 billion during 2021-22 and the egg production has shown positive growth as 6.19% during 2021-22. Per-capita availability of egg was 95 eggs/year/person (BAHS, 2022-23), against the recommendations of 182 eggs/year/person by Indian Council of Medical Research (ICMR). However, there is a significant supply-demand gap in India that might be closed by genetic improvement in layer birds production through selection. A well-known method for raising both genetic potential and productivity is selective breeding (Sharma and Chatterjee, 2006) [32] .
India is home to 19 registered breeds of chicken (NBAGR, 2023) [24] and almost all breeds are dual purpose and has less production as compared to commercial layers. The synthetic strain of White Leghorn has undergone long-term selection for many generations on the basis of egg production and is being maintained at different poultry farms for development of egg type strain which is suited to agro-climatic conditions of different geographical areas. White Leghorn chicken strain plays a vital role in achieving higher growth rate in egg production. As per fresh knowledge and demands have emerged, the selection and breeding strategy for poultry has evolved. In poultry breeding, the idea of two, three or fourway crossings helps to produce high-yielding contemporary strains of layer and broiler chickens. The need for the creation of specialized sire and dam lines was drive by the negative correlations between production and reproduction traits (Chambers, 1990; Fairfull and Gowe, 1990) [9,13] . A well-known method for improving both genetic potential and productivity is selective breeding (Falconer and Mackay, 1996) [14] . Access to genetic diversity and techniques for utilising it, are necessary for genetic improvement. According to Thiruvenkadan et al. (2010) [35] , a significant number of economic traits of egg-type chicken have been taken to carry selection procedure, making improvement in poultry production (Chatterjee and Bhattacharya, 2008) [10] . www.extensionjournal.com
To evaluate the population under selection in each generation, estimation of genetic parameters like heritability, genetic correlations, and phenotypic correlations is essential. Not only the genetic parameters of a population used to predict response, but they are also the foundation for future breeding and selection strategies. Estimates of the heritability of the traits for which a particular individual is chosen would determine the rate of genetic progress (Saxena and Kolluri, 2018) [31] . Genetic makeup varies from population to population, and no two populations can have the same environment. As a result, estimates of heritability for the same traits will inevitably vary between groups and generations. Therefore, it would be desirable to calculate the heritability of different economic traits in the population where the breeding programme will be implemented. More than one economic trait influences the economic value of poultry-based products, and the market forecasts simultaneous improvement in most of them. Given that numerous poultry production traits are known to be correlated with one another, these correlations may be advantageous or disadvantageous. It is of the utmost importance to understand how the development of a particular trait affects the development of another.
White Leghorn chicken and its strains
The development of location-specific chicken varieties, their maintenance, enhancement, and characterization are the primary goals of the development of different strains of White leghorn chicken strain. The use of elite layer germplasm, as well as the creation of best practices at village level is very important for disseminating the new technologies to the poultry farmers. At the ICAR -Directorate on Poultry Research, Hyderabad, two pedigreed random bred control populations -one for layers and the other for broilers, were kept. To track the genetic response and development, samples of hatching eggs from these populations are being delivered to several AICRP centers for poultry breeding. White Leghorn lines (IWN, IWP, IWF, and IWD) strains have been examined by the Anand Centre, and these strains are currently being kept and will continue to be maintained. The ICAR-DPR in Hyderabad is keeping and managing IWH, IWI, IWD, IWF, and IWK strains. IWD and IWK in Anand and M-1 and M-2 in Jabalpur are the strains that are being developed at various AICRP facilities. Since IWN and IWP have been considered to be the most promising lines and are kept for use.
Review
In many selection programmes to create high yielding breeds, genetic improvement of a variety of traits in layers is essential. To create efficient breeding plans for enhancing the economic qualities through selection, it is necessary to have a fundamental understanding of genetic parameters including heritability, genetic correlation, and phenotypic correlation. Changes in heritability estimates make it simple to quantify the genetic change brought about by selection. It's necessary to understand how changing one character affects other characters which are undergoing change at the same time. Since these estimates differ from population to population and over time, it is preferable to acquire the estimates of genetic and phenotypic parameters for each population, every generation, and for various strains or lines.
Mean values, heritability estimates, genetic and phenotypic correlations of various traits
The level of performance of a population must be known before deciding the selection programme to set and achieve the goal. The changes in phenotypic means of a selected trait are first observable effect of selection. The simplest way to observe the physical change in trait after selection is measured in the form of observed changes in means. The averages of the traits give an idea about the variations existing in the poultry population and the performance level of a population must be known before deciding the selection programme to achieve the goal. One of the most essential elements of a metric character is heritability. It expresses the percentage of the overall variance that can be attributed to the average effect of genes, which decides how similar two relatives are. However, the predictive role that heritability plays in the genetic analysis of metric features expresses the accuracy of the phenotypic value as a guide to the breeding value. Individual's phenotypic values are the only ones that can be accurately evaluated, but the breeding value determines how much of an impact they have on subsequent generations. It is most often used to describe the amount of superiority of parents above their counterparts for a given trait, which on an average is passed onto the offspring. Heritability estimates are essential to plan breeding system, to predict response to selection and genetic evaluation of selection programmes. A high estimates of heritability indicates the existence of sufficient amount of additive genetic variance which can be exploited through individual selection, where as a low estimates may suggest the use of some form of family selection or progeny testing or both. Heritability estimates are of value because they are estimates of the proportion of phenotypic variances that is additively genetic and thus serve as an indication of the rate of improvement that might be realized by selection. The heritability estimates are necessary to the breeder for planning the selection programme, predicting the response to selection and for genetic evaluation of selection programmes. The phenotypic correlation is a relationship between two characters that can be observed directly, whereas the genetic correlation is an association between the breeding values of two characters (Falconer and Mackay, 1996) [14] . The direction and magnitude of the correlations between the traits are usefully revealed by the genetic and phenotypic correlation between different economic traits. This information is very crucial for selection and breeding programmes because it can help breeders and farmers make better selection. The phenotypic correlation results from the combination of the genetic and environmental factors of correlation. When both characters have low heritability, environmental correlation plays a major role in determining the phenotypic correlation; however, when both characters have high heritability, genetic correlation takes preference (Falconer and Mackay, 1996) [14] .
Body Weight (BW20)
A pullet's body weight is a measure of its cumulative growth as well as an indicator of its genetic make-up and capacity for environmental adaptation. The effective growth is a requirement for the bird's future performance. It is directly related to the production of eggs, the weight of the eggs, reproduction, livability, and feed efficiency. The ideal body weight for egg production is difficult to determine, however the trait used to choose the pullet for more egg production is body weight at the time of hatching. Therefore, it is necessary that the pullets reach its ideal body weight during the initial stage of growth. Mean value of body weight at 20 weeks of age ranged from 884.61 g (Karuppasamy et al., 2018) [18] to 1412.25 g (Tomar et al., 2015) [37] . Heritability of BW 20 ranged from 0.16±0.08 (Jayalaxmi et al., (2010) [17] in IWK strain to 0.98±0.23 (Ahmad and Singh, 2007 and Barot et al., 2008) [3,6] in layer strain and IWP strain. The genetic correlation of BW 20 with BW 40, AFE, EN 40, EW 40 and EM 40 ranged from 0.62±0.23 (Jayalaxmi et al., 2010) [17] in IWK to 0.96±0.07 (Qadari et al., 2013) [28] in IWP strain, -0.54±0.27 (Barot et al., 2008) [6] in IWP to 0.42±0.25 (Barot et al., 2008) [6] in IWP, -0.56±0.25 (Barot et al., 2008) [6] in IWP to 0.59±0.13 (Bais et al., 2008) [5] in IWI, 0.02±0.35 (Qadari et al., 2013) [28] in IWP to 0.82±0.12 (Barot et al., 2008) [6] in IWP and -0.26±0.28 (Qadari et al., 2013) [28] in IWP to 0.16±0.07 (Tomar et al., 2014) [36] in WLH, respectively, whereas, the phenotypic correlation ranged from 0.27 (Jayalaxmi et al., 2010) [17] in IWK to 0.77±0.01 (Tomar et al., 2014) [36] in WLH, -0.31±0.02 (Manjeet et al., 2018) [22] in WLH to 0.09 (Qadari et al., 2013) [28] in IWP, -0.11±0.05 (Barot et al., 2008) [6] in IWP to 0.27±0.05 (Barot et al., 2008) [6] in IWP, 0.07±0.05 (Barot et al., 2008) [6] in IWP to 0.34±0.05 (Barot et al., 2008; Chaudhary et al., 2009) [6,11] in IWP, IWP and WLH strain and 0.01 (Qadari et al., 2013) [28] in IWP to 0.16±0.02 (Tomar et al., 2014) [36] WLH, respectively.
Body Weight (BW40)
The body weight at 40 weeks (BW 40 ) of a bird is an important trait, and it indicates its genetic constitution concerning the specific environment and its adaptability to that environment. It depends mainly on the hatching weight of chicks. Generally, heavier breeds of chicken have faster growth rates up to the marketing age in comparison to lighter chicken breeds. Within a particular chicken breed, BW 40 in flocks may depend on many factors such as the genetic merit of breeder flocks, brooding conditions, the occurrence of diseases and feed quality. Mean value of body weight at 40 weeks of age ranged from 1290.74 g (Sreenivas et al., 2012) [33] to 1688.79 g (Savaliya et al., 2014) [30] . Heritability of BW 40 ranged from 0.14±0.06 (Savaliya et al., (2014) [30] in IWP strain to 0.74±0.20 (Ahmad and Singh, 2007 and Barot et al., 2008) [3,6] in layer strain and IWP strain. The genetic correlation of BW 40 with AFE, EN 40, EW 40 and EM 40 ranged from -0.23±0.84 (Jayalaxmi et al., 2010) [17] in IWK to 0.59±0.18 (Barot et al., 2008) [6] in IWP, -0.66±0.18 (Savaliya et al., 2014) in IWN to 0.19±0.22 (Qadari et al., 2013) [28] in IWN, -0.14±0.19 (Veeramani et al., 2008) [38] in WLH to 0.68±0.14 (Barot et al., 2008) [6] in IWP strain and -0.339±0.266 (Qadari et al., 2013) [28] in IWP to 0.21±0.23 (Qadari et al., 2013) [28] in IWN, respectively, whereas, the phenotypic correlation ranged from -0.26±0.02 (Manjeet et al., 2018) [22] in WLH to 0.27±0.05 (Barot et al., 2008) [6] in IWP, -0.33±0.21 (Anees et al., 2010) [4] in IWN to 0.05±0.02 (Veeramani et al., 2012) [38] in IWP, 0.01 (Sreenivas et al., 2012) [33] in IWH to 0.45±0.04 (Barot et al., 2008; Anees et al., 2010) [6,4] in IWP and IWN strain and -0.10 (Qadari et al., 2013) [28] in IWP to 0.21±0.02 (Manjeet et al., 2018) [22] in WLH., respectively.
Age at First Egg (AFE)
Age at first egg reflects sexual maturity, a crucial feature in breeding programmes for layer birds. The type of breed, strain, nutritional state, management procedures, etc., all play an important role. Starting to lay eggs at the right age results in higher productivity in terms of egg number and egg weight. It's a significant economic feature that varies greatly as a result of both genetic and non-genetic factors.
The average age at first egg varied from 133.94 (Karuppasamy et al., 2018) [18] to 178.15 days (Godara et al., 2007) [16] in different White Leghorn chicken populations. Heritability of AFE ranged from 0.01±0.10 (Sreenivas et al., 2012) [33] in IWK to 0.72±0.21 (Barot et al., 2008) [6] in IWP strain. The genetic correlation of AFE with EN 40, EW 40 and EM 40 ranged from -1.01±0.15 (Qadari et al., 2013) [28] in IWN to -0.27±0.02 (Anees et al. 2010) [4] in IWN strain, -0.19±0.11 (Churchil et al., 2019) [12] in IWN to 0.96±0.43 (Patil et al., 2018) [27] in IWP and -1.02±0.18 (Qadari et al., 2013) [28] in IWN to -0.28±0.19 (Manjeet et al., 2018) [22] in WLH, respectively, whereas, the corresponding phenotypic correlation ranged from -0.67±0.02 (Churchil et al., 2019) [12] in IWN to 0.41±0.01 (Tomar, 2014) [36] in WLH, 0.03±0.01 (Godara et al., 2007) [16] in WLH to 0.53±0.02 (Churchil et al., 2019) [12] in IWN and -0.50 (Qadari et al., 2013) [28] in IWN to -0.28±0.02 (Manjeet et al., 2018) [22] in WLH., respectively.
Egg Number (EN40)
The most significant economic characteristic is egg production. According to studies, 80 percent of the variation in economic returns can be attributed to egg production. The number of eggs is given the most weightage in many breeding and selection procedures. It can be expressed in terms of the number of eggs produced over a specific time period or up to a certain age. Although annual egg production is the primary indicator used to assess a bird's production potential. The egg number produced up-to 40 weeks of age varied from 74.14 (Tomar et al., 2015) [37] to 129.90 (Karuppasamy et al., 2018) [18] in different White Leghorn chicken populations. Heritability of EN 40 ranged from 0.02±0.03 (Savaliya et al., 2014) [30] in IWP strain to 0.83±0.21 (Barot et al., 2008) [6] in IWP strain. The genetic correlation of EN 40 with EW 40 and EM 40 ranged from -0.81±0.21 (Barot et al., 2008; Sreenivas et al., 2012) [6, 33] in IWP and IWK to 0.35±0.50 (Jayalaxmi et al., 2010) [17] in IWK strain and 0.45±0.01 (Tomar et al., 2014) [36] in WLH to 0.97±0.03 (Qadari et al., 2013) [28] in IWN and IWP, respectively, whereas, the corresponding phenotypic correlation ranged from -0.49±0.20 (Anees et al., 2010) [4] www.extensionjournal.com in IWN to 0.03 (Sreenivas et al., 2012) [33] in IWH and -0.92 (Qadari et al., 2013) [28] in IWN to 0.94±0.01 (Tomar, 2014) [36] in WLH.
Egg Weight (EW40)
In layer type chickens, egg weight is also a significant economic trait because it has a direct impact on egg marketability. Throughout the laying stage, desired egg weight is important. Therefore, egg weight is an integral trait in the selection of layer chickens. The egg weight laid by pullets is affected by a number of genetic and nongenetic factors. Breed/strain, dwarf gene, inbreeding, etc. are all genetic factors. Nutrition, ambient temperature, egg number in the clutch, management system, medications and chemicals, disease state, any break in laying such winter pause, broodiness, moulting, etc. are non-genetic factors that may affect egg weight (Niranjan et al., 1994) [25] . The data on egg weights at various ages in various populations of layer chickens as reported by several research workers are presented in table 1. Egg weight (g) at different ages ranged from 47.86 (Paleja et al., 2008) [26] to 59.86g (Rosa et al., 2018) [29] [4,30] in IWN and IWP strain to 0.86±0.23 ((Ahmad and Singh, 2007 and Barot et al., 2008) [3, 6] in layer strain and IWP strain. The genetic correlation of EW 40 with EM 40 ranged from -0.43±0.37 (Qadari et al., 2013) [28] in IWP to 0.48±0.21 (Patil et al., 2018) [27] in IWN strain respectively, whereas, the corresponding phenotypic correlation ranged from 0.16±0.02 (Tomar et al., 2014) [36] in WLH to 0.53 (Patil et al., 2018) [27] in IWN.
Egg Mass (EM40)
Both egg number and egg weight have an impact on the price and marketability of eggs. Therefore, in terms of economic activity, egg weight and egg number are equally significant. Since both of these traits are negatively correlated, it is challenging to improve both of them at the same time. To overcome this, the egg mass is taken into account, which is defined as the amount of egg material generated by the bird taking both egg weight and egg number into consideration. The data on the total egg mass produced in different WLH -layer chicken populations up to 40 weeks of age, as reported by several research workers, are shown in the table 1. The amount of total egg mass (kg) produced upto 40 weeks of age in White Leghorn varied from 1.41 (Patil et al., 2018) [27] to 6.07 kg (Paleja et al., 2008) [26] . Heritability of EM 40 ranged from 0.07±0.07 (Patil et al., 2018) [27] in IWP strain to 0.39±0.12 (Qadari et al., 2013) [28] in IWN strain, respectively. All these estimates show that these range from low to medium high for all performance traits. While, Thangaraju and Ulaganathan (1990) [34] reported higher estimates of heritability for egg mass i.e. 0.80±0.183 in Forsgate strain and 0.68±0.166 in Meyer strain. Paleja et al., (2008) [26] reported heritability estimates for egg mass which ranged from 0.12±0.06 to 0.26±0.06. [27]
Conclusion
The poultry industry in India, particularly the sector focusing on White Leghorn chicken strains, underscores the critical role of genetic improvement through selective breeding. With significant contributions to egg production and economic output, this industry faces challenges such as meeting the demand-supply gap and optimizing genetic potential across various economic traits like body weight, age at first egg, egg number, egg weight, and egg mass.
Understanding genetic parameters such as heritability, genetic, and phenotypic correlations is essential for formulating effective breeding strategies. Continued research and development in genetic selection methodologies are crucial for sustaining and enhancing the productivity and profitability of India's poultry sector amidst evolving market demands and environmental conditions.
Figures and tables from the paper
| H2 | BW20 | BW40 | AFE | EN40 | EW40 | EM40 | S/L/G | Author (s) |
|---|---|---|---|---|---|---|---|---|
| H2 | 0.43±0.16 to 0.98±0.23 | 0.49±0.17 to 0.74±0.20 | 0.16±0.14 | 0.29±0.15 | 0.11±0.24 to 0.86±0.23 | Over5 Gener. | Ahmad and Singh (2007) [3] | |
| H2 | 0.19±0.27 to 0.31±0.11 | - | 0.26±0.10 to 0.37±0.12 | 0.18±0.05 to 0.39±0.13 | 0.22±0.06 to 0.39±0.13 | Over5 Gener. | Godara et al. (2007) [16] | |
| H2 | - | - | 0.07±0.03 | - | - | IWH | Bais et al. (2008) [5] | |
| H2 | - | - | 0.12±0.04 | - | - | IWI | ||
| H2 | 0.23±0.52 | 0.28±0.06 | 0.21±0.05 | - | 0.22±0.06 | IWH | ||
| H2 | 0.35±0.08 | 0.36±0.08 | 0.32±0.07 | - | 0.14±0.07 | IWI | ||
| H2 | 0.45±0.17 | 0.49±0.17 | 0.48±0.17 | 0.25±0.13 | - | IWP (S5) | Barot et al. (2008) [6] | |
| H2 | 0.68±0.20 | 0.62±0.19 | 0.72±0.21 | 0.21±0.12 | 0.86±0.23 | IWP (S6) | ||
| H2 | 0.98±0.23 | 0.74±0.20 | 0.35±0.15 | 0.36±0.15 | 0.71±0.20 | IWP (S7) | ||
| H2 | 0.68±0.19 | 0.72±0.20 | 0.33±0.14 | 0.35±0.15 | 0.63±0.19 | IWP (S8) | ||
| H2 | 0.43±0.16 | 0.57±0.18 | 0.48±0.17 | 0.83±0.21 | 0.55±0.18 | IWP (S9) | ||
| H2 | 0.44±0.12 | 0.57±0.13 | 0.42±0.11 | 0.23±0.08 | 0.49±0.12 | 0.18±0.08 | IWN(S3) | Paleja et al. (2008) [26] |
| H2 | 0.23±0.08 | 0.72±0.15 | 0.47±0.11 | 0.13±0.06 | 0.68±0.14 | 0.12±0.06 | IWN(S4) | |
| H2 | 0.39±0.08 | 0.66±0.12 | 0.15±0.05 | 0.43±0.09 | 0.43±0.09 | 0.27±0.07 | IWN(S5) | |
| H2 | 0.34±0.09 | 0.44±0.10 | 0.37±0.09 | 0.28±0.08 | 0.25±0.07 | 0.17±0.06 | IWN(S6) | |
| H2 | 0.45±0.12 | 0.32±0.09 | 0.26±0.07 | 0.48±0.13 | IWP | Veeramani et al. (2008) [38] | ||
| H2 | 0.78±0.15 | 0.23±0.08 | 0.62±0.16 | 0.42±0.10 | Layer type chicken | Yahaya et al. (2009) [40] | ||
| H2 | 0.31±0.09 | 0.36±0.09 | 0.18±0.08 | 0.09±0.07 | 0.42±0.09 | IWH | Jayalaxmi et al. (2010) [17] | |
| H2 | 0.16±0.08 | 0.44±0.11 | 0.20±0.06 | 0.06±0.07 | 0.37±0.10 | IWK | ||
| H2 | 0.65±0.16 | 0.20±0.06 | 0.35±0.09 | 0.07±0.03 | IWN | Anees et al. (2010) [4] | ||
| H2 | - | 0.25±0.15 | 0.14±0.11 | 0.05±0.10 | 0.11±0.02 | IWH | Sreenivas et al. (2012) [33] | |
| H2 | - | 0.33±0.18 | 0.02±0.10 | 0.11±0.07 | 0.22±0.15 | IWI | ||
| H2 | - | 0.41±0.21 | 0.01±0.10 | 0.13±0.07 | 0.12±0.03 | IWK | ||
| H2 | - | 0.41±0.11 | 0.28±0.08 | 0.29±0.09 | 0.27±0.08 | IWN | Veeramani et al. (2012) [38] | |
| H2 | - | 0.45±0.12 | 0.32±0.09 | 0.26±0.07 | 0.48±0.13 | IWP | ||
| H2 | - | 0.31±0.12 | 0.48±0.13 | 0.54±0.14 | 0.19±0.09 | 0.39±0.12 | IWN strain | Qadari et al. (2013) [29] |
| H2 | 0.31±0.11 | 0.45±0.10 | 0.24±0.09 | 0.23±0.09 | 0.09±0.06 | 0.16±0.08 | IWP strain | |
| H2 | - | 0.32±0.08 | 0.21±0.07 | 0.18±0.06 | 0.09±0.05 | IWN strain | Savaliya et al. (2014) [30] | |
| H2 | - | 0.14±0.06 | 0.10±0.06 | 0.02±0.03 | 0.07±0.05 | IWP strain | ||
| H2 | 0.49±0.08 | 0.36±0.08 | 0.36±0.08 | 0.31±0.08 | 0.49±0.08 | 0.25±0.07 | WLH | Tomar et al. (2014) [36] |
| H2 | 0.45±0.13 | 0.42±0.12 | 0.28±0.08 | 0.43±0.12 | 0.32±0.11 | Synthetic WLH | Manjeet et al. (2018) [22] | |
| 0.42 | WLH | Rosa et al. (2018) [29] | ||||||
| H2 | 0.46±0.13 | 0.29±0.11 | 0.24±0.10 | IWN | Patil et al. (2018) [27] | |||
| H2 | 0.18±0.09 | 0.12±0.08 | 0.07±0.07 | IWP | ||||
| H2 | 0.39±0.05 | 0.35±0.05 | 0.28±0.05 | IWN | Churchil et al. (2019) [12] | |||
| H2 | 0.29±0.05 | 0.09±0.03 | 0.24±0.04 | IWP |
Table text extracted from the original PDF; superscript letters are shown inline. The original table image is below.
View original table image
| S/L/Generation | Genetic Correlation (rg) | Phenotypic Correlation (rp) | Author(s) |
|---|---|---|---|
| (BW20 * BW40) | |||
| IWK | 0.62±0.23 | 0.27 | Jayalaxmi et al. (2010) [17] |
| IWP | 0.96±0.07 | 0.48 | Qadari et al. (2013) [28] |
| White Leghorn | 0.76±0.01 | 0.77±0.01 | Tomar et al. (2014) [36] |
| (BW20 * AFE) | |||
| WLH | 0.10±0.12 | 0.01±0.01 | Godara et al. (2007) [16] |
| IWP Gen.S5 | 0.11±0.29 | -0.18±0.05 | Barot et al. (2008) [6] |
| S6 | -0.04±0.25 | -0.19±0.05 | |
| S7 | -0.12±0.26 | -0.15±0.05 | |
| S8 | 0.42±0.25 | 0.07±0.05 | |
| S9 | -0.54±0.27 | -0.26±0.05 | |
| IWK | -0.21±1.14 | - | Jayalaxmi et al. (2010) [17] |
| IWN | - | -0.01 | Qadari et al. (2013) [38] |
| IWP | 0.28±0.25 | 0.09 | |
| White Leghorn | -0.33±0.06 | -0.16±0.02 | Tomar et al. (2014) [36] |
| WLH | -0.46±0.17 | -0.31±.02 | Manjeet et al. (2018) [22] |
| (BW20 * EN) | |||
| WLH | 0.22±0.12 | 0.11±0.01 | Godara et al. (2007) [16] |
| Gen.S5 | -0.41±0.30 | 0.26±0.05 | Barot et al. (2008) [6] |
| S6 | 0.20±0.31 | 0.27±0.05 | |
| S7 | -0.24±0.24 | 0.11±0.05 | |
| S8 | -0.56±0.25 | -0.11±0.05 | |
| S9 | 0.14±0.24 | 0.22±0.05 | |
| IWH | -0.03±0.17 | - | Bais et al. (2008) [5] |
| IWI | 0.59±0.13 | - | |
| WLH | 0.51 | 0.02 | Yahaya et al. (2009) [40] |
| IWK | 0.10±0.60 | 0.18 | Jayalaxmi et al. (2010) [17] |
| IWP | -0.26±0.25 | 0.01 | Qadari et al. (2013) [28] |
| IWN | - | 0.07 | |
| White Leghorn | 0.07±0.07 | 0.09±0.02 | Tomar et al. (2014) [36] |
| (BW20 * EW) | |||
| Gen.S5 | 0.49±0.19 | 0.34±0.05 | Barot et al. (2008) [6] |
| S6 | 0.82±0.12 | 0.29±0.05 | |
| S7 | 0.44±0.19 | 0.27±0.05 | |
| S8 | 0.72±0.14 | 0.33±0.04 | |
| S9 | 0.26±0.27 | 0.07±0.05 | |
| WLH | 0.65±0.06 | 0.34±0.03 | Chaudhary et al. (2009) [11] |
| IWK | 0.19±0.29 | 0.16 | Jayalaxmi et al. (2010) [17] |
| IWN | - | 0.12 | Qadari et al. (2013) [28] |
| IWP | 0.02±0.35 | 0.13 | |
| White Leghorn | 0.38±0.06 | 0.18±0.02 | Tomar et al. (2014) [36] |
| WLH | 0.09±0.18 | 0.11±0.02 | Manjeet et al. (2018) [22] |
| (BW20 * EM) | |||
| IWN | - | 0.11 | Qadari et al. (2013) [28] |
| IWP | -0.26±0.28 | 0.01 | |
| WLH | 0.16±0.07 | 0.16±0.02 | Tomar et al. (2014) [36] |
| WLH | 0.01±0.19 | 0.08±.02 | Manjeet et al. (2018) [22] |
| (BW40 * AFE) | |||
| Gen.S5 | 0.50±0.23 | 0.17±0.05 | Barot et al. (2008) [6] |
| S6 | 0.59±0.18 | 0.27±0.05 | |
| S7 | 0.04±0.27 | 0.23±0.05 | |
| S8 | 0.39±0.24 | 0.15±0.05 | |
| S9 | 0.28±0.25 | 0.10±0.05 | |
| WLH | 0.10±0.19 | 0.03±0.02 | Veeramani et al. (2008) [38] |
| IWK | -0.23±0.84 | 0.03 | Jayalaxmi et al. (2010) [17] |
| IWN | -0.04±0.02 | 0.14±0.19 | Anees et al. (2010) [4] |
| IWI | 0.54±0.27 | 0.07 | Sreenivas et al. (2012) [33] |
| IWK | 0.33±0.16 | 0.00 | |
| IWN | 0.34±0.10 | 0.12±0.02 | Veeramani et al. (2012) [38] |
| IWP | 0.09±0.13 | 0.03±0.02 | |
| IWN | -0.15±0.22 | 0.09 | Qadari et al. (2013) [28] |
| IWP | 0.49±0.20 | 0.21 | |
| IWN | 0.48±0.18 | 0.09 | Savaliya et al. (2014) [30] |
Table text extracted from the original PDF; superscript letters are shown inline. The original table image is below.
View original table image
References
32 in the original paper- Anonyms. 5th International Poultry and Livestock Expo [Internet]. c2020 [cited 2024 Jun 15]. Available from: https://ippexpo.org.
- Ahmad M, Singh PK. Estimates of genetic parameters for some economic traits in White Leghorn. Indian J Poult Sci. 2007;42(3):311-312.
- Anees C, Veeramani P, Narayanankutty K, Ani B, Riyas MA. Estimation of genetic and phenotypic parameters of economic traits in White Leghorn. Indian J Poult Sci. 2010;45(1):14-17.
- Bais RKS, Katariya MC, Sharma D, Hazary RC, Sharma RD. Performance and heterosis for production traits of White Leghorn under family index selection. Indian J Poult Sci. 2008;43(3):283-288.
- Barot VN, Savaliya FP, Hirani ND, Paleja HI, Khanna K, Vataliya PH, et al. Evaluation of production performance of some economic traits in a synthetic White Leghorn population. Indian J Poult Sci. 2008;43(1):97-98.
- Barot VN, Savaliya FP, Hirani ND, Patel AB, Vataliya PH, Khanna K, et al. Genetic parameters of various economic traits in different generations of synthetic White Leghorn. Indian J Poult Sci. 2008;43(1):20-24.
- Basic Animal Husbandry and Fisheries Statistics. Ministry of Agriculture Department of Animal Husbandry, Dairying & Fisheries. Krishi Bhawan, Government of India, New Delhi; 2022-23. Available from: https://dahd.nic.in/circulars/basic-animalhusbandry-statistics.
- Chatterjee RN, Bhattacharya TK. Breeding layersrecent trends, problems and strategies to overcome. In: Poultry Production in India: and Opportunities. Proceedings of IPSACON-2008; c2008. p. 29-34.
- Chaudhary ML, Brah-Khurana GS, Samrat. Inheritance of body weight and body weight ratio and their relationship with economic traits in White Leghorn chicken. Indian J Poult Sci. 2009;44(2):167-171.
- Churchil RR, Lijo J, Binoj CP, Ezhil P, Anitha P. Genetic Analysis of Egg Production and Allied Characters in Two Long Term Selected Strains of White Leghorn. Int J Curr Microbiol Appl Sci. 2019;8(3):1669-1678.
- FAO. FAOSTAT [Internet]; c2022 [cited 2024 Jun 15]. Available from: https://www.fao.org/faostat/en/#home.
- Godara A, Singh RP, Malik BS, Khanna AS. Phenotypic and genetic trends of performance traits of egg type chickens. Indian J Poult Sci. 2007;42(1):6972.
- Jayalaxmi P, Gupta B, Ramesh, Chatterjee RN, Sharma RP, Reddy VR. Genetic analysis of growth and production traits in IWK strain of White Leghorn. Indian J Poult Sci. 2010;45(2):123-126.
- Karuppasamy K, Bhanja SK, Mehra M, Aswathi PB, Nayak N, Goel A. Evaluation of economic traits of White Leghorn layers under normal and controlled heat stress conditions. Indian J Poult Sci. 2018;53(1):21-27.
- Laxmi PJ, Gupta BR, Chatterjee RN, Sharma RP, Reddy VR. Genetic analysis of growth and production www.extensionjournal.com traits in IWK strain of White Leghorn. Indian J Poult Sci. 2010;45(2):123-126.
- Manjeet, Dalal DS, Dhaiya SP, Patil CS. Genetic parameters of various performance traits in different generations of synthetic white leghorn strain. Int J Adv Biol Res. 2018;8(4):438-440.
- Niranjan S, Singh H, Krishna ST. Construction and evaluation of multi-trait selection indices for overall economic improvement in white leghorn layers. Indian J Anim Sci. 1994;64(10):1075-1077.
- Paleja HI, Savaliya F, Patel AB, Khanna K, Vataliya PH, Solanki JV. Genetic parameters in White Leghorn (IWN Line) chicken. Indian J Poult Sci. 2008;43(2):151-154.
- Patil SD, Savaliya FP, Patel AB, Paleja HI, Joshi RS, Hirani ND, et al. Genetic studies on egg production traits in IWN and IWP strains of White Leghorn chicken. Indian J Poult Sci. 2018;53(3):247-250.
- Qadari FS, Savaliya FP, Patel AB, Joshi RS, Hiran ND, Patil SS. Genetic study on important economic traits in two strains of White Leghorn chicken. Indian J Poult Sci. 2013;48(2):149-153.
- Rosa JO, Venturini GC, Chud TCS, Pires BC, Buzanskas ME, Stafuzza NB, et al. Bayesian inference of genetic parameters for reproductive and performance traits in White Leghorn hens. Czech J Anim Sci. 2018;63(6):230-236.
- Savaliya FP, Patel AB, Mishra RK, Joshi RS, Hirani ND. Inheritance and association among various economic traits of two strains of White Leghorn. Indian J Poult Sci. 2014;49(2):147-151.
- Saxena VK, Kolluri G. Selection Methods in Poultry Breeding: From Genetics to Genomics. Application of Genetics and Genomics in Poultry Science. 2018:19.
- Sharma RP, Chatterjee RN. Research priorities in poultry genetics and breeding to 2020. In: Proceedings of National Seminar, Central Avian Research Institute, Izatnagar; 2006:2-3.
- Sreenivas D, Prakash M, Gnaana P, Chatterjee RN, Mahender M. Genetic analysis of productive and reproductive traits in White Leghorn chicken. Indian J Poult Sci. 2012;43(3):274-280.
- Thangaraju P, Ulaganathan V. Heritability associated with characters affecting production in two White Leghorn strains. Indian J Anim Sci. 1990;62(2):231232.
- Thiruvenkadan AK, Panneerselvam S, Prabakaran R. Layer breeding strategies: an overview. World's Poult Sci J. 2010;66(3):477-502.
- Tomar AK, Poonia JS, Chaudhari M, Kumar P, Rani M. Genetic and phenotypic parameters in egg type chicken. Indian J Poult Sci. 2014;49(3):317-320.
- Tomar AK, Poonia JS, Chaudhary M, Kumar P. Evaluation of production performance of some economic traits in white leghorn birds. Haryana Veterinarian. 2015;54(1):19-21.
- Veeramani P, Churchil RR, Kutty KN. Estimates of heritability and correlations of economic traits in two strains of White Leghorn. Int J Vet Sci. 2012;1(2):4548.
- Veeramani P, Narayanankutty K, Richard R. Estimation of heritability and correlation of economic traits in IWP strain of white leghorn chicken. Indian J Anim Res. 2008;42(4):257-260.
- Yahaya HK, Oni OO, Akpa GN, Adeyinka IA. Estimation of genetic parameters of various economic traits in a closed population of female line layer type chickens under short term selection. Emirates J Food Agric. 2009;21(1):59-64.