
Research article · 2024 · Full text
International Journal of Research in AgronomyTechno-economic feasibility of different storage modes for wheat and maize
Volume 7(6) · Pages 308–312 · DOI: 10.33545/2618060x.2024.v7.i6e.850 ↗
Research areasAgricultural Economics and PracticesCrop Yield and Soil FertilityAgricultural Science and Fertilization
Abstract
Author-writtenThis research was conducted to evaluation of Techno-economic feasibility of different Storage modes for Wheat and Maize. Techno-economic feasibility of different storage methods for wheat and maize was analyzed: 40 kg of samples were taken in different modes and stored for 12 months in all 15 untreated and treated storages. The maximum profit in wheat for T1, T2 and T3 were found as Rs. 254.0, 219.0 and 99.0 respectively. Whereas maize grain storage net profit was found Rs. 134.0, 99.0 & 19.0 in T1, T2 & T3 respectively. The result revealed that the use of Hermetic bag with jute bag, Hermetic bag with plastic bag and Metal bin with hermetic bags were the best and suitable for storage of wheat and maize grains up to twelve months. Farmers need to be trained while storing wheat and maize to get maximum profit from grain storage. As a result, adoption rates will rise if hermetic bag prices are decreased through increased knowledge and increased supply chain effectiveness.
Summary
Source-checkedPlain-language reading of the full paper, prepared with AI and checked against the text. Each point links to the authors' own words.
Why it matters
- Maize, wheat, and rice are the three most significant cereal crops globally, with maize being the most widely cultivated. View evidence ↗
- Effective grain storage is critical because it reduces post-harvest losses and increases income for farmers. View evidence ↗
- Current traditional storage practices often lead to price instability between seasons, negatively impacting both consumers and farmers. View evidence ↗
The question
- The study aimed to evaluate the techno-economic feasibility of various storage methods for wheat and maize grains. View evidence ↗
What they did
- The research was conducted in the Samastipur district of Bihar, India. View evidence ↗
- The experiment used 40 kg samples stored for 12 months across 15 different treated and untreated storage modes. View evidence ↗
- The 15 treatments tested included three untreated modes, six treated with Neem leaves, and six treated with chemicals, using materials like jute, plastic, hermetic bags, polythene, and metal bins. View evidence ↗
- Economic feasibility was measured using the Net Rate of Return (Gross Return minus Gross Cost) and the Benefit-Cost Ratio. View evidence ↗
What they found
- For wheat, the highest profits were achieved in treatments T1 (Rs. 254.0), T2 (Rs. 219.0), and T3 (Rs. 99.0). View evidence ↗
- For maize, the highest net profits were found in T1 (Rs. 134.0), T2 (Rs. 99.0), and T3 (Rs. 19.0). View evidence ↗
- Maize storage losses occurred in several treated modes, including plastic bag T13 (Rs -3), jute bag T11 (Rs -16), metal bin T14 (Rs 66), and metal bin T15 (Rs 91). View evidence ↗
What it means
- The authors conclude that training for farmers is necessary to maximize profits from grain storage. View evidence ↗
- The authors suggest that increasing supply chain effectiveness and reducing the price of hermetic bags would increase their adoption rate. View evidence ↗
- The authors state that further research is needed to understand the impact of hermetic bags on human health and the environment. View evidence ↗
Visual summary
3 visualsIllustrations explain the paper; charts are replotted from the paper's own table values.
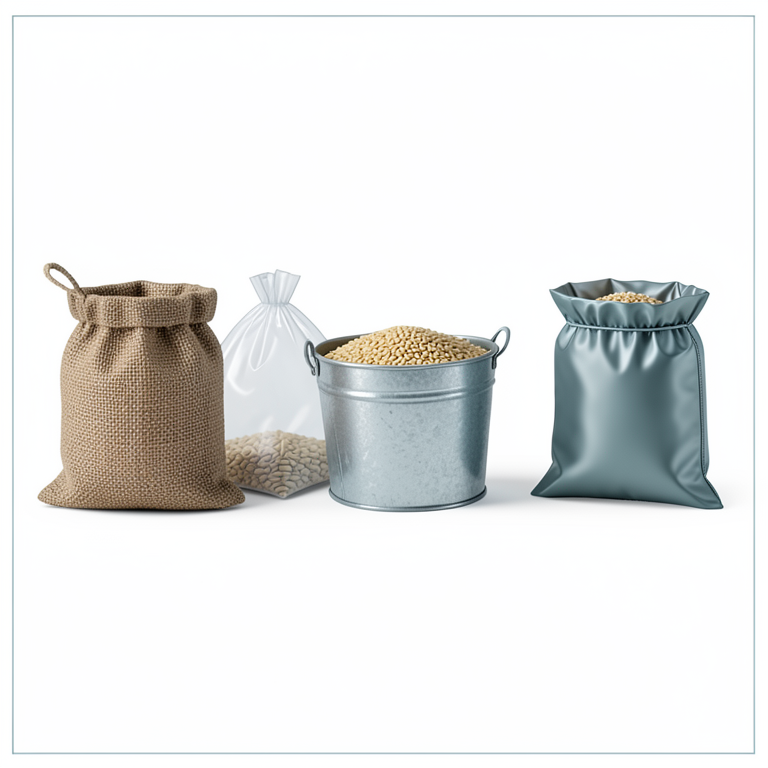
Comparison of Storage Modes
AI-generated conceptual illustration (wheat and maize grains in various storage containers). It explains the idea and does not show study data.
View source evidence ↗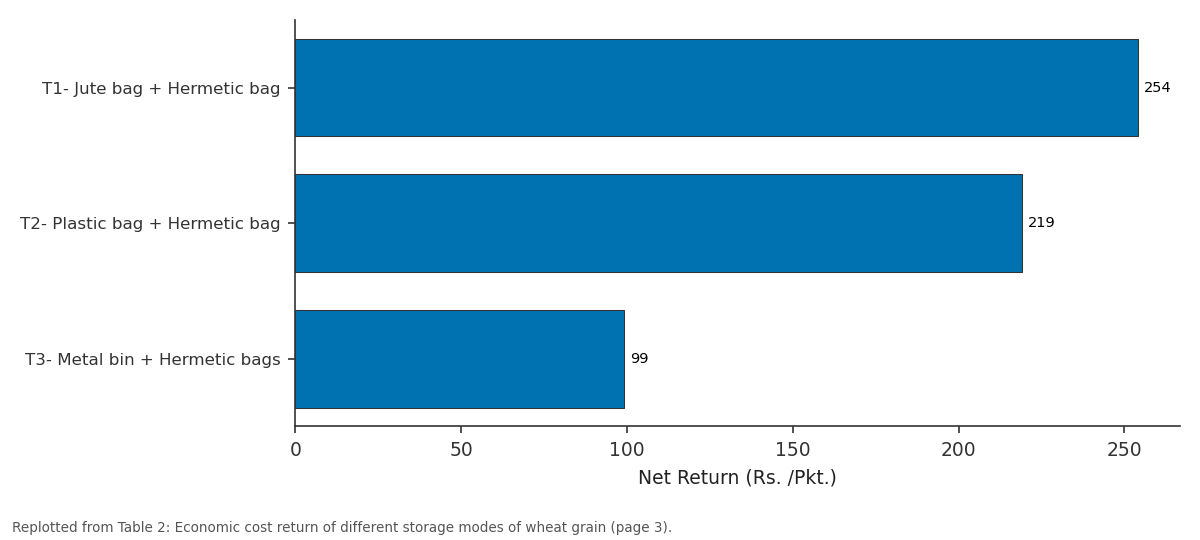
Net Return (Rs. /Pkt.): T1- Jute bag + Hermetic... vs T2- Plastic bag +... vs T3- Metal bin +...
Replotted from Table 2 (page 3) of the original paper. Every bar is the paper's own table value.
View source evidence ↗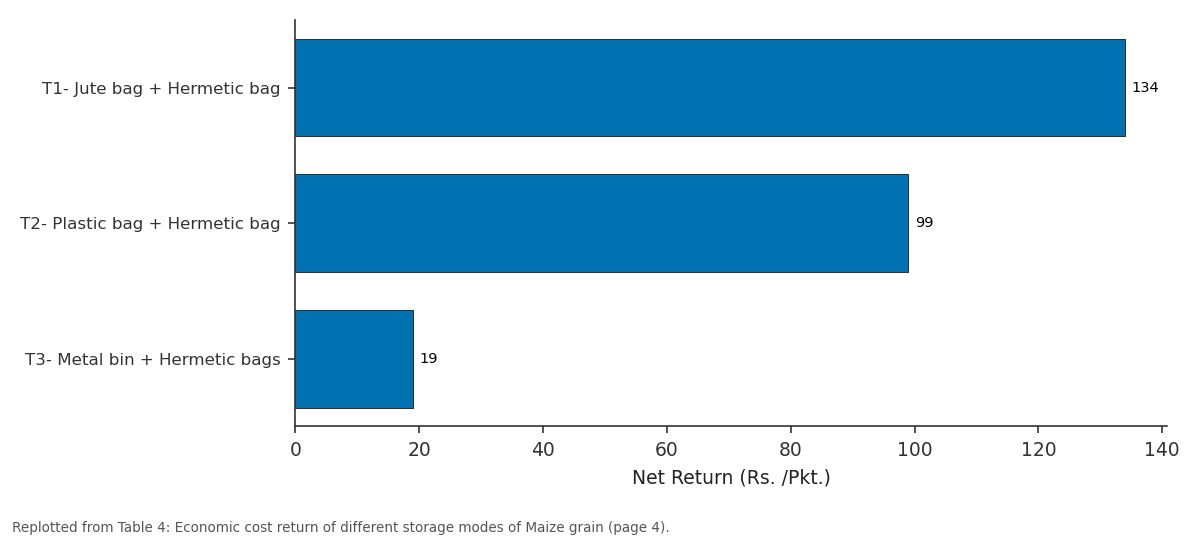
Net Return (Rs. /Pkt.): T1- Jute bag + Hermetic... vs T2- Plastic bag +... vs T3- Metal bin +...
Replotted from Table 4 (page 4) of the original paper. Every bar is the paper's own table value.
View source evidence ↗Figures & tables
From the original paper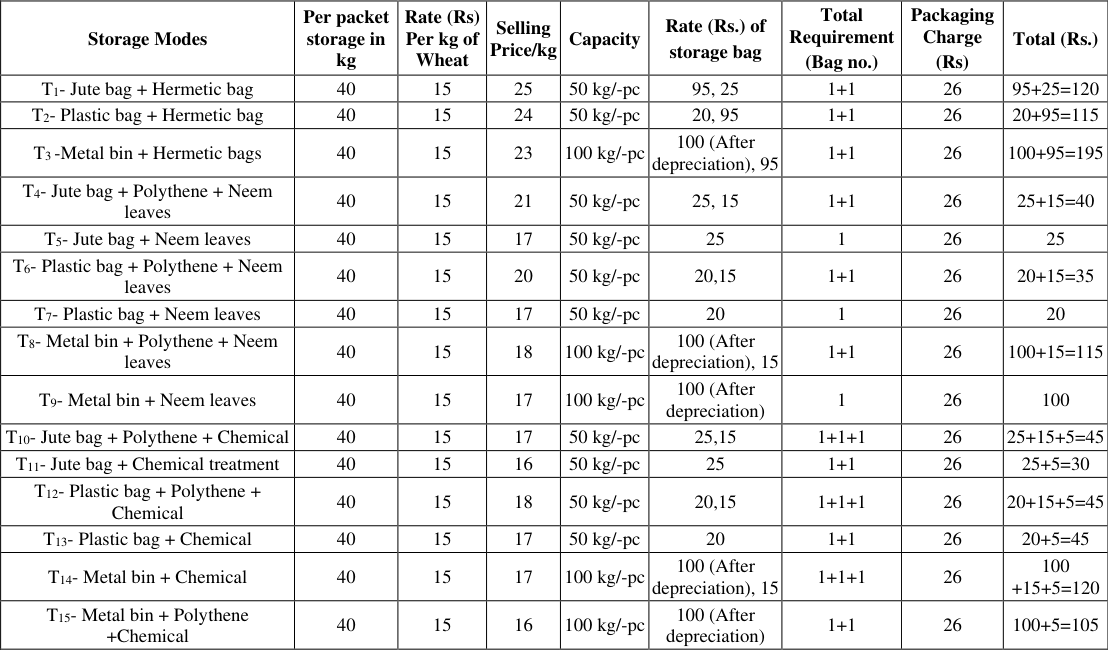 Table 1
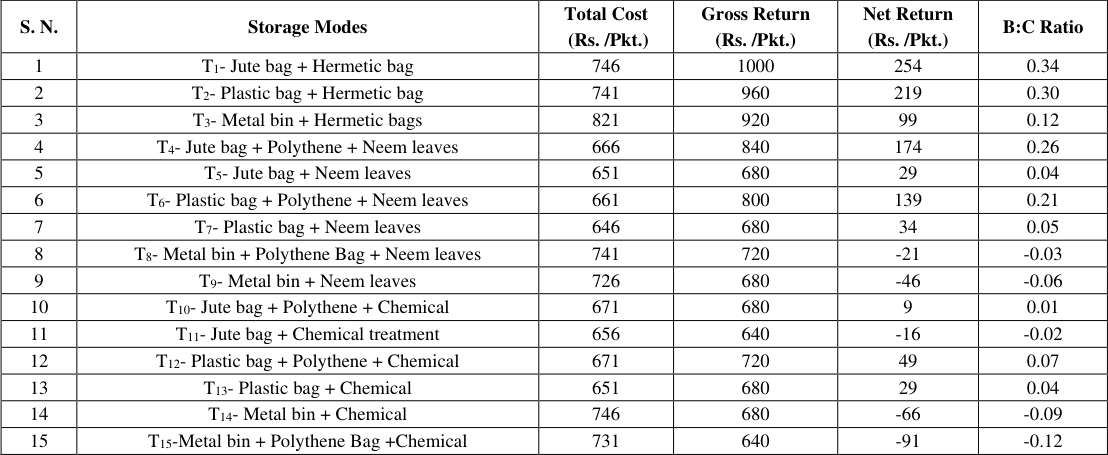 Table 2
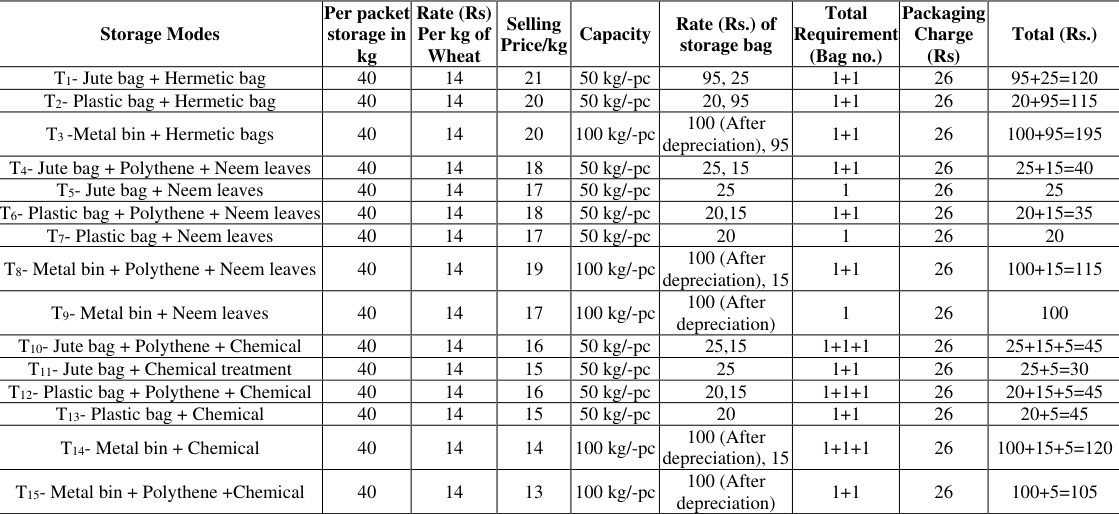 Table 3
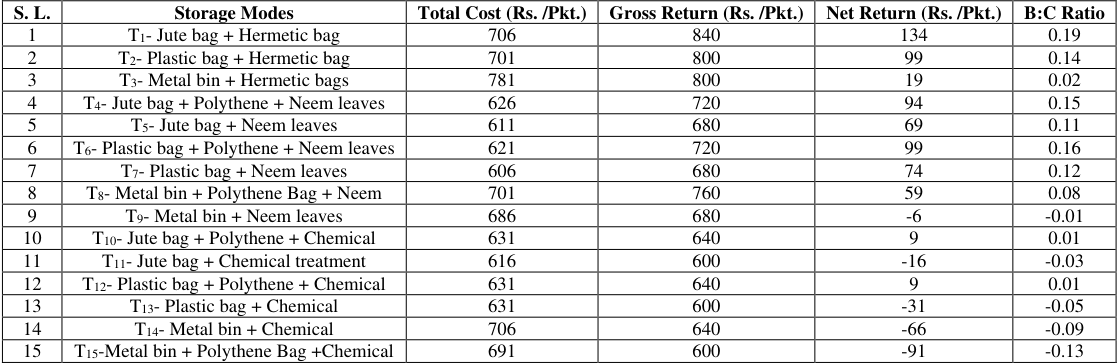 Table 4
Introduction
The maize crop is the most widely cultivated cereal crop worldwide, together with wheat and rice are the three most important cereal crops in the world. Over 800 million metric tons were produced in 2012/13. Maize production is expected to double by 2025 (M'mboyi et al., 2010) [12] . Maize is produced on a seasonal basis; usually once per year (FAO/GIEWS, 2014) [10] , but consumption is evenly spaced throughout the year (Benirschka and Binkley, 1995) [5] . Thus, to maintain a constant supply throughout the year, maize should be properly stored. Grain storage plays a significant role to ensure a constant supply, and in stabilizing the food supply at the household level by smoothing seasonal food production. In addition, proper storage helps to minimize post-harvest losses of maize acts as guarantor for inflation-proof saving banks, and improves agricultural income (Tefera et al., 2011) [19] . For the government, maize grain is stored as a food security reserve, a price stabilization stock, a national storage reserve or strategic reserve, buffer stocks, and production controls (Proctor, 1994) [15] . There are two main costs associated with wheat and maize storage: fixed and variable costs. Fixed costs are incurred regardless of whether the grain is stored in the storage facilities or not, whereas variable costs are those that increase or decrease, and are incurred only when maize is stored (Edwards and Johanns, 2015) [8] . The expense of new technical innovations, such as complex storage facilities, silos, warehouses, and pricey fungicide and insecticide treatment, must also be looked into. Structures that efficiently protect crop quality and yield could be too costly and complex for the target farmers' level of operation (Agboola, 2001) [3] . The issues brought on by rodents and insects are more noticeable than the issues brought on by fungus. If the country seeks to achieve food security, storage losses pose a serious issue. The market is prone to significant short-term and inter-seasonal price variations with the current indigenous storage practises, which affects the interests of both farmers and consumers. Successful farm storage enables farmer to sell maize when prices are favourable (off season). Traditional storage methods are relatively localised and primitive; some have been discovered to work and just require minor changes, while others are unsafe and out-of-date (Thamaga-Chitja et al., 2004) [18] .
Techno-economic feasibility characteristics of wheat and maize analyzed the economics associated with the off-farm storage farmers. Others include computing the profitability of various storage techniques as well as identifying challenges associated with the existing storage techniques used in the study area. There were two hypotheses of the study. The first one stated that there is no significant relationship between the socio-economic characteristics of respondents and storage decisions. The second one stated that there is no significant relationship between the cost of storage and revenue generated by the farmers. The main objective of conducting this research was to evaluation of Techno-economic feasibility of different Storage modes for Wheat and Maize.
Materials and Methods
Materials and Methods
Economic Cost
The study site of Techno-economic feasibility of wheat and maize was selected to Samastipur district, Bihar. The cost of storage grains was incurred by two significant groups. The first category includes costs for staff, space, and equipment. Cost of storage facilities, which included the price of metal bins, plastic bags, jute bags, hermetic bags and Metal bins. The second group was storage cost. Input on equipment cost was collected from several manufacturers and varied in size. According to estimates, the cost of installing and building a concrete floor was. Benefit-Cost Ratio was calculated by using equation (1 and 2)
Net Rate of Return= (Gross Return-Gross Cost)
Net Profit Benefit-Cost Ratio =
(2) Gross Cost Where Net Profit = Gross Income -Gross Cost (Including the imparted value of labour) Gross Cost= Fix cost + Variable cost
The main expense for grain storage, on the other hand, is made up of variable costs, which include expenses that can only be incurred if grain is stored (Brennan and Lindner, 1991) [6] . Variable Costs fluctuate and are influenced by the quantity of stored grain as well as how long the items are stored (Pardey et al., 2001; Dhuyvetter et al., 2007) [14,7] . These may involve expenses. Including labour, administration, and shipping into and out of storing, using pesticides, and the price of energy (such as liquid for example, grain drying using propane and electricity.
Results and Discussion
Results and Discussion
Techno-Economic Feasibility of different grain Storage modes
The economic cost findings are compiled and presented in Table 1 and2. The findings showed that wheat grain storage at a 40 kg storage capacity per storage mode increased the environmental impact. The price of storing treated and untreated includes a broad range of storage options, such as jute bags, plastic bags, hermetic bags, polythene bags, and metal bins, as well as 15 treatments available, including three untreated, six treated (Neem leaves), and six treated (chemical). In the cost calculation of packing, labour was employed as the primary parameter.
| Storage Modes | Per packet storage in kg | Rate (Rs) Per kg of Wheat | Selling Price/kg | Capacity | Rate (Rs.) of storage bag | Total Requirement (Bag no.) | Packaging Charge (Rs) | Total (Rs.) |
|---|---|---|---|---|---|---|---|---|
| T1- Jute bag + Hermetic bag | 40 | 15 | 25 | 50 kg/-pc | 95, 25 | 1+1 | 26 | 95+25=120 |
| T2- Plastic bag + Hermetic bag | 40 | 15 | 24 | 50 kg/-pc | 20, 95 | 1+1 | 26 | 20+95=115 |
| T3 -Metal bin + Hermetic bags | 40 | 15 | 23 | 100 kg/-pc | 100 (After depreciation), 95 | 1+1 | 26 | 100+95=195 |
| T4- Jute bag + Polythene + Neem leaves | 40 | 15 | 21 | 50 kg/-pc | 25, 15 | 1+1 | 26 | 25+15=40 |
| T5- Jute bag + Neem leaves | 40 | 15 | 17 | 50 kg/-pc | 25 | 1 | 26 | 25 |
| T6- Plastic bag + Polythene + Neem leaves | 40 | 15 | 20 | 50 kg/-pc | 20,15 | 1+1 | 26 | 20+15=35 |
| T7- Plastic bag + Neem leaves | 40 | 15 | 17 | 50 kg/-pc | 20 | 1 | 26 | 20 |
| T8- Metal bin + Polythene + Neem leaves | 40 | 15 | 18 | 100 kg/-pc | 100 (After depreciation), 15 | 1+1 | 26 | 100+15=115 |
| T9- Metal bin + Neem leaves | 40 | 15 | 17 | 100 kg/-pc | 100 (After depreciation) | 1 | 26 | 100 |
| T10- Jute bag + Polythene + Chemical | 40 | 15 | 17 | 50 kg/-pc | 25,15 | 1+1+1 | 26 | 25+15+5=45 |
| T11- Jute bag + Chemical treatment | 40 | 15 | 16 | 50 kg/-pc | 25 | 1+1 | 26 | 25+5=30 |
| T12- Plastic bag + Polythene + Chemical | 40 | 15 | 18 | 50 kg/-pc | 20,15 | 1+1+1 | 26 | 20+15+5=45 |
| T13- Plastic bag + Chemical | 40 | 15 | 17 | 50 kg/-pc | 20 | 1+1 | 26 | 20+5=45 |
| T14- Metal bin + Chemical | 40 | 15 | 17 | 100 kg/-pc | 100 (After depreciation), 15 | 1+1+1 | 26 | 100 +15+5=120 |
| T15- Metal bin + Polythene +Chemical | 40 | 15 | 16 | 100 kg/-pc | 100 (After depreciation) | 1+1 | 26 | 100+5=105 |
Table text extracted from the original PDF; superscript letters are shown inline. The original table image is below.
View original table image
Economic feasibility of Wheat grain
Cost estimation was done for Untreated and treated wheat grain of different storage modes. The total economic cost for untreated wheat of storing 40 kg of was 746 in T 1 , 741 in T 2 and 821 in T 3 and the return was 254, 219 and 99, respectively. Wheat Grain Storage Jute Bags with Polythene T 4 , Plastic Bags with Polythene T 6 , Jute Bags T 12 , Plastic Bags T 7 , Metal Bin T 5 , and the net return was found to be Rs. 174, Rs. 139, Rs. 46, Rs. 34 and 29 respectively. Loss was noticed in metal bin T8 (Rs. -21) and metal bin T 9 (Rs. -46) with two treated storage modes polythene bags. Net profit of in Plastic bag with Polythene T 12 (Rs 49) in Plastic bag T 13 (Rs 29) and Jute bag with Polythene T 8 (Rs 9) was found in three treatments in possible storage mode. Loss of in Jute Bag T 11 (Rs -16) in Metal Bin T 14 (Rs-66) and Metal bin Polythene bag T 15 (Rs-91) was found in three treatments in possible storage mode. Net profit of all 15 treatments was found to be the best Jute bag with hermetic bag and the best of Plastic bag with hermetic bag.
Assumption
Grain per bag = 40 kg Labour = 390/day (Institute approved wages as per year 2022)
Economic cost of Maize grain
The total economic cost of untreated storing 40 kg of maize grain was 706 in T 1 , 701 in T 2 and 781 in T 3 and the return was 134, 99 and 19, respectively. Untreated and treated different storage mode of maize grain economic cost is shown in Table 3 and 4. Net profit of maize grain storage decreasing order Plastic bag with Polythene T 6 , Jute bag with Polythene T 4 , Plastic bag T 7 , Metal bin T 5 , and Jute bag with Polythene T 8 , and net return is Rs. 99, Rs 94, Rs,74, Rs. 69, and Rs. 59, respectively. The loss was found in one treatment Metal bin T 9 in (Rs. -6). Net profit of the same (Rs 9) in jute bags with polythene T 10 and plastic bags with polythene T 12 was found in the treatment of two storage modes. Loss of (Rs -3) in plastic bag T 13 , (Rs -16) in jute bag T 11 , in metal bin T 14 (Rs 66) and in metal bin T 15 (Rs 91) were found in four treated storages. The net benefit of all the 15 treatments was found to be the best in storage of 0 -12 months in hermetic bag with jute bag and hermetic bag with plastic bag, which is suitable for storage. Similar result of our analysis, reported by Shepherd, (1999) [17] , the opportunity cost for each storage method and gross margin (GM) was viewed as the variation in the market price (price) of wheat and maize grain at the time of sale. The selling price includes the calculations. Each storage technology involved different costs. evaluated the storage technique's net gains. In addition, the results of the partial budget analysis indicated that wheat or maize growers may switch to any type of storage method other than Traditional Storage with Pesticide (TSP) even though it had a negative Gross Margin (GM) in every scenario. PICS modifications made the biggest (beneficial) difference. Furthermore, the partial budget results are comparable with the MRR ratio, which was 3.196 when the storage method changed from No storage or sold immediately after harvest (NS) to (PICS). The partial budget and MRR findings are in line with the majority of research findings from other SSA areas, most of which demonstrate that hermetic bags have the greatest GM and MRR ratios Adetunji, M. (2009a) [1] ; Sekumade and Oluwatayo, (2009) [16] ; Jones et al., (2011) [11] . Additionally, TSP is not commercially viable, as evidenced by the high TVC ratio of TSP to NS (4.5:1) and PICS (3.1:1). PICS, which was considered the most profitable option in this assessment, PICS provided the best GM. Qualitative and quantitative findings of studies that demonstrate the profitability of PICS bags in SSA, reported by Baributsa et al., (2014) [4] , FAO, (2018) [9] .
| Storage Modes | Per packet storage in kg | Rate (Rs) Per kg of Wheat | Selling Price/kg | Capacity | Rate (Rs.) of storage bag | Total Requirement (Bag no.) | Packaging Charge (Rs) | Total (Rs.) |
|---|---|---|---|---|---|---|---|---|
| T1- Jute bag + Hermetic bag | 40 | 14 | 21 | 50 kg/-pc | 95, 25 | 1+1 | 26 | 95+25=120 |
| T2- Plastic bag + Hermetic bag | 40 | 14 | 20 | 50 kg/-pc | 20, 95 | 1+1 | 26 | 20+95=115 |
| T3 -Metal bin + Hermetic bags | 40 | 14 | 20 | 100 kg/-pc | 100 (After depreciation), 95 | 1+1 | 26 | 100+95=195 |
| T4- Jute bag + Polythene + Neem leaves | 40 | 14 | 18 | 50 kg/-pc | 25, 15 | 1+1 | 26 | 25+15=40 |
| T5- Jute bag + Neem leaves | 40 | 14 | 17 | 50 kg/-pc | 25 | 1 | 26 | 25 |
| T6- Plastic bag + Polythene + Neem leaves | 40 | 14 | 18 | 50 kg/-pc | 20,15 | 1+1 | 26 | 20+15=35 |
| T7- Plastic bag + Neem leaves | 40 | 14 | 17 | 50 kg/-pc | 20 | 1 | 26 | 20 |
| T8- Metal bin + Polythene + Neem leaves | 40 | 14 | 19 | 100 kg/-pc | 100 (After depreciation), 15 | 1+1 | 26 | 100+15=115 |
| T9- Metal bin + Neem leaves | 40 | 14 | 17 | 100 kg/-pc | 100 (After depreciation) | 1 | 26 | 100 |
| T10- Jute bag + Polythene + Chemical | 40 | 14 | 16 | 50 kg/-pc | 25,15 | 1+1+1 | 26 | 25+15+5=45 |
| T11- Jute bag + Chemical treatment | 40 | 14 | 15 | 50 kg/-pc | 25 | 1+1 | 26 | 25+5=30 |
| T12- Plastic bag + Polythene + Chemical | 40 | 14 | 16 | 50 kg/-pc | 20,15 | 1+1+1 | 26 | 20+15+5=45 |
| T13- Plastic bag + Chemical | 40 | 14 | 15 | 50 kg/-pc | 20 | 1+1 | 26 | 20+5=45 |
| T14- Metal bin + Chemical | 40 | 14 | 14 | 100 kg/-pc | 100 (After depreciation), 15 | 1+1+1 | 26 | 100+15+5=120 |
| T15- Metal bin + Polythene +Chemical | 40 | 14 | 13 | 100 kg/-pc | 100 (After depreciation) | 1+1 | 26 | 100+5=105 |
Table text extracted from the original PDF; superscript letters are shown inline. The original table image is below.
View original table image
Conclusion
Present study reveals wheat and maize grain were untreated and treated stored under all the fifteen treatments of storage modes. Economical costs and benefits related to different storage methods, both untreated and treated, were observed after 12 months. In which the maximum benefit in untreated wheat grain storage was found in Jute Bag with Hermetic Bag -T 1 Rs.254 more than all untreated and treated. Whereas in comparison to all untreated and treated storage methods, maximum benefit was found in maize in jute bags with hermetic bag-T 1 of Rs.134. Moreover, additional study is required to determine the advantages of utilising hermetic bags for both human health and the environment.
Acknowledgement
AcknowledgementI am also grateful to the scientist and staff of the BISA, Pusa (Samastipur) for providing the basic facility for conducting my research. Study leave with pay granted Dr. RPCAU, Pusa, Samastipur greatest acknowledge
Figures and tables from the paper
| S. N. | Storage Modes | Total Cost (Rs. /Pkt.) | Gross Return (Rs. /Pkt.) | Net Return (Rs. /Pkt.) | B:C Ratio |
|---|---|---|---|---|---|
| 1 | T1- Jute bag + Hermetic bag | 746 | 1000 | 254 | 0.34 |
| 2 | T2- Plastic bag + Hermetic bag | 741 | 960 | 219 | 0.30 |
| 3 | T3- Metal bin + Hermetic bags | 821 | 920 | 99 | 0.12 |
| 4 | T4- Jute bag + Polythene + Neem leaves | 666 | 840 | 174 | 0.26 |
| 5 | T5- Jute bag + Neem leaves | 651 | 680 | 29 | 0.04 |
| 6 | T6- Plastic bag + Polythene + Neem leaves | 661 | 800 | 139 | 0.21 |
| 7 | T7- Plastic bag + Neem leaves | 646 | 680 | 34 | 0.05 |
| 8 | T8- Metal bin + Polythene Bag + Neem leaves | 741 | 720 | -21 | -0.03 |
| 9 | T9- Metal bin + Neem leaves | 726 | 680 | -46 | -0.06 |
| 10 | T10- Jute bag + Polythene + Chemical | 671 | 680 | 9 | 0.01 |
| 11 | T11- Jute bag + Chemical treatment | 656 | 640 | -16 | -0.02 |
| 12 | T12- Plastic bag + Polythene + Chemical | 671 | 720 | 49 | 0.07 |
| 13 | T13- Plastic bag + Chemical | 651 | 680 | 29 | 0.04 |
| 14 | T14- Metal bin + Chemical | 746 | 680 | -66 | -0.09 |
| 15 | T15-Metal bin + Polythene Bag +Chemical | 731 | 640 | -91 | -0.12 |
Table text extracted from the original PDF; superscript letters are shown inline. The original table image is below.
View original table image
| S. L. | Storage Modes | Total Cost (Rs. /Pkt.) | Gross Return (Rs. /Pkt.) | Net Return (Rs. /Pkt.) | B:C Ratio |
|---|---|---|---|---|---|
| 1 | T1- Jute bag + Hermetic bag | 706 | 840 | 134 | 0.19 |
| 2 | T2- Plastic bag + Hermetic bag | 701 | 800 | 99 | 0.14 |
| 3 | T3- Metal bin + Hermetic bags | 781 | 800 | 19 | 0.02 |
| 4 | T4- Jute bag + Polythene + Neem leaves | 626 | 720 | 94 | 0.15 |
| 5 | T5- Jute bag + Neem leaves | 611 | 680 | 69 | 0.11 |
| 6 | T6- Plastic bag + Polythene + Neem leaves | 621 | 720 | 99 | 0.16 |
| 7 | T7- Plastic bag + Neem leaves | 606 | 680 | 74 | 0.12 |
| 8 | T8- Metal bin + Polythene Bag + Neem | 701 | 760 | 59 | 0.08 |
| 9 | T9- Metal bin + Neem leaves | 686 | 680 | -6 | -0.01 |
| 10 | T10- Jute bag + Polythene + Chemical | 631 | 640 | 9 | 0.01 |
| 11 | T11- Jute bag + Chemical treatment | 616 | 600 | -16 | -0.03 |
| 12 | T12- Plastic bag + Polythene + Chemical | 631 | 640 | 9 | 0.01 |
| 13 | T13- Plastic bag + Chemical | 631 | 600 | -31 | -0.05 |
| 14 | T14- Metal bin + Chemical | 706 | 640 | -66 | -0.09 |
| 15 | T15-Metal bin + Polythene Bag +Chemical | 691 | 600 | -91 | -0.13 |
Table text extracted from the original PDF; superscript letters are shown inline. The original table image is below.
View original table image
References
17 in the original paper- Agboola SD. Current Status of the Controlled Atmosphere Storage in Nigeria. Journal of Food Technology in Africa. 2001;6(1):30-36.
- Baributsa D, Abdoulaye T, Lowenberg-J, DeBoer C, Dabiré B, Moussa O, et al. Market building for post-harvest technology through large-scale extension efforts J. Stored Prod. Res. 2014;58:59-66.
- Benirschka M, Binkley JK. Optimal storage and marketing over space and time. American Journal of Agricultural Economics. 1995;77(3):512-52.
- Brennan DC, Lindner RK. Investing In Grain Storage Facilities Under Fluctuating Production," Australian Journal of Agricultural and Resource Economics, Australian Agricultural and Resource Economics Society. 1991;35(2):159-178.
- Dhuyvetter KC, Harner JP, Tajchman J, Kastens TL. The Economics of On-Farm Storage. Kansas State University Agricultural Experiment Station and Cooperative Extension Service, 2007. Available at: www.oznet.ksu.edu. Accessed 24 May 2019.
- Edwards W, Johanns A. Grain Storage Alternatives: An Economic Comparison File A2-35, 2015. Available at: https://www.extension.iastate.edu/agdm/crops/pdf/a235.pdf.
- FAO. Food Loss Analysis: Causes and Solutions. Case Study on the Maize Value Chain in the Federal Democratic Republic of Ethiopia, 2018, p. 1-46.
- FAO/GIEWS. Global information and early warning system on food and Agriculture. GIEWS Country Brief-United Republic of Tanzania, 2014. Available at: http://www.fao.org/giews/ country brief/country.jsp?code=TZA.
- Jones M, Alexander CE, Lowenberg J. DeBoer Profitability of Hermetic Purdue Improved Crop Storage (PICS) Bags for African Common Bean Producers Purdue University Working Paper. 2011;11(6):1-29.
- M'mboyi F, Stephen M, Murenga M, Leah A. Maize production and improvement in Sub-Saharan Africa. African biotechnology stakeholder's forum (ABSF). Nairobi, Kenya, 2010. Proceedings Available at: www.absfafrica.org.
- Ndegawa MK, DeGroote H, Gitonga ZM, Bruce AY. Effectiveness and economics of hermetic bags for maize storage: results of a randomized controlled trial in Kenya. Crop Protect. 2016;90:17-26.
- Pardey PG, Koo B, Wright BD, Van Dusen ME, Skovmand B, Taba S. Costing the conservation of genetic resources. Crop Science. 2001;41(4):1286-1299.
- Proctor DL. Grain Storage Techniques: Evolution and Trends in Developing Countries. Rome: Food and Agriculture Organization, Agricultural Service Bulletin No. 109: 1994, 1-224.
- Sekumade A, Oluwatayo I. Comparative analysis of maize storage technologies in Kwara, State, Nigeria International Journal of Sustainable Crop Production. 2009;4:24-31.
- Shepherd A. A Guide to Maize Marketing for Extension Officers. Marketing Extension Guide (FAO), Rome, Italy. ISSN 1020-7317, 1999, 1-113.
- Thamaga-Chitja JM, Hendriks SI, Ortmann GF, Green M. Impact of Maize Storage on Rural Household Food Security in Northern Kwazulu -Natal. Journal of Family Ecology and Consumer Sciences. 2004;32:8-15. ISSN 0378-5254
- Tefera T, Kanampiu F, Groote H De, Hellin J, Mugo S, Kimenju S, et al. The metal silo: An effective grain storage technology for reducing post-harvest insect and pathogen losses in maize while improving smallholder farmers' food security in developing countries. Crop Protection. 2011;30(3):240-245.