
Research article · 2024 · Full text
International Journal of Agriculture Extension and Social DevelopmentSignificance of Google Scholar on Indian poultry science research
Volume 7(6S) · Pages 78–83 · DOI: 10.33545/26180723.2024.v7.i6sb.699 ↗
Research areasLivestock and Poultry ManagementIndigenous Knowledge Systems and Agriculture
Abstract
Author-writtenGoogle Scholar’s contribution towards the progress of scientific research in Poultry Science of India was studied using the scientific journal, “The Indian Journal of Poultry Science” (IJPS). A Scientometric study of IJPS for 25 Years between 1995 to 2019 using the Publish or Perish (PoP) software platform was conducted. Raw data from Google Scholar was subjected to 19 citation indicators. Source, Papers, Citations, Years, Citations¬¬_year, Citations_paper, Citations_author, Papers_author, Author’s_Paper, h_index, g_index, hc_index, hi_index, hi_norm, AWCR, AW_index, AWCRpA, e_index, hm_index, Query Date, Cites_Author_Year, Zipf’s Law examined annual contributions, authorship patterns and author productivity trends in scholarly publications. IJPS relative growth and doubling time were also examined in this study. The year that saw the most articles is 2009, next was the year 2012 followed by 2000 and 2001.
Summary
Source-checkedPlain-language reading of the full paper, prepared with AI and checked against the text. Each point links to the authors' own words.
Why it matters
- Scientometrics allows for the quantitative measurement of the impact of academic journals and research papers through the analysis of scientific citations. View evidence ↗
- The Indian Journal of Poultry Science (IJPS) covers a wide range of poultry science topics, including nutrition, genetics, and pathology. View evidence ↗
The question
- The study aimed to analyze the growth of the Indian Journal of Poultry Science and the research output of its contributors over a 25-year period from 1995 to 2019. View evidence ↗
What they did
- Researchers used the Publish or Perish (PoP) software to retrieve raw citation data from Google Scholar for the period 1995–2019. View evidence ↗
- The analysis included 920 articles, consisting of research articles, reviews, case studies, and short communications. View evidence ↗
- The study employed 19 different citation indicators and Zipf's Law to examine authorship patterns, productivity, and annual contributions. View evidence ↗
What they found
- The highest number of articles was published in 2009 (68 articles, 7.39%), followed by 2012 (67 articles, 7.28%) and 2000/2001 (58 articles each, 6.30%). View evidence ↗
- Over the 25-year period, the journal had 920 papers and 4,371 citations, averaging 161.89 citations per year and 4.75 citations per paper. View evidence ↗
- The degree of collaboration was found to be 1.00, with 3,178 authors contributing to multi-authored papers compared to only 15 single authors. View evidence ↗
- The highest citation count occurred in 2004 with 447 citations (10.23%) from 47 documents (5.11%), followed by 2000 (354 citations) and 2005 (319 citations). View evidence ↗
What it means
- The authors recommend conducting single journal impact studies every five years and making ORCID registration mandatory for contributing authors to ensure accurate identification. View evidence ↗
- The study noted errors in Zipf's law application due to the use of surnames and initials, which can lead to different authors with the same name being grouped together. View evidence ↗
Visual summary
1 visualsIllustrations explain the paper; they do not show study data.
Scientometric Workflow
AI-generated conceptual illustration (broiler chickens and a computer workstation). It explains the idea and does not show study data.
View source evidence ↗Figures & tables
From the original paper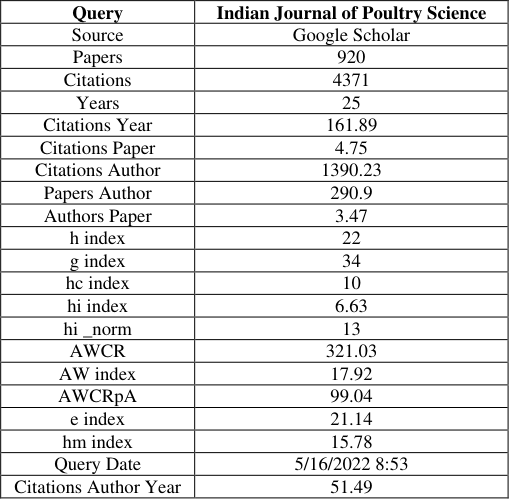 Table 1
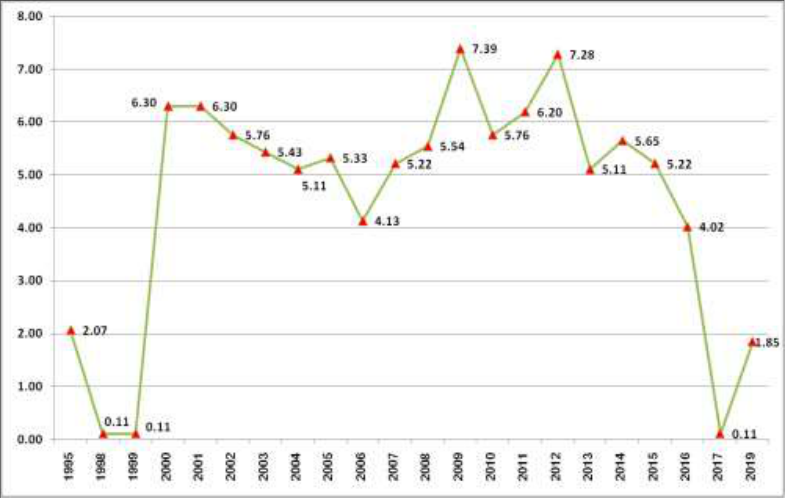 Figure 1
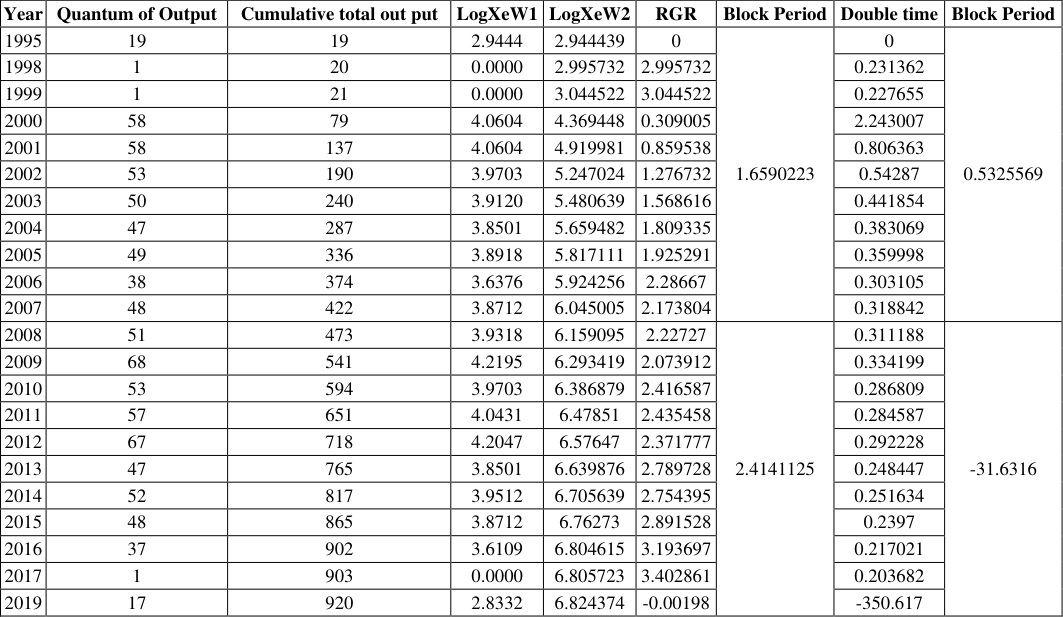 Table 2
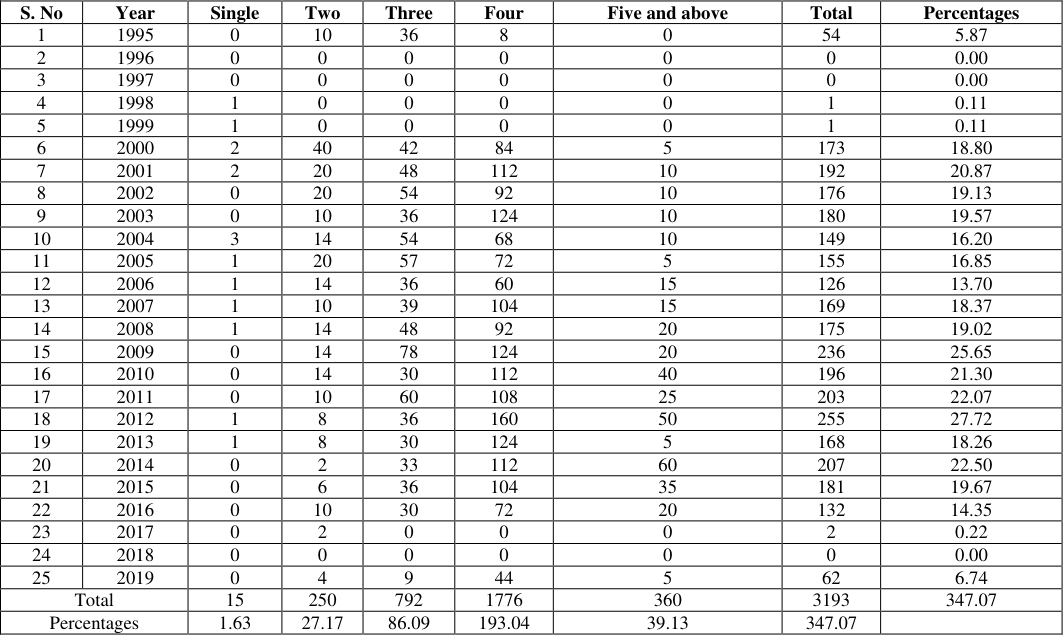 Table 3
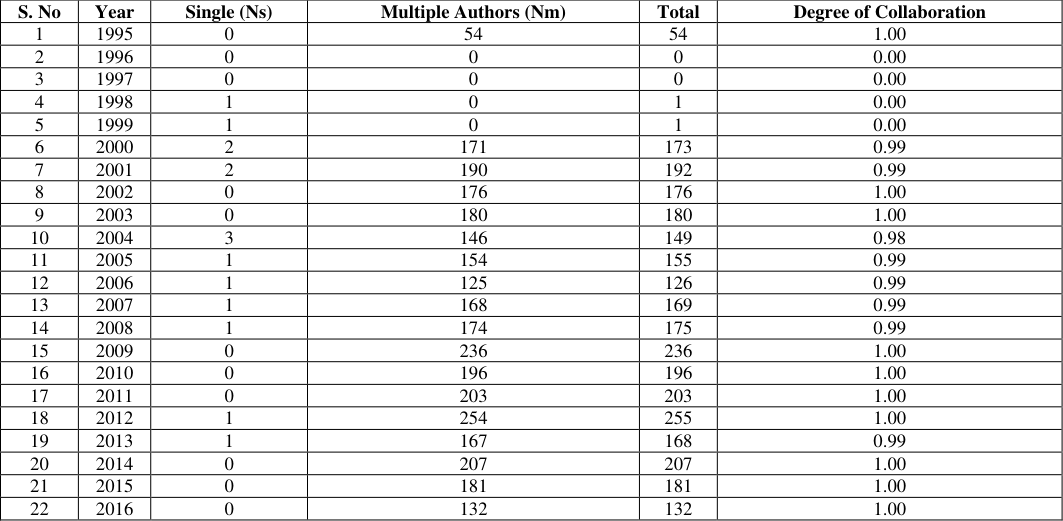 Table 4
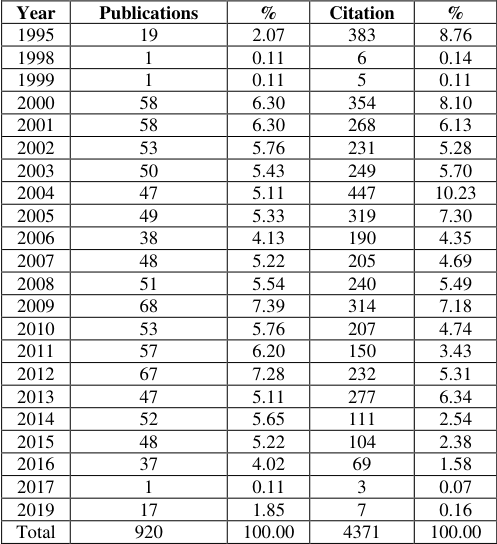 Table 5
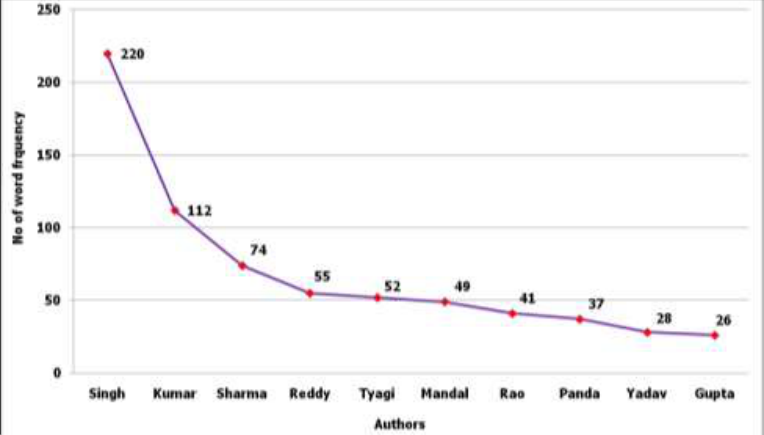 Figure 2
Introduction
Scientometrics is the study of quantitative aspects of scholarly literature like measurement of impact of research papers and academic journals, understanding of scientific citations and the use of such measurement in policy and management contexts. Derek De Solla Price is a pioneer of this subject that can aptly be called as "science of sciences". Scientometric analysis is a research method used to analyze scientific publications based on various parameters such as the number of publications, authorship, citations, journals, institutions and countries. The primary objective of this study using Google Scholar was to understand the growth of Indian Journal of Poultry Science (IJPS) and contributor's research output during the period from 1995 to 2019 (25 Years). The [8] author level index calculated by counting the number of publications for which an author has been cited by other authors at least the same number of times. g index is an author level metric suggested by Leo Egghe (2006) [3] . [11] proposed the Age Weighted Citation Rate (AWCR) which is the number of citations of a given paper divided by the age of that paper, Newer papers with less number of citations can be included in the AWCR. AW index, is the square root of AWCR to allow comparison with the h index of the average citation rate that remains more or less constant over the years. AWCRpA is the per author AWCR that is similar to the plain AWCR but is normalized to the number of authors for each paper. P o P calculates the e index as the cube root of the number of h-set citations greater than h 2, the minimum needed for an h index of 'h'.
Materials and Methods
The research data was collected from the online version of the Indian Journal of Poultry Science available in Publish or Perish, PoP (2022) during the period between 1995 to 2019 (25 years) and is used as the main source of information for the present study. PoP is a Microsoft Windows application that can also be installed and compatible with OS X, also referred to as Mac OS X (Macintosh Operating System) and Linux OS, with the aid of a suitable emulator such as cross over PoP, that retrieves and analyzes academic citations.
The study uses Google Scholar (2022) to obtain the raw citations to analyze various metrics. Among the 920 articles considered for the study, research articles, short communication, reviews and case studies were included. As a final point, the data was organized, calculated, tabulated, analyzed and presented in the form of tables and graphs for the purpose of interpretation and discussion. Table 1 offers some parameters, in terms of various simple statistics (number of papers, number of citations and number of authors) and various other citation metrics of Indian Journal of Poultry Science.
| Query | Indian Journal of Poultry Science |
|---|---|
| Source | Google Scholar |
| Papers | 920 |
| Citations | 4371 |
| Years | 25 |
| Citations Year | 161.89 |
| Citations Paper | 4.75 |
| Citations Author | 1390.23 |
| Papers Author | 290.9 |
| Authors Paper | 3.47 |
| h index | 22 |
| g index | 34 |
| hc index | 10 |
| hi index | 6.63 |
| hi norm | 13 |
| _ AWCR | 321.03 |
| AW index | 17.92 |
| AWCRpA | 99.04 |
| e index | 21.14 |
| hm index | 15.78 |
| Query Date | 5/16/2022 8:53 |
| Citations Author Year | 51.49 |
Table text extracted from the original PDF; superscript letters are shown inline. The original table image is below.
View original table image
Results and Discussion
According to Figure 1 Relative Growth Rate (RGR) is employed to find increase in the number of articles/ pages per unit of time. The mean Relative Growth Rate over specific period of interval can be calculated from the following equation (Hunt & Cornelissen, 1997) [9] . RGR = Mean relative growth rate over the specific period interval.
LogX e W 1 = Log of initial number of articles. LogX e W 2 = Log of final number of articles a specific period of interval. T 2 -T 1 = Unit difference between the initial time and the final time.
In this study, year is taken as unit of time for calculation of RGR.
Doubling Time (DT)
The parameter Doubling Time (DT) is directly related to RGR and indicates the time required for publications to become double of the existing volume. Doubling Time is unit for exponential growth equation. The Doubling Time is computed as follows.
Again, in the per year growth case, the expression for Doubling Time can be written as: Doubling Time .
The data relating to the growth output of Indian Journal of Poultry Science has been presented in The outcome is that the Degree of Collaboration grade is 1.00. In Table 4, statistics on the level of collaboration between single and multi-authored studies during the study period are displayed. 920 research publications included contributions from just 15 authors, while 3178 had many contributors.
| S. No | Year | Single (Ns) | Multiple Authors (Nm) | Total | Degree of Collaboration |
|---|---|---|---|---|---|
| 1 | 1995 | 0 | 54 | 54 | 1.00 |
| 2 | 1996 | 0 | 0 | 0 | 0.00 |
| 3 | 1997 | 0 | 0 | 0 | 0.00 |
| 4 | 1998 | 1 | 0 | 1 | 0.00 |
| 5 | 1999 | 1 | 0 | 1 | 0.00 |
| 6 | 2000 | 2 | 171 | 173 | 0.99 |
| 7 | 2001 | 2 | 190 | 192 | 0.99 |
| 8 | 2002 | 0 | 176 | 176 | 1.00 |
| 9 | 2003 | 0 | 180 | 180 | 1.00 |
| 10 | 2004 | 3 | 146 | 149 | 0.98 |
| 11 | 2005 | 1 | 154 | 155 | 0.99 |
| 12 | 2006 | 1 | 125 | 126 | 0.99 |
| 13 | 2007 | 1 | 168 | 169 | 0.99 |
| 14 | 2008 | 1 | 174 | 175 | 0.99 |
| 15 | 2009 | 0 | 236 | 236 | 1.00 |
| 16 | 2010 | 0 | 196 | 196 | 1.00 |
| 17 | 2011 | 0 | 203 | 203 | 1.00 |
| 18 | 2012 | 1 | 254 | 255 | 1.00 |
| 19 | 2013 | 1 | 167 | 168 | 0.99 |
| 20 | 2014 | 0 | 207 | 207 | 1.00 |
| 21 | 2015 | 0 | 181 | 181 | 1.00 |
| 22 | 2016 | 0 | 132 | 132 | 1.00 |
Table text extracted from the original PDF; superscript letters are shown inline. The original table image is below.
View original table image
Figures and tables from the paper
| Year | Quantum of Output | Cumulative total out put | LogXeW1 | LogXeW2 | RGR | Block Period | Double time | Block Period |
|---|---|---|---|---|---|---|---|---|
| 1995 | 19 | 19 | 2.9444 | 2.944439 | 0 | 1.6590223 | 0 | 0.5325569 |
| 1998 | 1 | 20 | 0.0000 | 2.995732 | 2.995732 | 0.231362 | ||
| 1999 | 1 | 21 | 0.0000 | 3.044522 | 3.044522 | 0.227655 | ||
| 2000 | 58 | 79 | 4.0604 | 4.369448 | 0.309005 | 2.243007 | ||
| 2001 | 58 | 137 | 4.0604 | 4.919981 | 0.859538 | 0.806363 | ||
| 2002 | 53 | 190 | 3.9703 | 5.247024 | 1.276732 | 0.54287 | ||
| 2003 | 50 | 240 | 3.9120 | 5.480639 | 1.568616 | 0.441854 | ||
| 2004 | 47 | 287 | 3.8501 | 5.659482 | 1.809335 | 0.383069 | ||
| 2005 | 49 | 336 | 3.8918 | 5.817111 | 1.925291 | 0.359998 | ||
| 2006 | 38 | 374 | 3.6376 | 5.924256 | 2.28667 | 0.303105 | ||
| 2007 | 48 | 422 | 3.8712 | 6.045005 | 2.173804 | 0.318842 | ||
| 2008 | 51 | 473 | 3.9318 | 6.159095 | 2.22727 | 2.4141125 | 0.311188 | -31.6316 |
| 2009 | 68 | 541 | 4.2195 | 6.293419 | 2.073912 | 0.334199 | ||
| 2010 | 53 | 594 | 3.9703 | 6.386879 | 2.416587 | 0.286809 | ||
| 2011 | 57 | 651 | 4.0431 | 6.47851 | 2.435458 | 0.284587 | ||
| 2012 | 67 | 718 | 4.2047 | 6.57647 | 2.371777 | 0.292228 | ||
| 2013 | 47 | 765 | 3.8501 | 6.639876 | 2.789728 | 0.248447 | ||
| 2014 | 52 | 817 | 3.9512 | 6.705639 | 2.754395 | 0.251634 | ||
| 2015 | 48 | 865 | 3.8712 | 6.76273 | 2.891528 | 0.2397 | ||
| 2016 | 37 | 902 | 3.6109 | 6.804615 | 3.193697 | 0.217021 | ||
| 2017 | 1 | 903 | 0.0000 | 6.805723 | 3.402861 | 0.203682 | ||
| 2019 | 17 | 920 | 2.8332 | 6.824374 | -0.00198 | -350.617 |
Table text extracted from the original PDF; superscript letters are shown inline. The original table image is below.
View original table image
| S. No | Year | Single | Two | Three | Four | Five and above | Total | Percentages |
|---|---|---|---|---|---|---|---|---|
| 1 | 1995 | 0 | 10 | 36 | 8 | 0 | 54 | 5.87 |
| 2 | 1996 | 0 | 0 | 0 | 0 | 0 | 0 | 0.00 |
| 3 | 1997 | 0 | 0 | 0 | 0 | 0 | 0 | 0.00 |
| 4 | 1998 | 1 | 0 | 0 | 0 | 0 | 1 | 0.11 |
| 5 | 1999 | 1 | 0 | 0 | 0 | 0 | 1 | 0.11 |
| 6 | 2000 | 2 | 40 | 42 | 84 | 5 | 173 | 18.80 |
| 7 | 2001 | 2 | 20 | 48 | 112 | 10 | 192 | 20.87 |
| 8 | 2002 | 0 | 20 | 54 | 92 | 10 | 176 | 19.13 |
| 9 | 2003 | 0 | 10 | 36 | 124 | 10 | 180 | 19.57 |
| 10 | 2004 | 3 | 14 | 54 | 68 | 10 | 149 | 16.20 |
| 11 | 2005 | 1 | 20 | 57 | 72 | 5 | 155 | 16.85 |
| 12 | 2006 | 1 | 14 | 36 | 60 | 15 | 126 | 13.70 |
| 13 | 2007 | 1 | 10 | 39 | 104 | 15 | 169 | 18.37 |
| 14 | 2008 | 1 | 14 | 48 | 92 | 20 | 175 | 19.02 |
| 15 | 2009 | 0 | 14 | 78 | 124 | 20 | 236 | 25.65 |
| 16 | 2010 | 0 | 14 | 30 | 112 | 40 | 196 | 21.30 |
| 17 | 2011 | 0 | 10 | 60 | 108 | 25 | 203 | 22.07 |
| 18 | 2012 | 1 | 8 | 36 | 160 | 50 | 255 | 27.72 |
| 19 | 2013 | 1 | 8 | 30 | 124 | 5 | 168 | 18.26 |
| 20 | 2014 | 0 | 2 | 33 | 112 | 60 | 207 | 22.50 |
| 21 | 2015 | 0 | 6 | 36 | 104 | 35 | 181 | 19.67 |
| 22 | 2016 | 0 | 10 | 30 | 72 | 20 | 132 | 14.35 |
| 23 | 2017 | 0 | 2 | 0 | 0 | 0 | 2 | 0.22 |
| 24 | 2018 | 0 | 0 | 0 | 0 | 0 | 0 | 0.00 |
| 25 | 2019 | 0 | 4 | 9 | 44 | 5 | 62 | 6.74 |
| Total | 15 | 250 | 792 | 1776 | 360 | 3193 | 347.07 | |
| Percentages | 1.63 | 27.17 | 86.09 | 193.04 | 39.13 | 347.07 |
Table text extracted from the original PDF; superscript letters are shown inline. The original table image is below.
View original table image
| Year | Publications | % | Citation | % |
|---|---|---|---|---|
| 1995 | 19 | 2.07 | 383 | 8.76 |
| 1998 | 1 | 0.11 | 6 | 0.14 |
| 1999 | 1 | 0.11 | 5 | 0.11 |
| 2000 | 58 | 6.30 | 354 | 8.10 |
| 2001 | 58 | 6.30 | 268 | 6.13 |
| 2002 | 53 | 5.76 | 231 | 5.28 |
| 2003 | 50 | 5.43 | 249 | 5.70 |
| 2004 | 47 | 5.11 | 447 | 10.23 |
| 2005 | 49 | 5.33 | 319 | 7.30 |
| 2006 | 38 | 4.13 | 190 | 4.35 |
| 2007 | 48 | 5.22 | 205 | 4.69 |
| 2008 | 51 | 5.54 | 240 | 5.49 |
| 2009 | 68 | 7.39 | 314 | 7.18 |
| 2010 | 53 | 5.76 | 207 | 4.74 |
| 2011 | 57 | 6.20 | 150 | 3.43 |
| 2012 | 67 | 7.28 | 232 | 5.31 |
| 2013 | 47 | 5.11 | 277 | 6.34 |
| 2014 | 52 | 5.65 | 111 | 2.54 |
| 2015 | 48 | 5.22 | 104 | 2.38 |
| 2016 | 37 | 4.02 | 69 | 1.58 |
| 2017 | 1 | 0.11 | 3 | 0.07 |
| 2019 | 17 | 1.85 | 7 | 0.16 |
| Total | 920 | 100.00 | 4371 | 100.00 |
Table text extracted from the original PDF; superscript letters are shown inline. The original table image is below.
View original table image
References
8 in the original paper- Ahmed A, Adam M, Gharf NA, Muhammad M, Ebrahim NA. Impact of Article Page Count and Number of Authors on Citations in Disability Related Fields: A Systematic Review Article. Iran J Public Health. 2016;45(9):1118-1125. Available from: https://www.ncbi.nlm.nih.gov/pmc/articles/PMC51494 65
- DeGroote S. Subject and Course Guides: Measuring Your Impact: Impact Factor, Citation Analysis, and other Metrics: Citation Analysis. [Internet]. 2022. Available from: https://researchguides.uic.edu/c.php?g=252299&p=168 3205
- Google Scholar. Google Scholar. [Internet]. 2022. Available from: https://scholar.google.com/
- Harzing.com. Publish or Perish. [Internet]. 2022. Available from: https://harzing.com/resources/publishor-perish
- Hermetic. Word Frequency Counter (Advanced): Zipf's Law. [Internet]. 2022. Available from: https://www.hermetic.ch/wfca/zipf.htm
- Hunt R, Cornelissen JHC. Components of relative growth rate and their interrelations in 59 temperate plant species. New Phytol. 1997;135(3):395-417. DOI: 10.1046/j.1469-8137.1997.00671.x
- Jin B. The AR Index. Complementing the H-index. ISSI Newsletter International Society for Scientometrics and Infometrics. 2007;3(1):6. Available from: https://sci2s.ugr.es/sites/default/files/Tematic%20Websi tes/hindex/Jin001.pdf
- ORCID. ORCID. [Internet]. 2022. Available from: https://orcid.org/